If you've been using AI for Power BI development, you already know it handles the data modeling side well. The MCP server gives a large language model (LLM) direct access to your tables, measures, and relationships, and that alone speeds up the whole development process significantly.
But there's always been a hard limit: AI cannot create or modify visuals. Until now.
The unlock starts with one small change
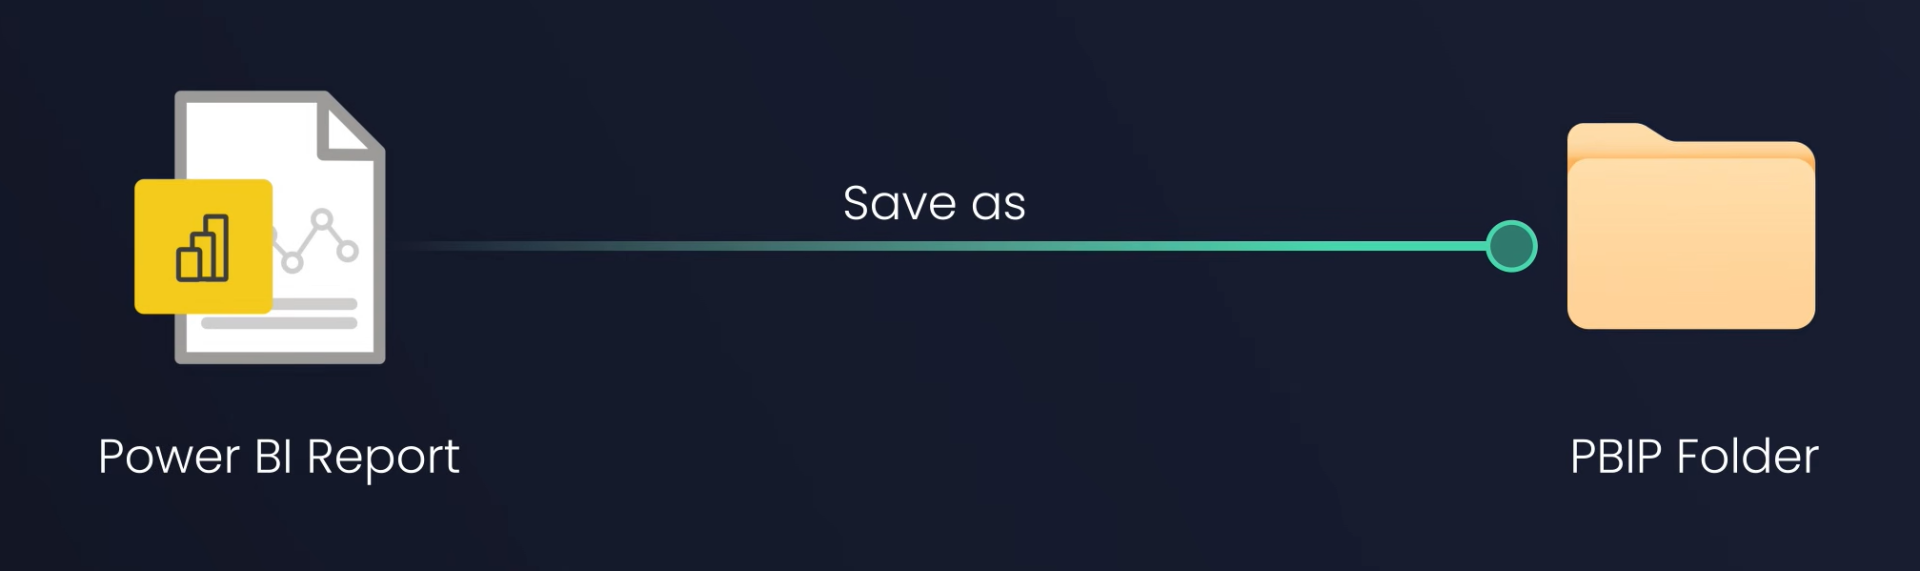
Power BI's standard .pbix format is a binary file. AI can't read it, can't edit it, can't touch it. But when you save your report as a Power BI Project (PBIP), everything changes. Your report is now stored as a folder of plain text and JSON files, one per visual, one per page. AI can read and modify those files directly.
That's the unlock. Everything else builds on this.
The missing piece: teaching AI your chart patterns
Here's the problem with just pointing AI at your PBIP files and asking it to build something. Large language models (LLM) don't know your undocumented Power BI file structures. They don't have your company's chart conventions. They don't know how to create your specific custom visuals. That's where Skills come in.
A Skill is simply a folder containing two things:
A SKILL.md file, which is a markdown file with a name and description at the top (in YAML front matter) followed by step-by-step instructions the model follows to produce the output.
Supporting template files, which are JSON and TMDL files that the model uses as building blocks. Visual configs, DAX measures, slicer layouts, and so on.
Note : The name and description matters more than anything else. They're loaded first across all your skills, and the model uses them to decide which skill to invoke based on what you ask for, before it ever loads the full instructions. Get those wrong and the skill won't trigger correctly.
How to build a Skill
The best part is that AI builds the skill for you. Here's the full process:
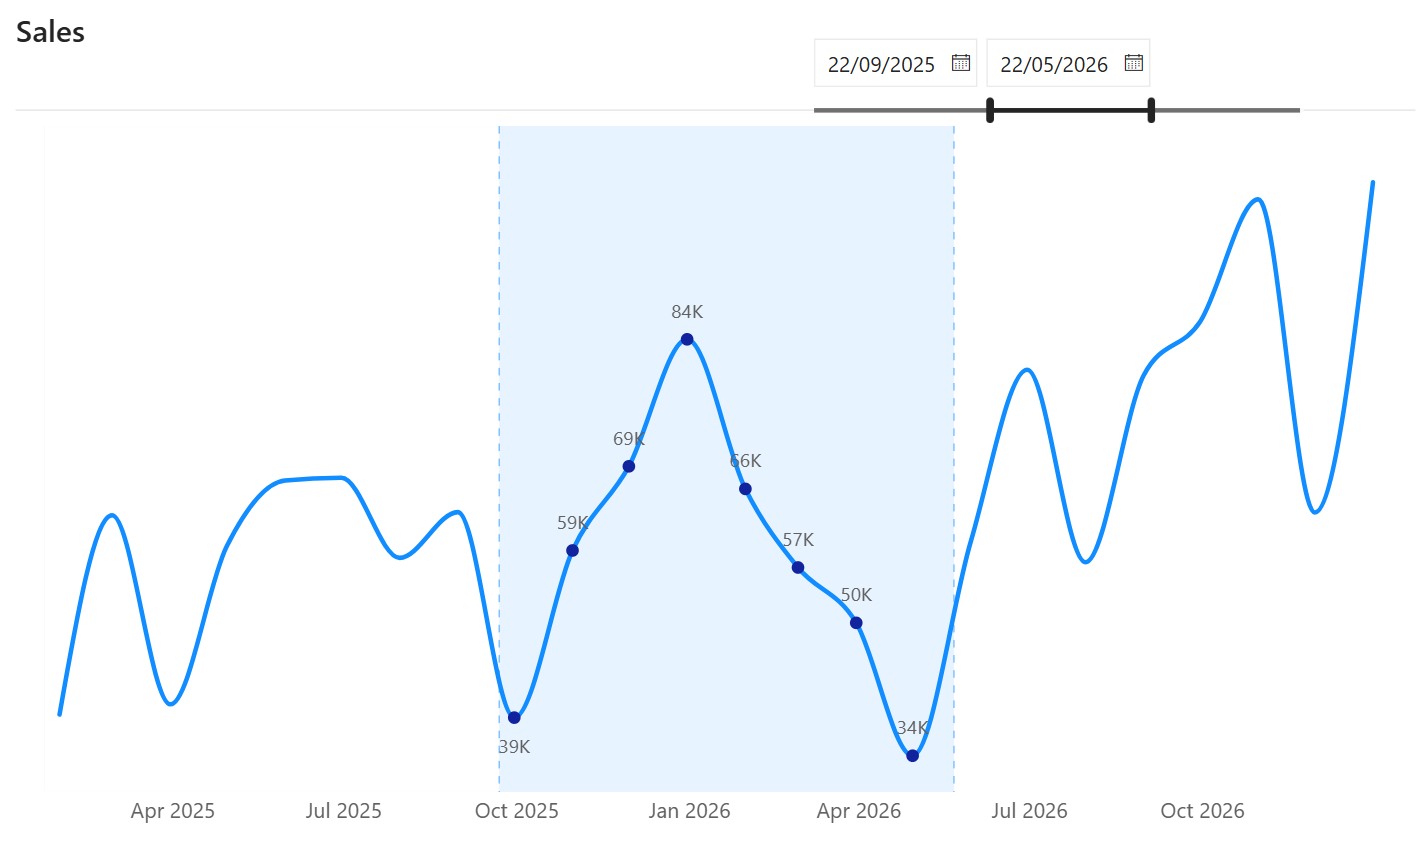
Start by recreating the chart you want to automate manually in Power BI. This becomes your reference.
As an example, the chart used here was a line chart with a slicer-driven time window highlight. The whole package: reference lines, a highlighted range, a disconnected date table handling the slicer, few new measures, and a visual calculation. If you can build it manually in Power BI, you can turn it into a skill. Anything within your PBIP folder is automatable.
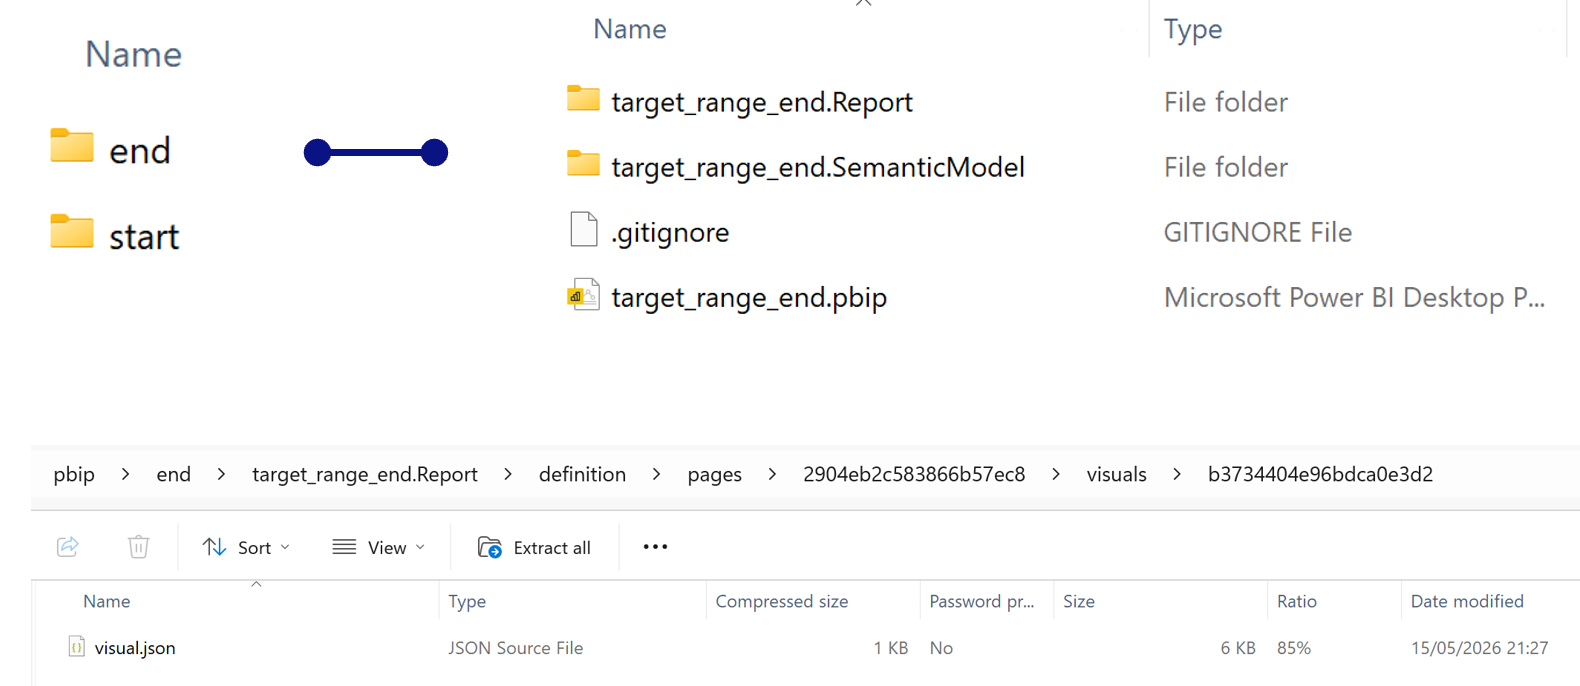
Then save two versions of that report in PBIP format, one before the chart exists (your start state) and one after (your end state). Store them in separate subfolders. Dig deeper into the “end” folder and you can see the "visuals.JSON" which contains information. Similarly, there will be all details of all elements used.
You can use Claude code / Codex / Visual Studio (VS) code. For my example, I use VS code.
Open Visual Studio Code, install the Claude Code extension, and give it a prompt like this -
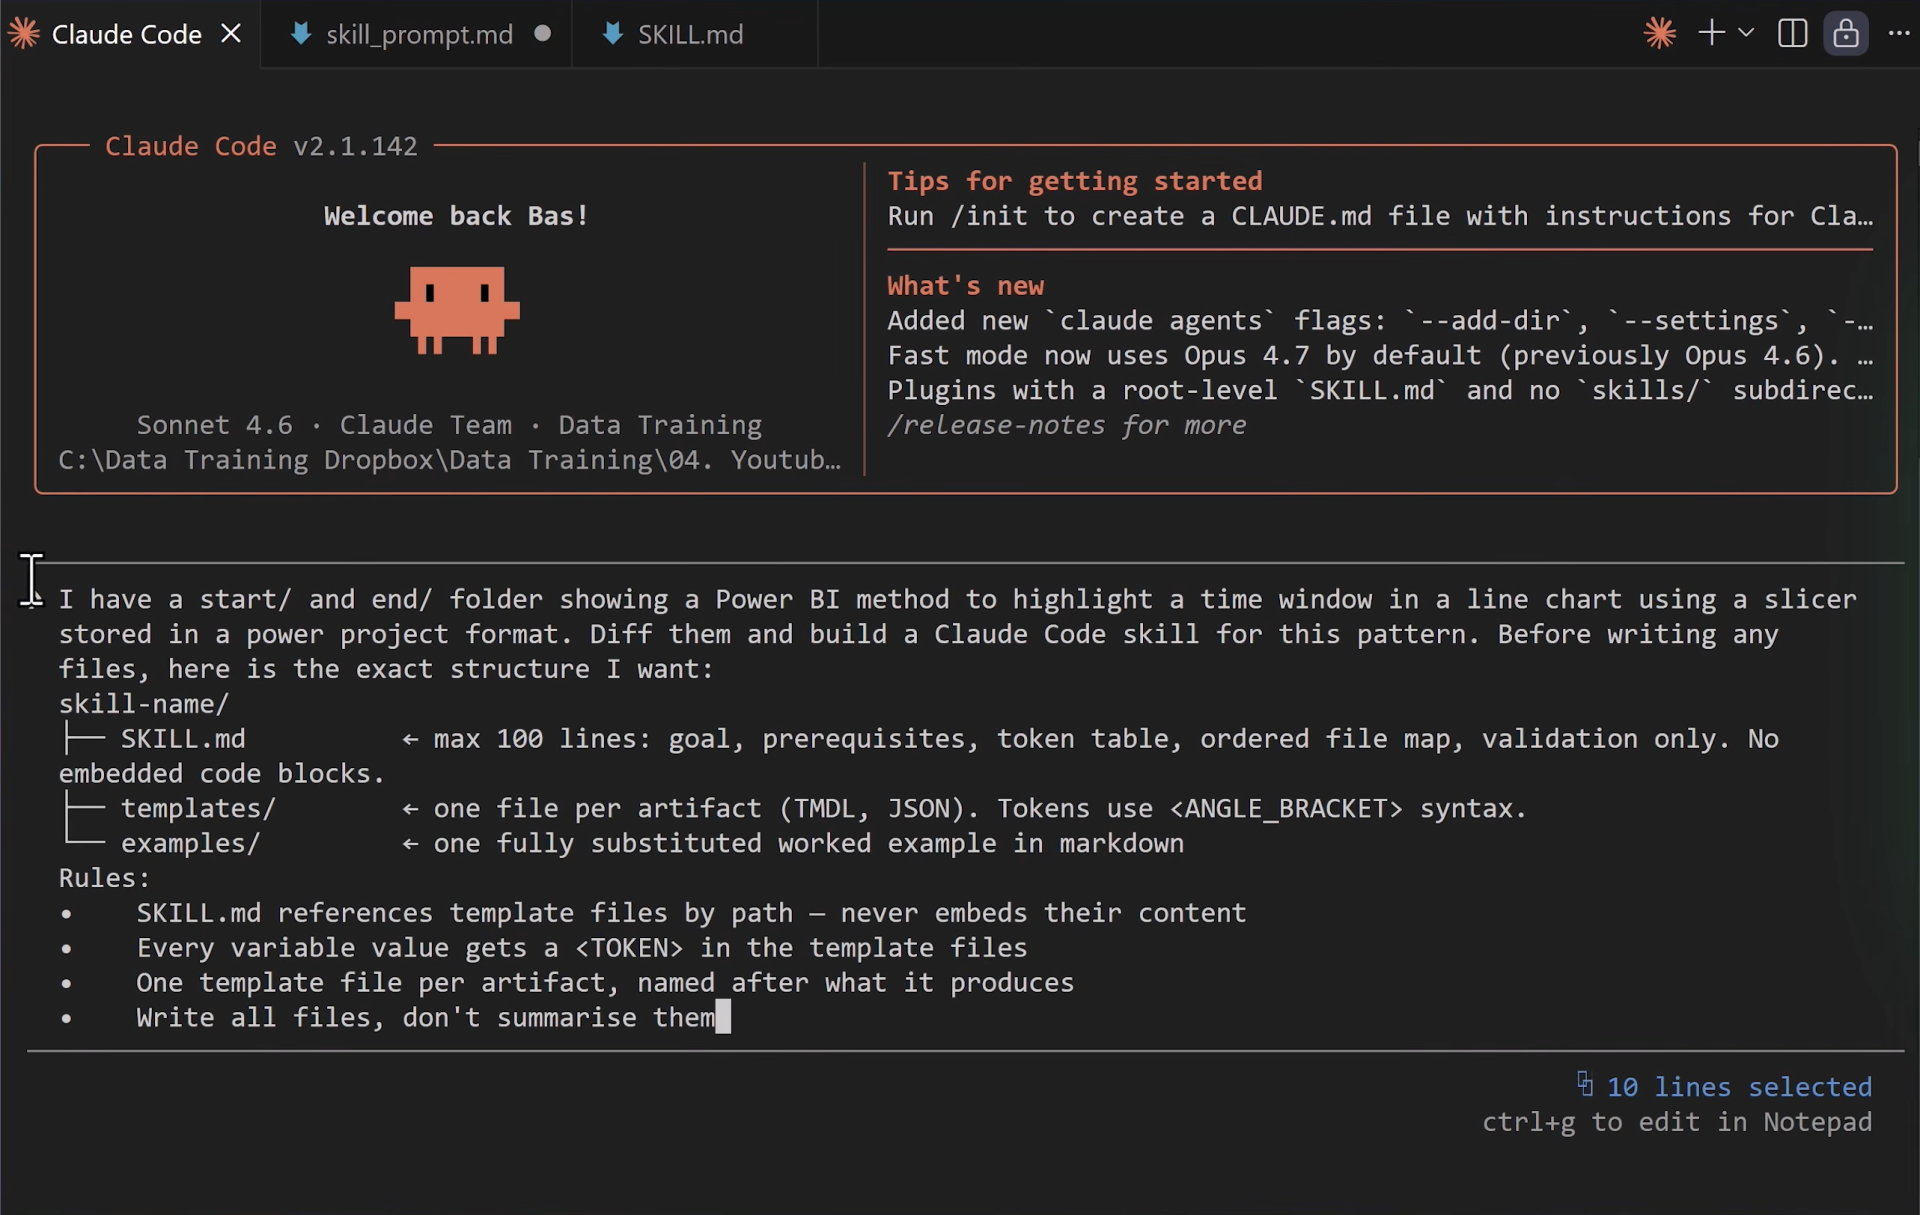
Claude analyzes both folders, identifies every difference including new measures, new visuals, new tables, and new relationships, lists them out, and then writes the SKILL.md and all the template files for you. The whole thing takes around 7 minutes (in my case).

One thing to check when it's done: make sure the YAML front matter at the top of the SKILL.md actually has a name and a description. In the demo, Claude forgot to include them. A quick follow-up prompt fixed it, but it's worth verifying before you move on.
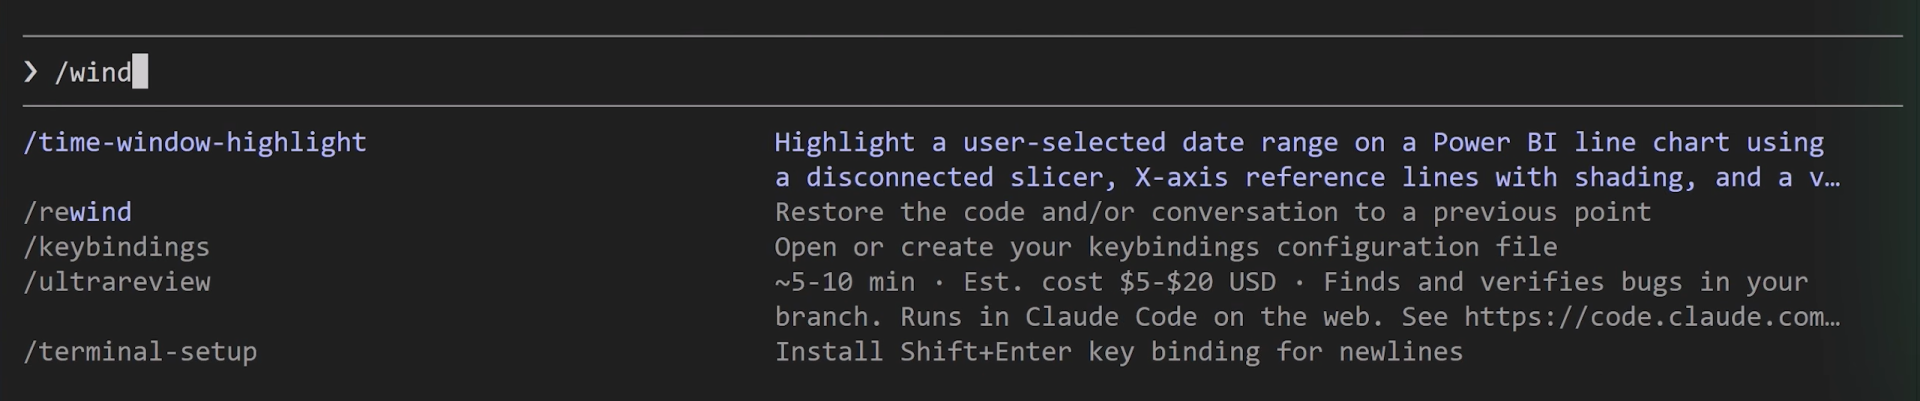
Once the skill is ready, copy the folder to ~/.claude/skills/ so Claude can always find it regardless of which project you're working in. You can verify it's discoverable by opening a new Claude Code terminal session and typing / followed by your skill name.
Using a Skill on a new report
This is where it gets satisfying. You don't reference the skill by name. You don't need to think about which skill to use. You just describe what you want:
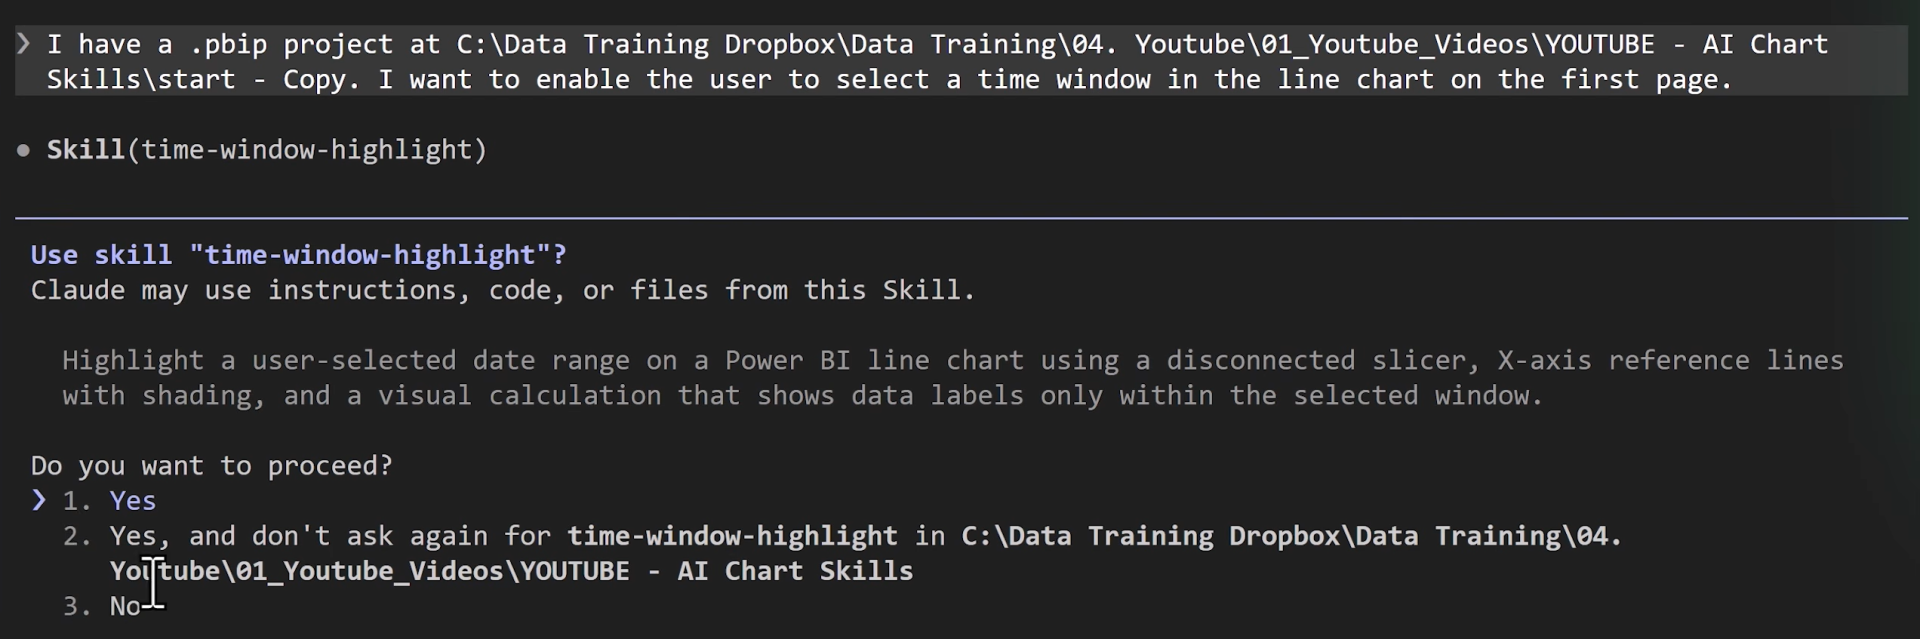
Claude figures out which skill applies, asks a few clarifying questions about which column for the x-axis, which measure for the y-axis, and where to store new DAX measures, and then edits the PBIP files directly. Open the report in Power BI and everything is there.
The demo tested this on Power BI's built-in sample dataset, a completely different data model from the one used to build the skill. It worked. The result included a dim date slicer, reference lines, a highlight area, a disconnected table, two new DAX measures, and a visual calculation, all generated automatically (everything we had in the visual we created earlier as reference).
A few things worth knowing
Building a skill is an
iterative process. You'll likely need a few follow-up prompts to handle edge cases.
Skills are also an open standard. Claude Code and Codex both support them. The skill just needs to be in a location the agent can find. You're not locked into one tool.
And the method works for any chart type. The same process that built the time window highlight skill was used to build a pagination skill for bar charts, same approach, same structure, completely different output.
The bigger picture
We were already able to make changes to the back end of Power BI reports through the data modelling MCP server. Now with
Skills and the PBIP format, the front end is open too. Any visual you can build manually, you can now automate and reuse across any report, any dataset, any data model.
The opportunities from here are genuinely endless.
Hope you like it!
Give it a try and see how it works for you! I’d love to hear what you think or see how you use this trick in your own reports.