
BY HOW TO POWER BI · 900K+ SUBSCRIBERS
Get the exact strategies, processes and skills my team and I use on every project.

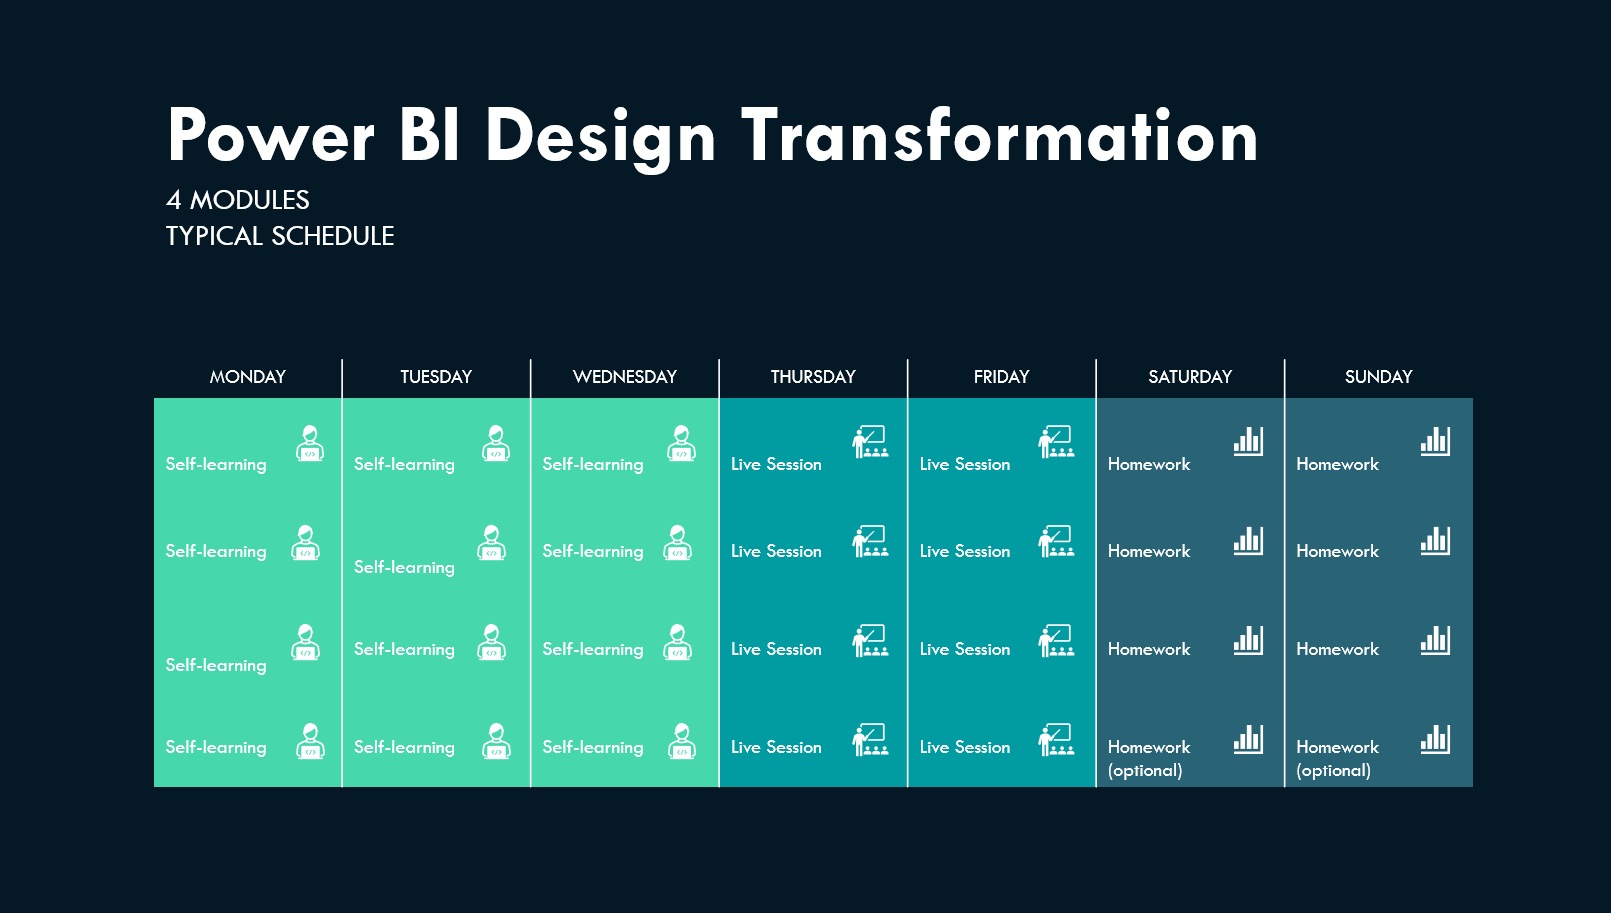
Power BI Design Transformation
Build Power BI Reports Better Than 99% of Developers
Get the exact strategies, processes and skills my team and I use on every project.
/01THE REAL PROBLEM
Technical Mastery won't save
a bad report.
Does this sound familiar?


/02THE SHIFT
Mindset switch that opens up opportunities.
/03THE METHOD
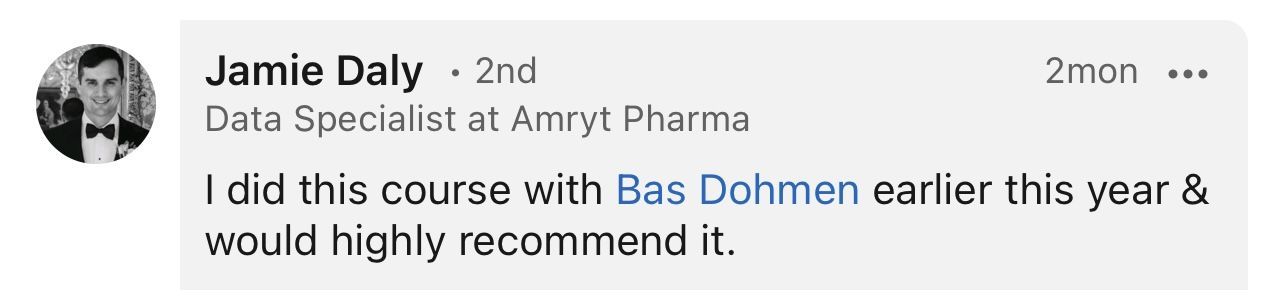
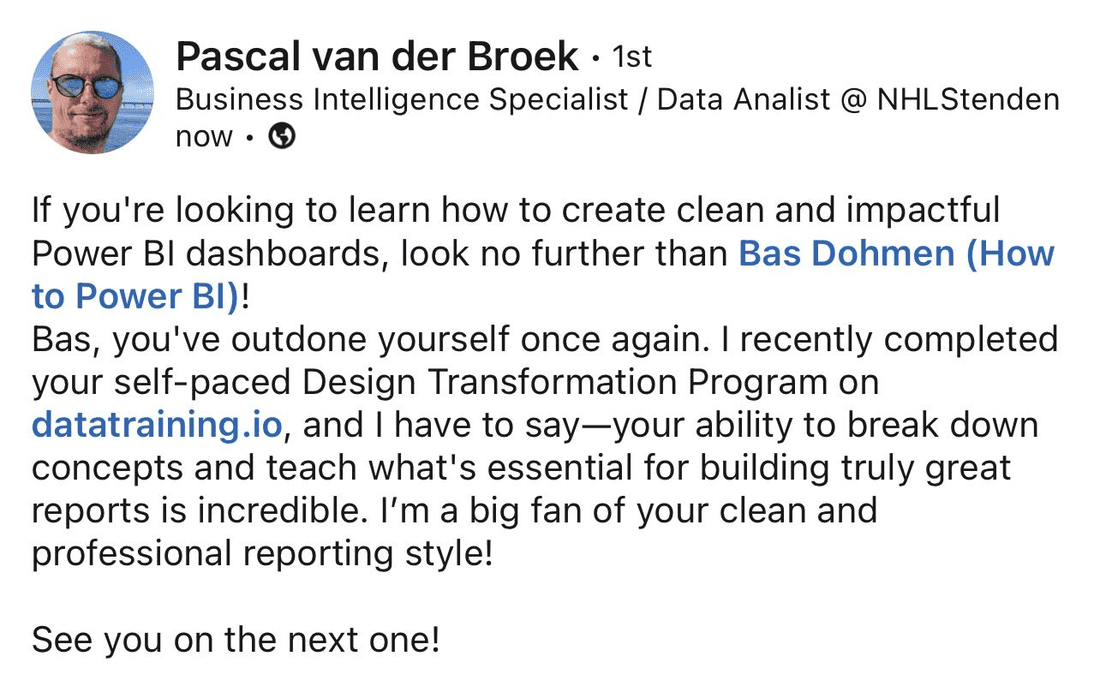
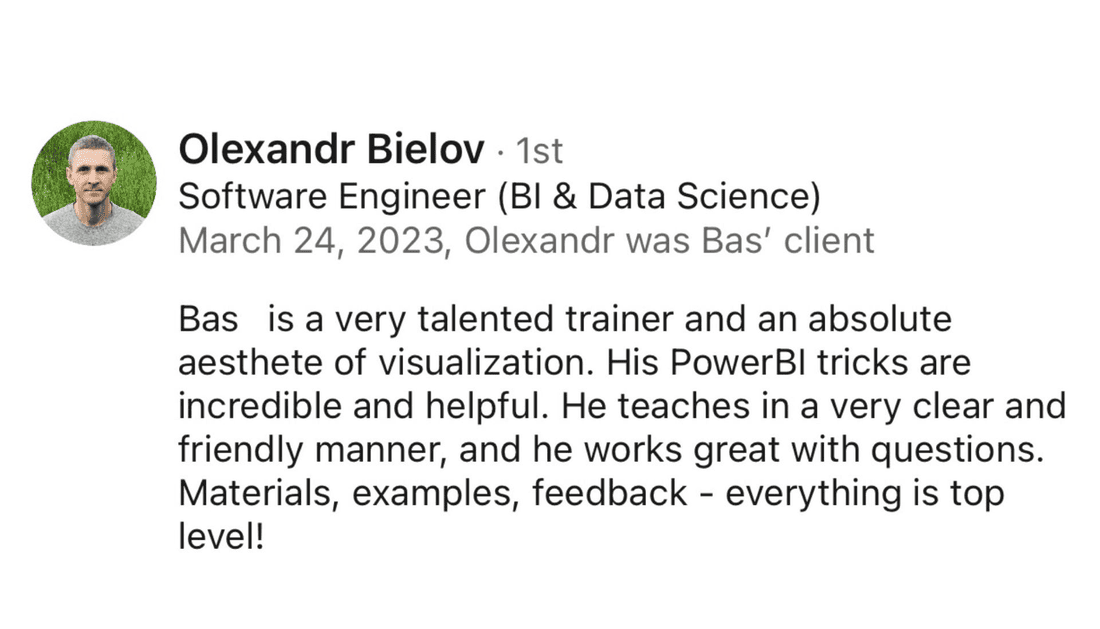
/04WHAT PARTICIPANTS SAY
Hear it from
people who took part.


/05IS THIS FOR YOU?
This program is intense.
It isn't for everyone.
It isn't for everyone.
/06WHAT'S INSIDE THE COURSE
Everything You Need to
Build Successful Power BI Reports.
4 weeks that completely redefine your workflow, output and career.
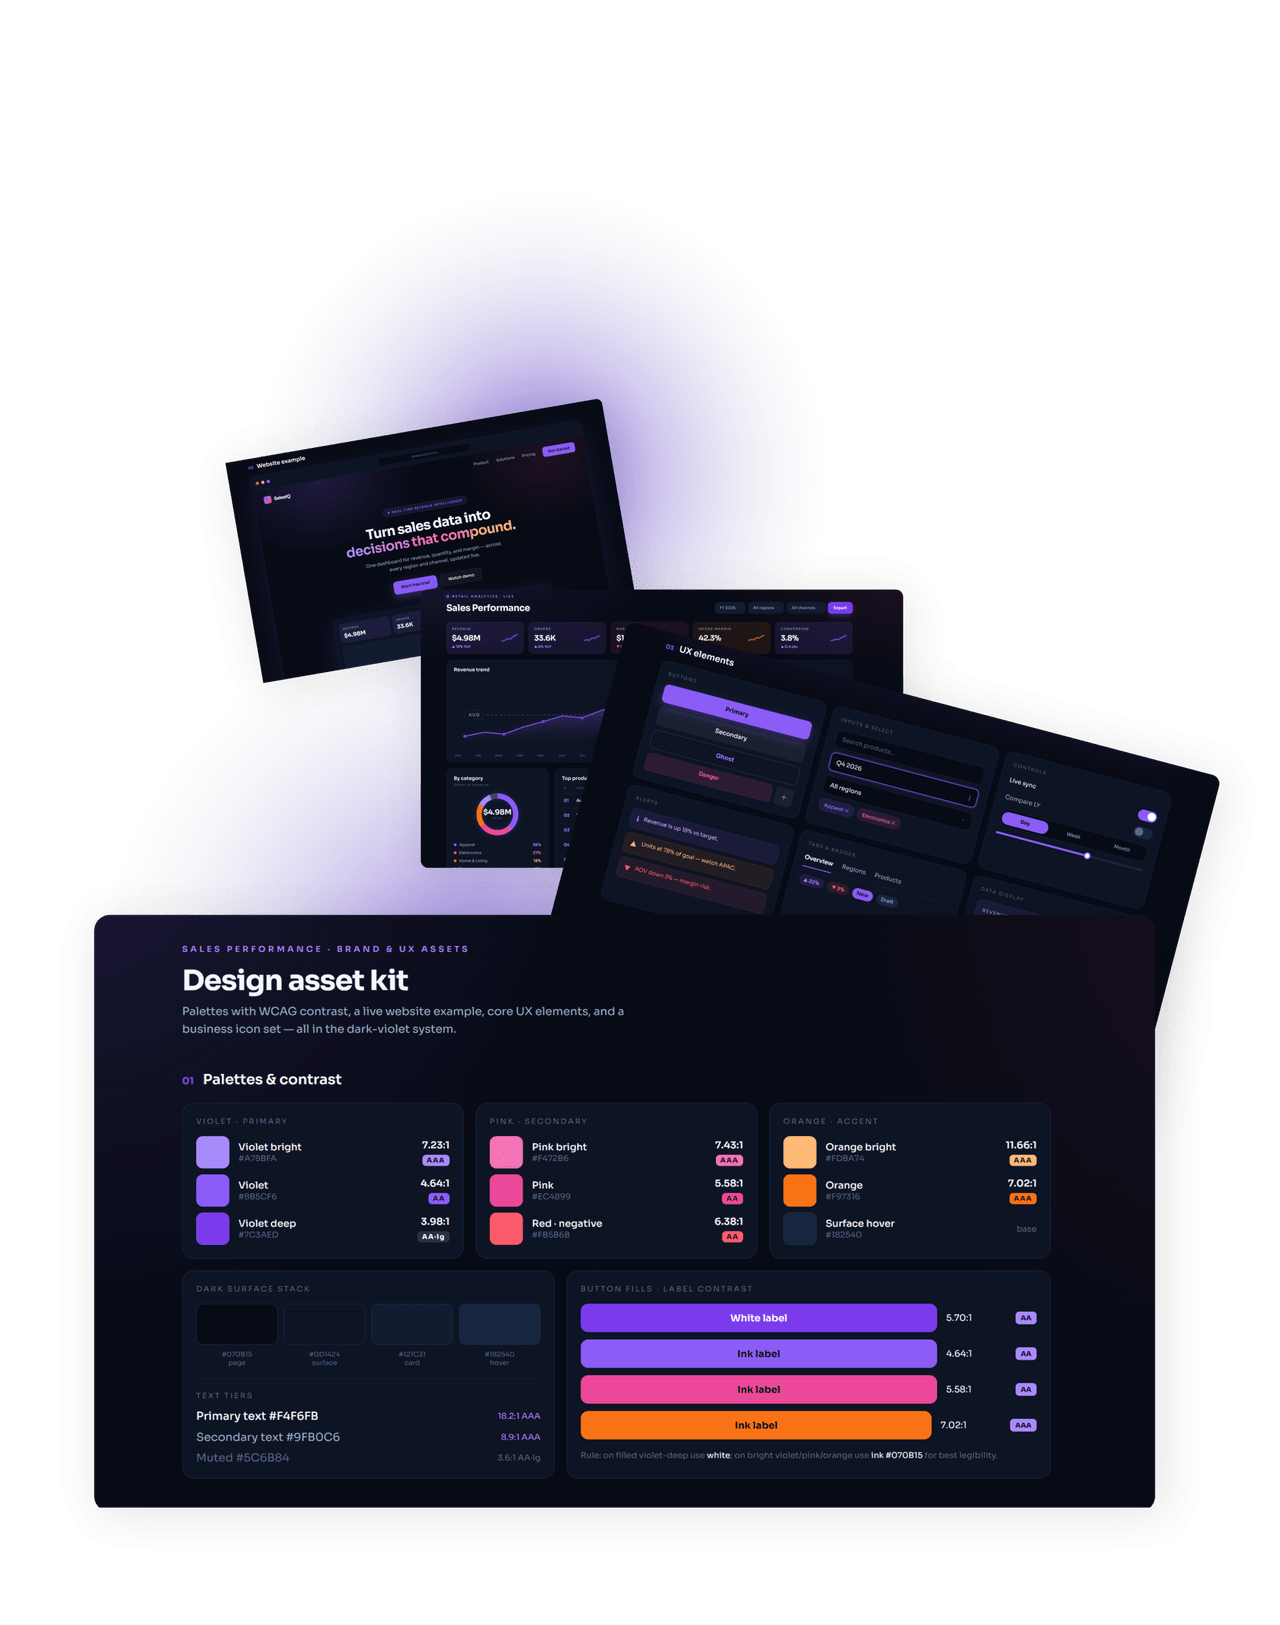
The exact assets my team uses on client work


Direct access to the person who built it


>NEW TOPICS IN SEPTEMBER 2026 LIVE SESSIONS
Use AI to Speed Up Power BI
Report Development
Report Development
Save your spot! This program starts in...
/07INSTRUCTOR
/083 WAYS TO JOIN
Pick the option
that fits how you work.
that fits how you work.
Design
Transformation
Design
Transformation
Design
Transformation
/09FAQ
At the beginning of each week you will receive access to this week focus topics. Before the Thursday session, you should watch the video content (approx. 1.5h a week). On Thursday and Friday, you will join live sessions (each 3.5h) where you will learn our Report Design Framework and practice/discuss key topics for that week. The recording will be available within 2h after session ends. Once the live sessions are over (after 4 weeks), you take a report that you work on (can be any report of your choice), and you use all the learning to improve this one. When you are done, schedule a 1:1 session with Bas to see how it can be further improved.
Yes, we have 2 sessions per day on both days. One is meant for EUROPE / ASIA / AUSTRALIA and the other for US/CA or evening in Europe.
Yes, every live session is done by Bas.
Yes, you can. The program is dedicated to people who have experience with Power BI and everyone is welcome to join. However, you will need to put some effort into preparation. We provide additional materials (Power BI Data Analyst PL 300 Training) to level up your Power BI knowledge before the program so you get the most out of it. If you need that, make sure to register in advance.
Live sessions are very valuable part of the program. This is where the most important points are discussed and where questions can directly be answered. However, if you can't attend a session or two, you can always watch the recording of the live session.
You will keep access for 2 years.
It is possible to cancel and get a full reimbursement 30 days before the beginning of the program. Participants switch is always possible so you can find a replacement (your colleague, friend, spouse) until 24h before the first session.
For individual registrations we do not provide discounts, except for Early Bird Discount and occasional BLACK WEEK Deals. When booking this program as a private team training (minimum 10 pax), we offer volume discounts. You may want to consider buying only the self-paced version to lower the cost.
You can pay in USD through our website or inquire invoice and pay in EUR.
Ask a
question
question
Stop shipping reports
nobody opens.
Write your awesome label here.
