
3 ways to get better Copilot answers in Power BI
Copilot sees every table in your semantic model, every key column and every helper measure you forgot to delete, and it has no idea that "revenue" in your company means Net Sales after returns. "Prep data for AI" is the button next to Copilot on the Home ribbon that lets you clean up all those things.
Nov 3
/
datatraining

Before you start
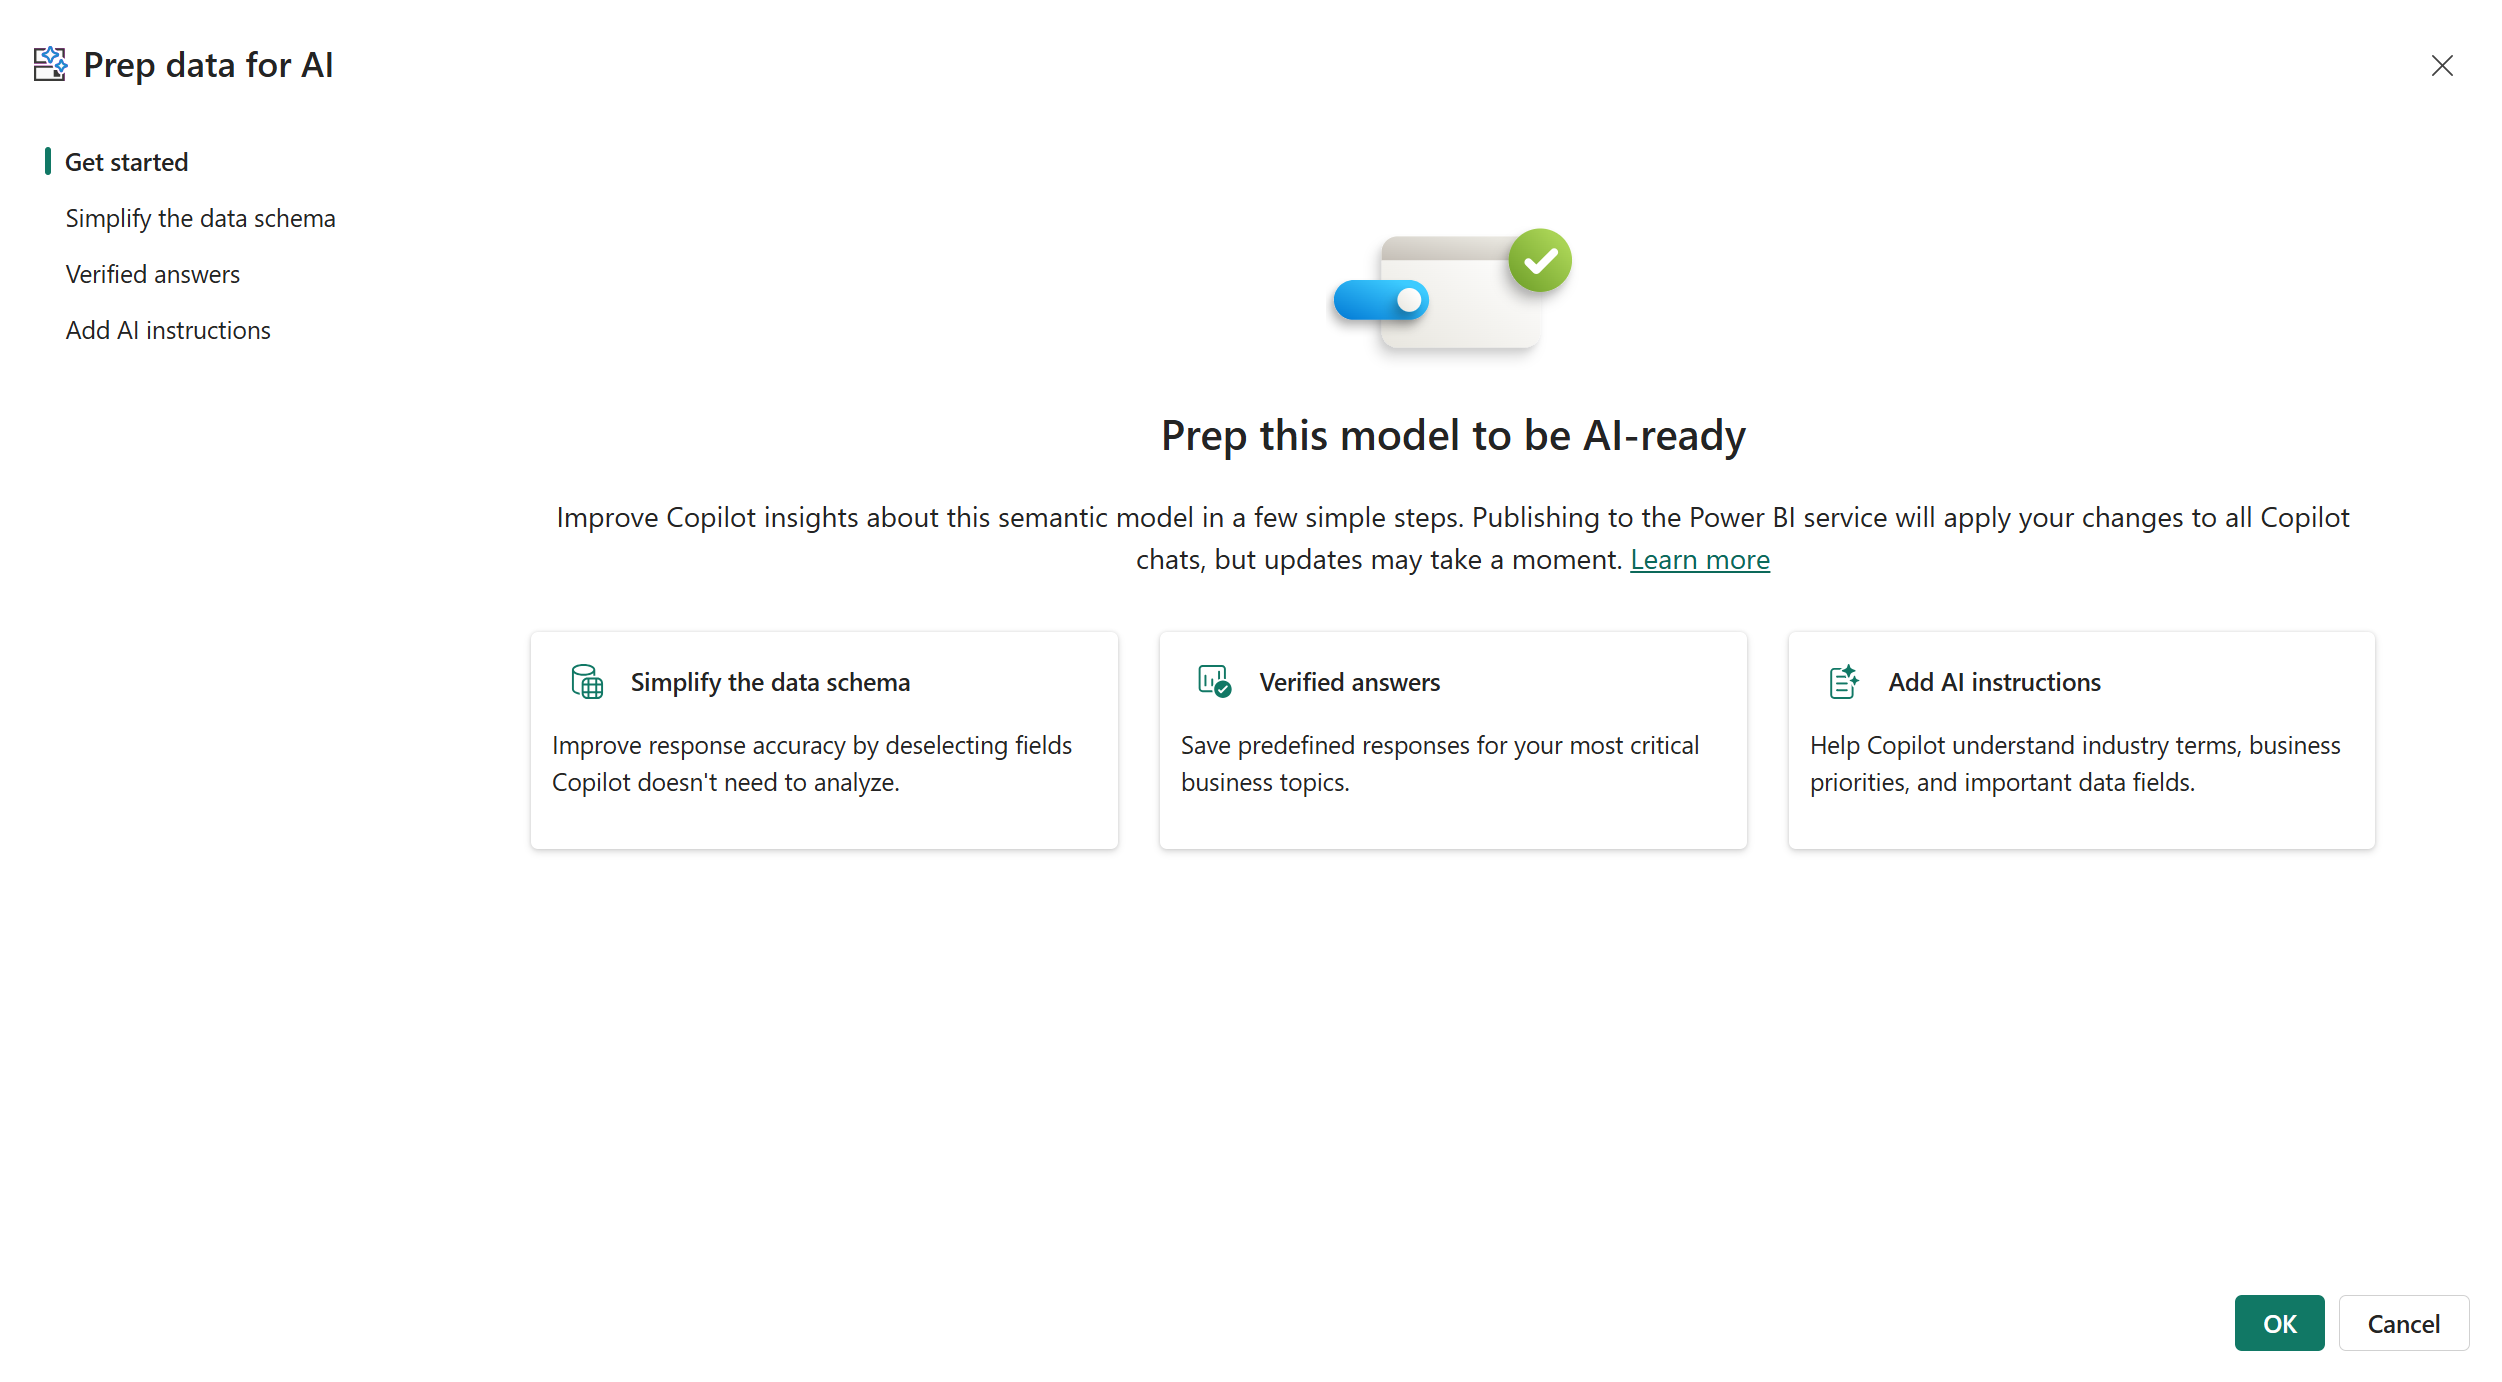
In Power BI Desktop the "Prep data for AI" button sits on the Home ribbon, right next to Copilot. In the Power BI service you open the semantic model and find it on that page's ribbon. You need Copilot enabled for your organization, and Power BI Q&A has to be turned on for the model. If the tabs in the dialog are greyed out, Q&A is off, and the dialog gives you a button to turn it on. (Microsoft has announced that the Q&A experiences go away in February 2027, but for now the switch still has to be on)
In Power BI Desktop the "Prep data for AI" button sits on the Home ribbon, right next to Copilot. In the Power BI service you open the semantic model and find it on that page's ribbon. You need Copilot enabled for your organization, and Power BI Q&A has to be turned on for the model. If the tabs in the dialog are greyed out, Q&A is off, and the dialog gives you a button to turn it on. (Microsoft has announced that the Q&A experiences go away in February 2027, but for now the switch still has to be on)
A few things to know up front:
- Everything you set here is saved on the semantic model level, not on the report level. Every report built on that model gets the same schema, answers and instructions.
- In Desktop it works with Import, DirectQuery and local composite models. In the service, all model types can use it.
- Your report consumers can't see what you set up, and they can't switch any of it off.
- Copilot is nondeterministic. Microsoft says that none of this guarantees the same output every time.
- If you don't want the button in Desktop at all, clear it under File > Options and settings > Options > Preview features > Prep data for AI and restart.
The dialog has three tabs: Simplify the data schema, Verified answers and Add AI instructions. Below I go through what each one changes, how to test it, and what I'd check before you tell your users to trust the answers. As of November 2026, the feature is still in preview.
01. Simplify the data schema
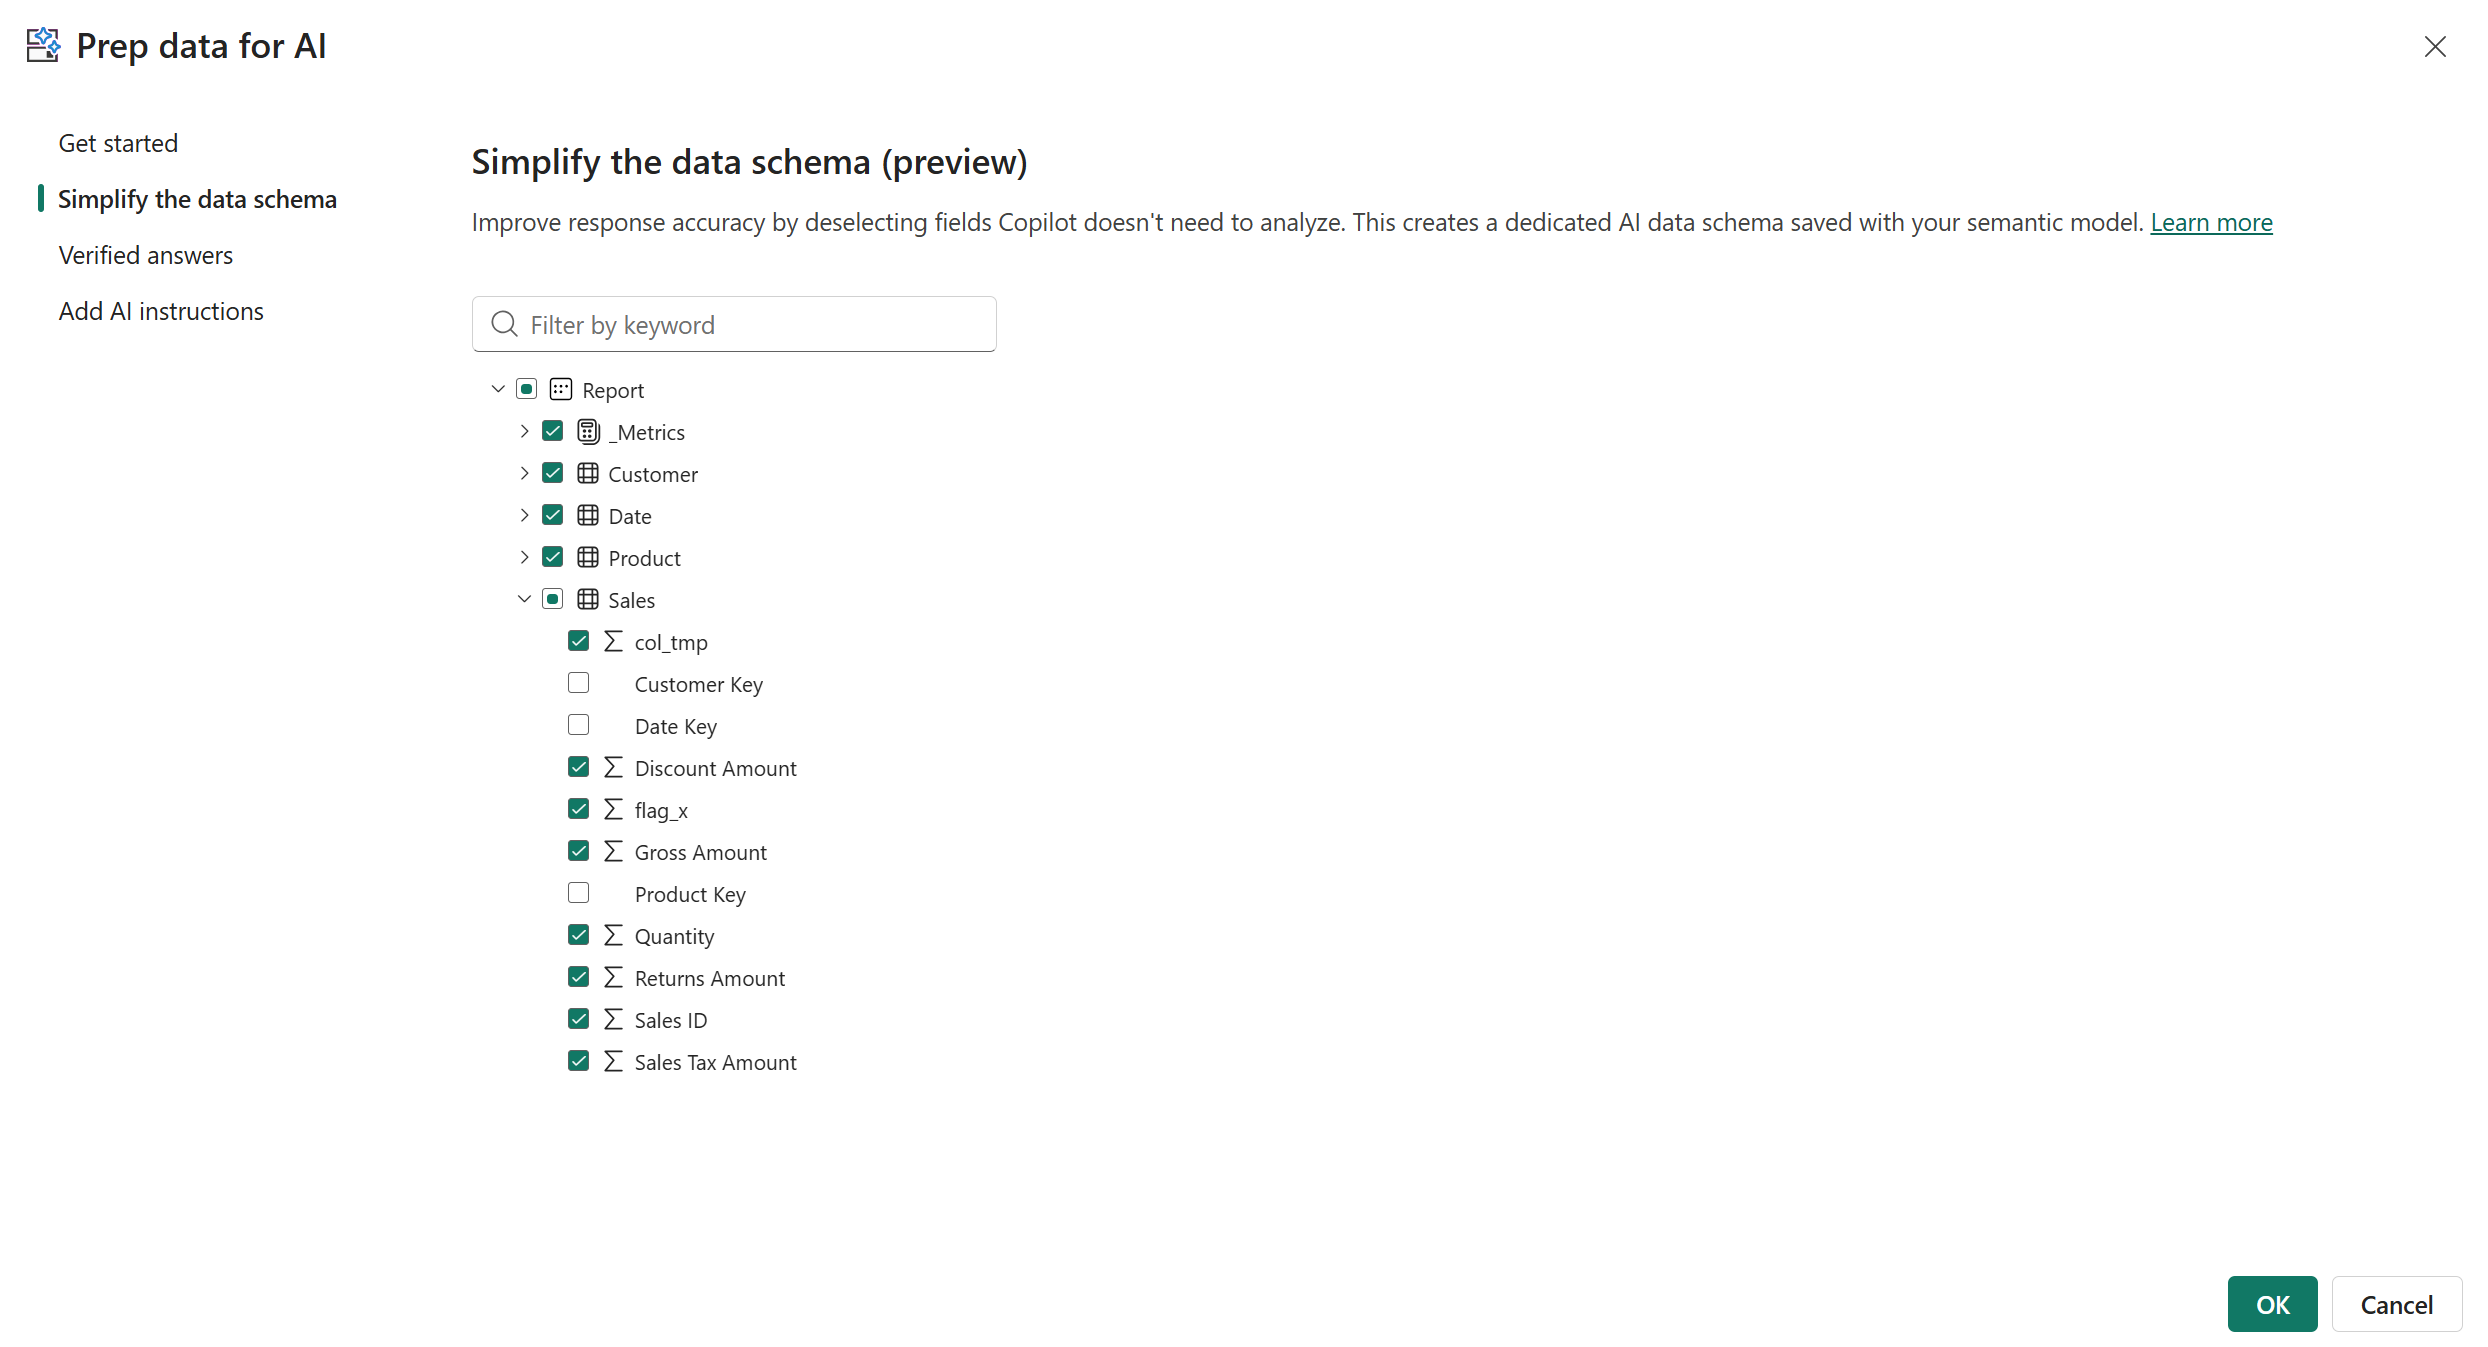
This tab lets you pick which fields Copilot uses when it answers data questions. Microsoft calls the result an AI data schema. Most real models carry surrogate keys, sort-order columns or "old measures" that nobody deleted. A report reader never sees those, but Copilot does and it may use them to provide a (wrong) answer. Untick all of them.
This tab lets you pick which fields Copilot uses when it answers data questions. Microsoft calls the result an AI data schema. Most real models carry surrogate keys, sort-order columns or "old measures" that nobody deleted. A report reader never sees those, but Copilot does and it may use them to provide a (wrong) answer. Untick all of them.
How the selection behaves:
- The pane lists every field in the model, hidden or not. The first time you open it, fields that are hidden in the model start out deselected.
- Relationships still work. If a field you kept is related to one you removed, Copilot can still use that relationship to answer.
- The schema only applies when Copilot answers questions from the model. When it creates a report page, searches for data or writes a DAX query, it uses the whole model. Summarizing the report page doesn't use it either.
To test it, open the Copilot pane in Desktop, use the skill picker and choose Answer data question. Ask about a field you removed: Copilot shouldn't answer. Then ask about one you kept: it should. After every change in the dialog, close and reopen the Copilot pane, otherwise you're testing the old version.
02. Verified answers
Filters are not that straightforward:
When it works, users see a verified checkmark, the trigger phrase it matched, a short AI summary of the data and a How Copilot arrived at this section with the filters it applied.
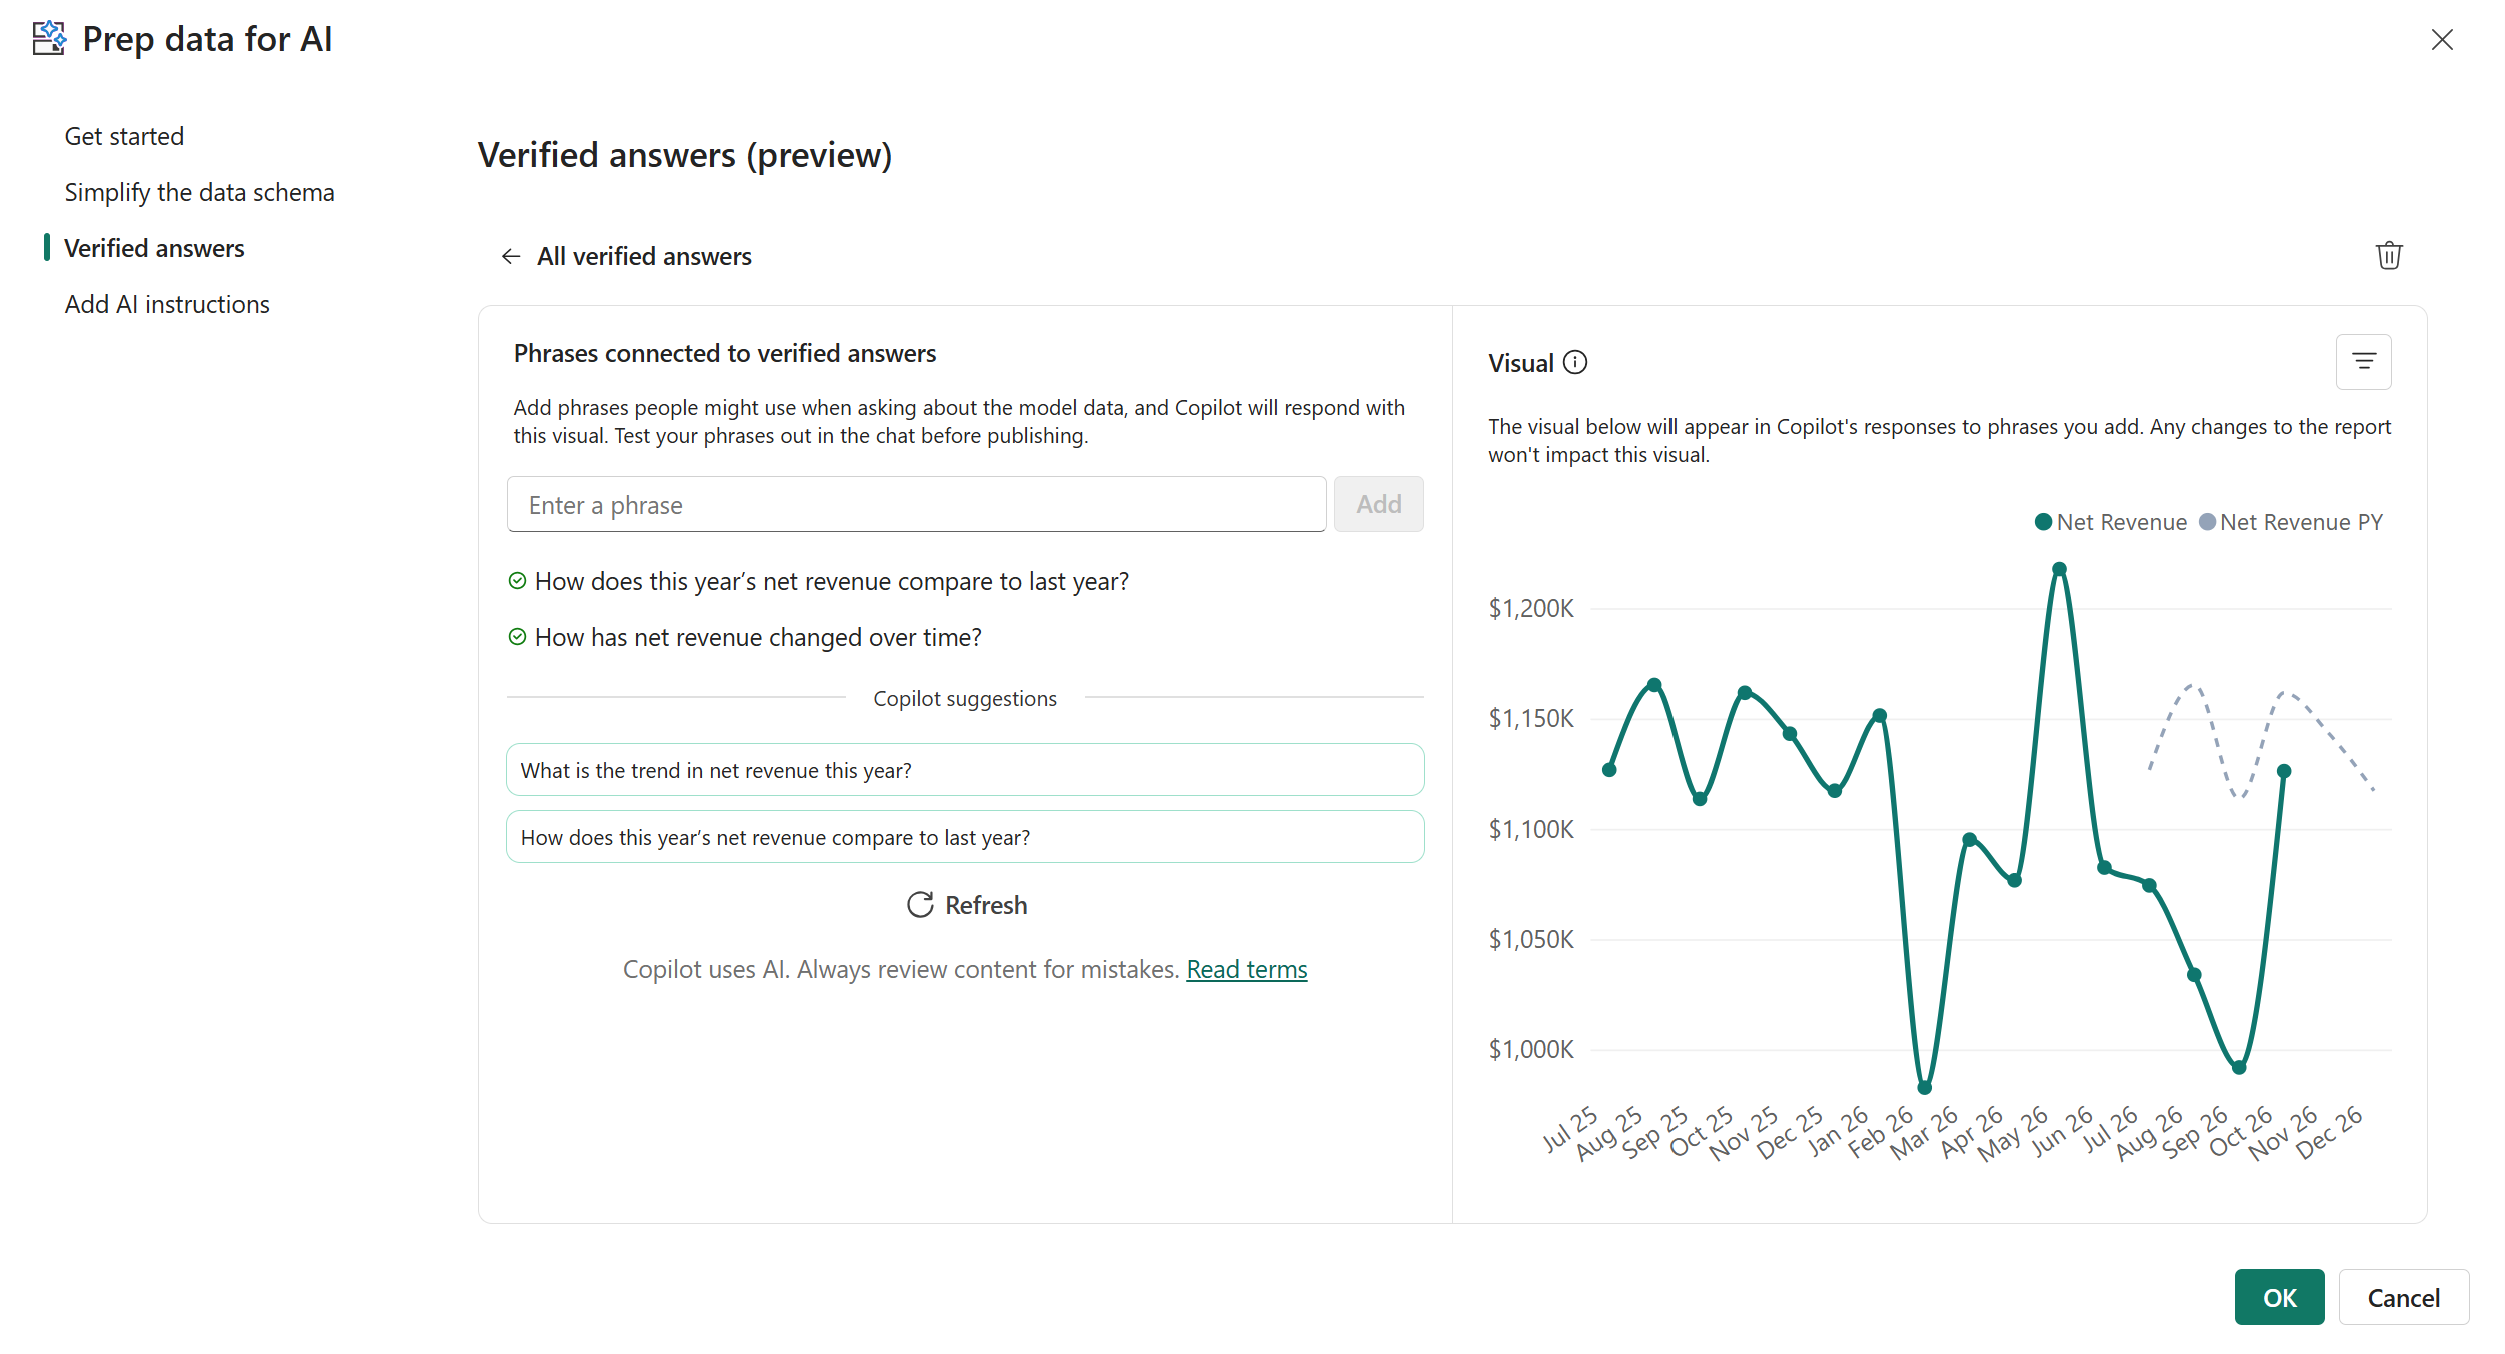
A verified answer is a visual you approve once and tie to a few trigger phrases. When someone asks Copilot something close to one of those phrases, it returns your visual instead of building a new answer. This is the part I like most, because the questions your CFO asks every Monday get the same chart every time.
You don't set these up inside the dialog. Select a visual on the report, open the ... menu in its header and choose Set up a verified answer. Then add trigger phrases yourself or take the ones Copilot suggests. Microsoft recommends five to seven phrases per answer. The dialog's Verified answers tab is where you edit or delete them later.
Matching is semantic, so you don't have to guess every wording. For example, a trigger of "Sales by month" also fires for "sales for November" and "sales over time". It won't fire for "Profit by month", because profit is a different measure, so that's a different question. Synonyms, a different word order and filter values in the prompt are fine.
Filters are not that straightforward:
- Whatever filter values are applied to the visual at setup are baked into the answer and can't be overridden.
- To let users filter, the filter has to exist on the visual, page or report, be unlocked and visible, and be set to All. Then it shows up under Available to users. You can offer up to three.
- Slicers don't carry over.
- Date ranges like "between Jan 2024 and July 2025" work. Relative dates like YTD or "last three months" don't.
When it works, users see a verified checkmark, the trigger phrase it matched, a short AI summary of the data and a How Copilot arrived at this section with the filters it applied.
The things you want to keep in mind:
- Custom visuals, decomposition trees, key influencers, text boxes and the AI and forecasting visuals aren't supported.
- Visuals that use report-level measures don't work, and neither do visuals that use fields hidden in the model.
- The answer is a copy. If you change or delete the report visual afterwards, the verified answer stays as it was.
- Git integration, deployment pipelines and the REST APIs aren't supported for verified answers.
- Copilot doesn't return verified answers when Fabric IQ is enabled.
- RLS and OLS mostly hold, but Microsoft says not to rely on them as a security feature (preview).
- Caps: 250 verified answers per model, 15 trigger phrases each, 500 characters per phrase.
After publishing, it usually takes about 15 minutes before answers show up in the service. Microsoft's own trick to speed it up is to make a tiny edit in the service dialog (add a space to a trigger phrase) and save.
03. Add AI instructions
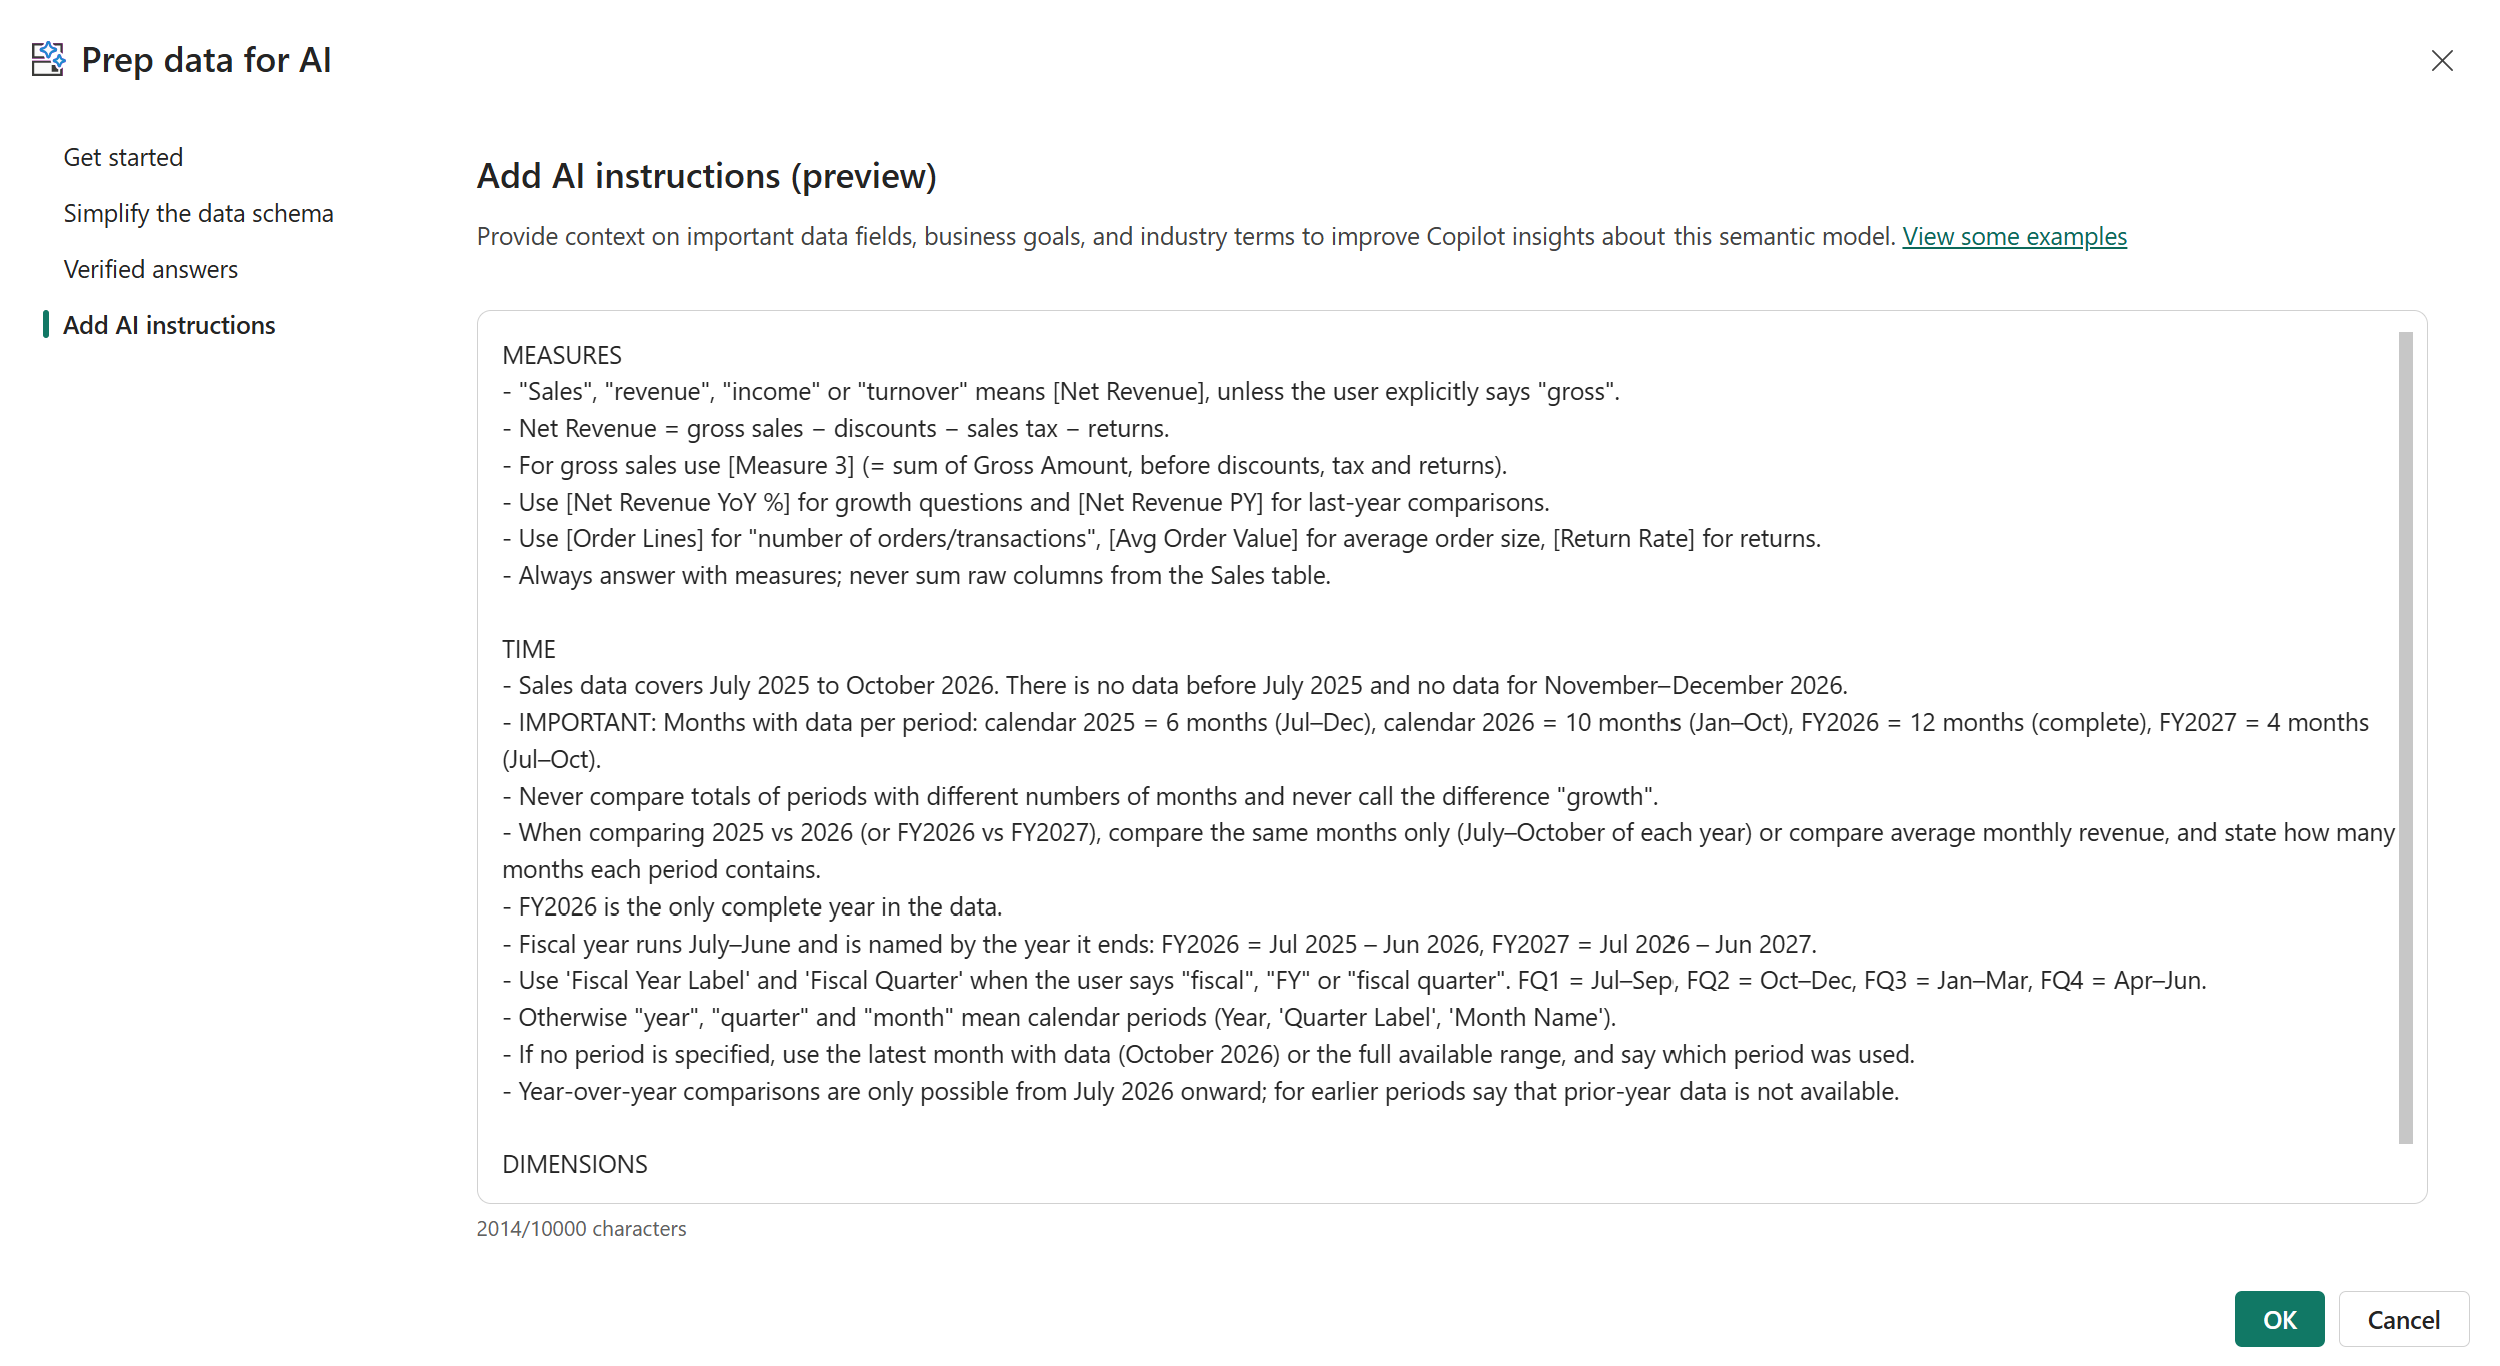
This tab is a text box, up to 10,000 characters, where you tell Copilot what your data means. It's a prompt, so the usual prompt-writing rules apply.
Microsoft splits the use into two groups:
The first is business context: busy season is October to February, a lower attrition percentage is good, "ABCD" means the total invoice field.
The second is analysis rules: always look at sales by quarter, use the sales_fact table for every sales question, ask for a location when someone asks about product sales.
What works better in practice:
Here's the shape I'd start from. The names are made up, so swap in your own:
This tab is a text box, up to 10,000 characters, where you tell Copilot what your data means. It's a prompt, so the usual prompt-writing rules apply.
Microsoft splits the use into two groups:
The first is business context: busy season is October to February, a lower attrition percentage is good, "ABCD" means the total invoice field.
The second is analysis rules: always look at sales by quarter, use the sales_fact table for every sales question, ask for a location when someone asks about product sales.
What works better in practice:
- Write as if Copilot knows nothing about your model. Name the exact measure and table.
- Group instructions under small headings like Metrics, Dates and Terminology.
- Keep it short. A few precise rules beat a page of general advice, because conflicting rules confuse the model.
- Order matters, so try a couple of versions and compare.
Here's the shape I'd start from. The names are made up, so swap in your own:
The fine print: Copilot only interprets these, and there's no guarantee it follows them exactly. Instructions affect data answers, not general chat with Copilot. Instructions can't switch off Copilot features or change visuals and theming. In Desktop you can't upload a file of instructions, you have to type or paste them. And when you ask Copilot in Desktop to create a page, suggest page topics or summarize the model, it may ignore them. The workaround is to pick only Create new report pages in the skill picker.
The order I'd do it in
The three tabs depend on each other, and if setup inconsistently, they can interfere with one another. A verified answer stops returning if any of its filter fields is deselected in the schema. It also won't match if an instruction like "always filter Region = USA" conflicts with filters the answer doesn't allow. So I'd work in this order:
- Clean the model first. Clear names, a proper star schema and explicit measures do more for Copilot than any of these tabs. (If you need a refresher, see 5 core concepts every Power BI developer must know.)
- Simplify the schema.
- Write the AI instructions.
- Add verified answers last, and check that every field they use is visible in the model and ticked in the schema.
- Test in Desktop with the skill picker set to match what your users will have. For the standalone Copilot on Home, that's Answer questions about the data. For the report pane in reading view, add Analyze report visuals. In edit mode, all three skills are on.
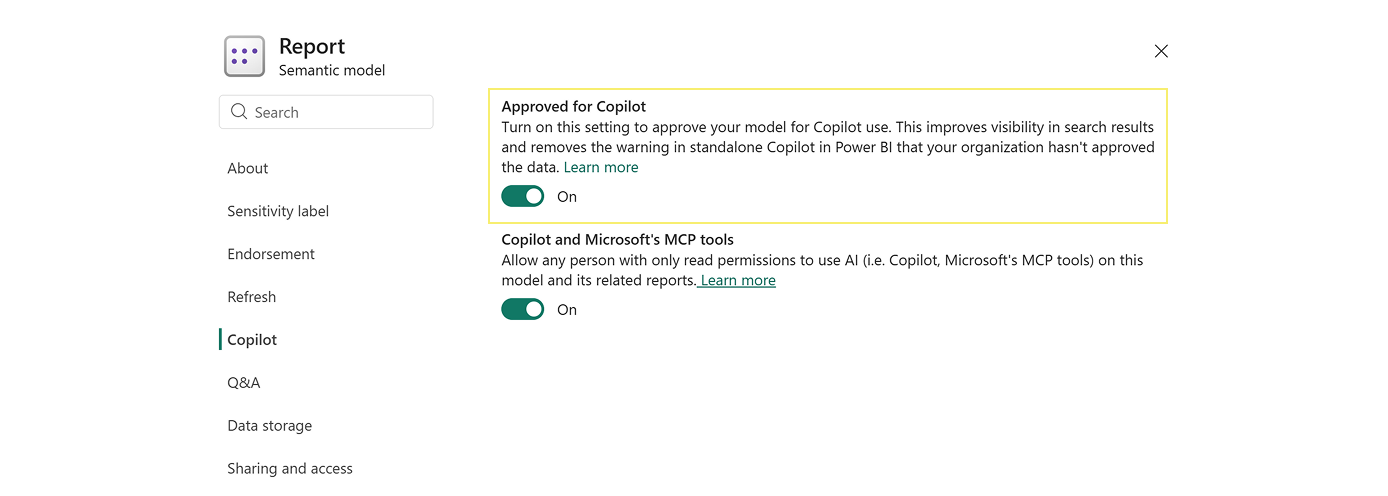
- Publish, then turn on the Approved for Copilot toggle in the model's settings in the service.
To find it, open the semantic model's settings in the service, go to the Copilot tab and look for Approved for Copilot (it used to be called prepped for AI). Turning the toggle on removes the warning in standalone Copilot that your organization hasn't approved the data, and the model shows up better in search results. The reports on that model count as approved too. It usually takes effect within an hour, but with many reports attached it can take up to 24 hours. You can only approve a semantic model, not a report, dashboard or app.
When an answer looks wrong, open How Copilot arrived at this under the answer to see what Copilot used. For anything deeper, Download diagnostics in the ... menu of the Copilot. You get a file you can attach to a support ticket.
Conclusion
Prep data for AI is the closest thing Power BI has to Copilot settings you actually control. It doesn't fix the fundamental problems but it fixes the three places Copilot most often goes wrong: it picks the wrong field, it misreads your business terms, and it answers the same question differently.
If you only have an afternoon, do a short version of the order above. Untick the obvious noise in the schema. Then build verified answers for the ten questions your users ask most, and check that every field they use is still ticked.
Two things before you roll it out widely. It’s still in preview, and the Q&A switch it depends on is going away in February 2027, so expect the setup to change. And none of it is a guarantee. For the first few weeks, keep checking “How Copilot arrived at this” to see what Copilot actually used.
The test I use is simple: ask your CFO’s questions three different ways. If you get the same chart all three times, you’re done. If you don’t, go back to the model.
Hope you find it useful! :)
Does your organization need support?
Get in touch!
Get in touch!

COMPANY
Write your awesome label here.
Embedding Power BI in Power Point
Intro Session