WINDOW Function in ACTION for better Visual Calculations

The WINDOW function is an addition to Power BI’s visual calculations family, and it brings SQL-like windowing power directly into your report visuals.
Jan 20 / datatraining
In this article, you'll learn how to use the WINDOW function to:

  • Create moving averages that update based on filters and parameters
  • Dynamically calculate reference lines per year or category
  • Leverage ORDERBY and PARTITIONBY to control row contexts
  • Avoid common mistakes when building visual-level DAX

Let’s walk through every step.

What is the WINDOW Function?


The WINDOW function defines a relative or absolute range of rows (a "window") in your visual and lets you apply expressions over that window.
You define:
  • FROM and TO points (relative or absolute indices)
  • ORDERBY to define row order
  • PARTITIONBY to break data into groups (e.g., per year)

Once you have your window, you use an iterator like AVERAGEX to calculate over it.
Example 1: Moving Average over 3 Months

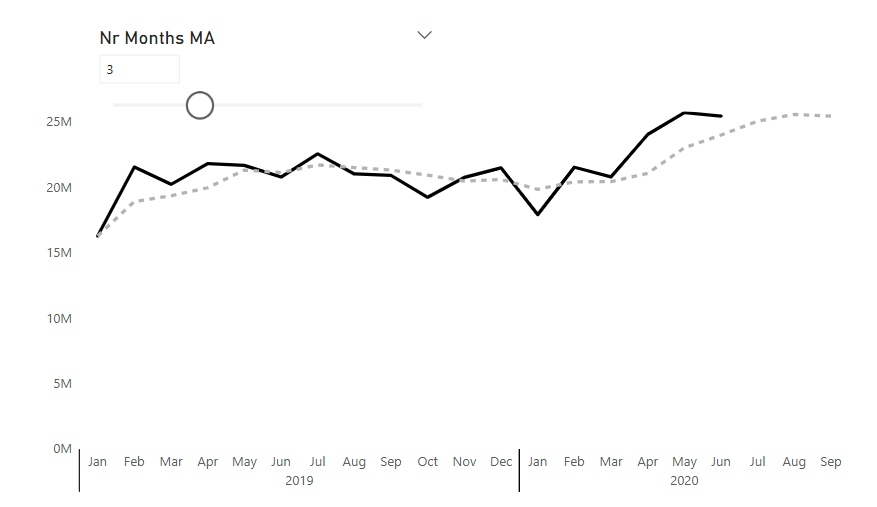
In this scenario, we want to show a rolling average of total sales over the last 3 months, using only visual-level logic visualized as a line chart.

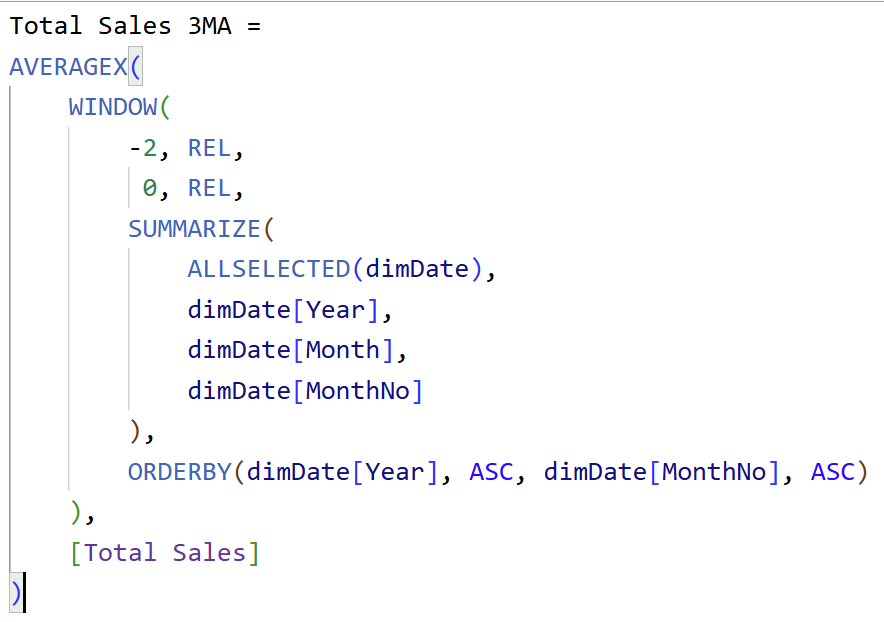
Step-by-step DAX:
Explanation:

  • -2 to 0 means: go 2 months back and include the current month.
  • ALLSELECTED ensures we work across the filtered visual context.
  • SUMMARIZE creates the row-level table.
  • ORDERBY ensures the rows are chronologically sorted.

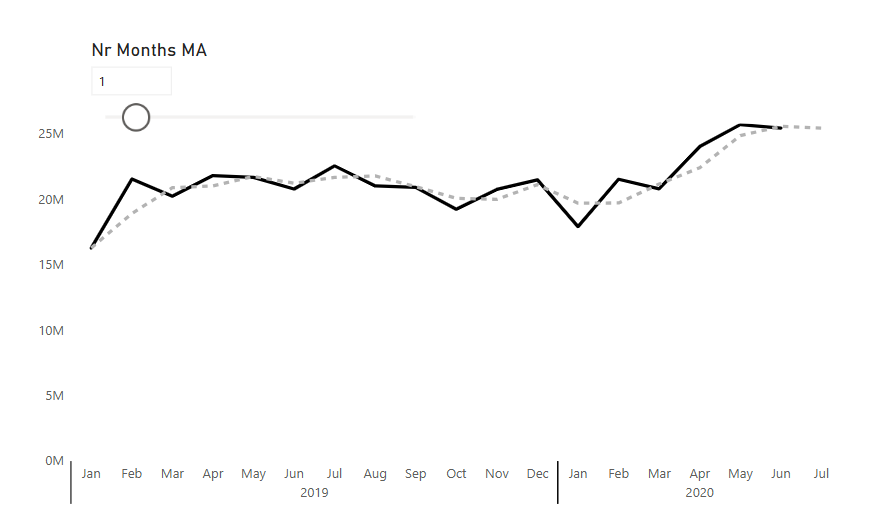
Result:
You get a smoother sales trend, which adjusts dynamically to slicers or filters.

Example 2: Make It Dynamic with Parameters
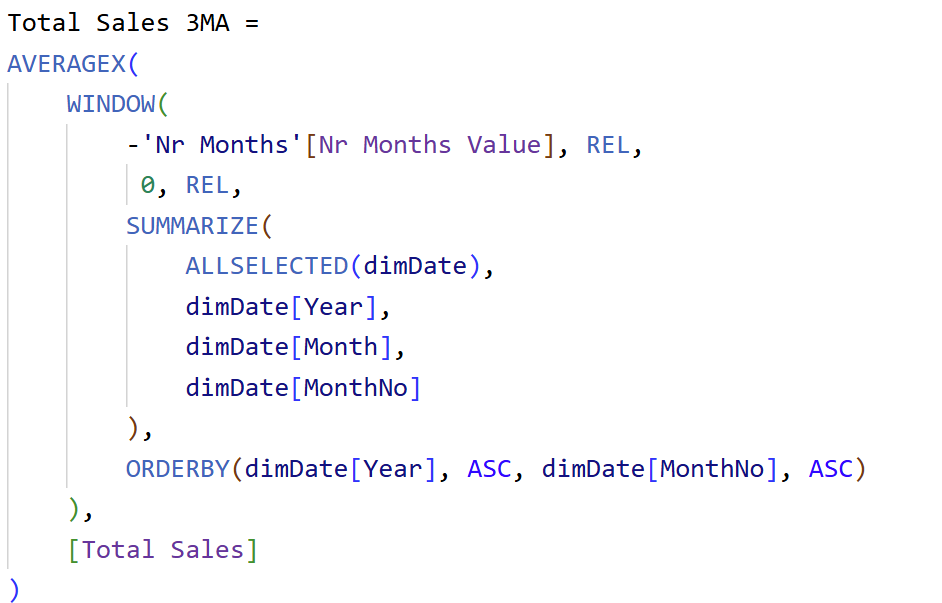
Instead of hardcoding "-2", we can create a slicer that lets users choose how many months to include in the rolling window.

Steps:

  1. Create a numeric parameter: “Number of Months”
  2. Replace -2 with -[Number of Months Value] in your measure
Troubleshooting: When the Measure Returns Unexpected Results

Sometimes your measure might return strange outputs - like repeating the same values across rows or showing blanks where it shouldn’t.

Common issues:


  • Using Month instead of Month Number in ORDERBY (months won’t sort correctly).
  • Forgetting to remove existing filters from the visual.
  • Incorrect summarization inside WINDOW.
Example 3: Yearly Reference Line

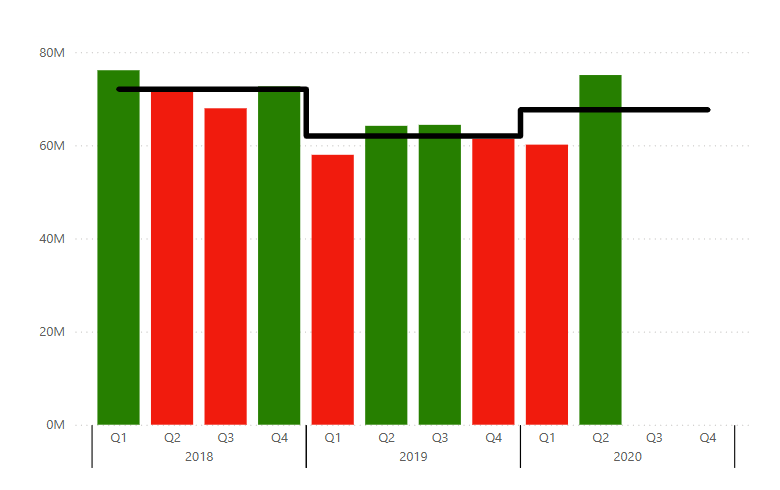
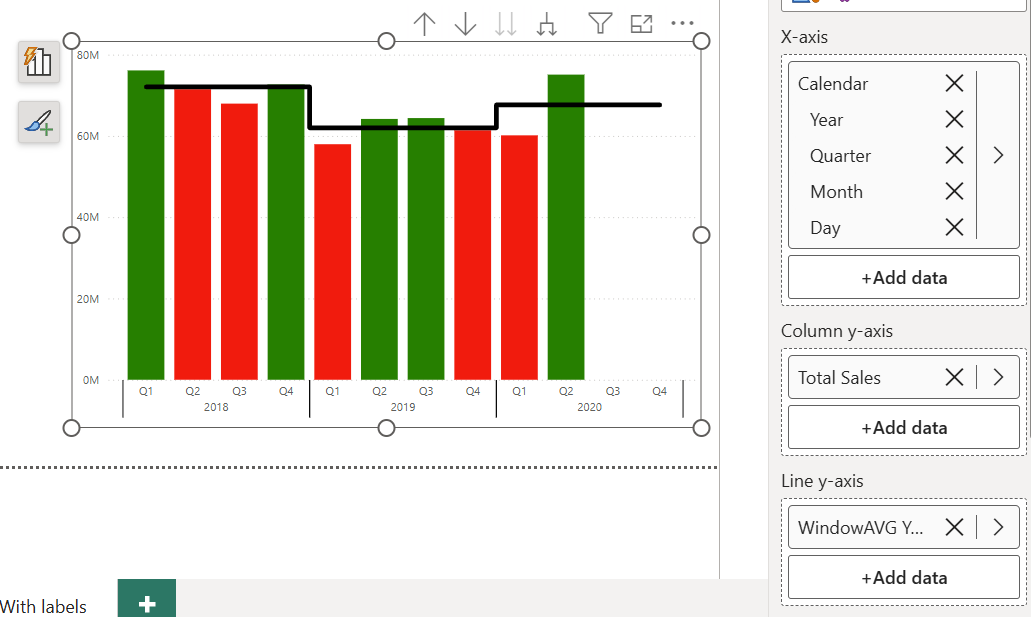
Let’s say you want to add a reference line to a combo chart, specific to each year.

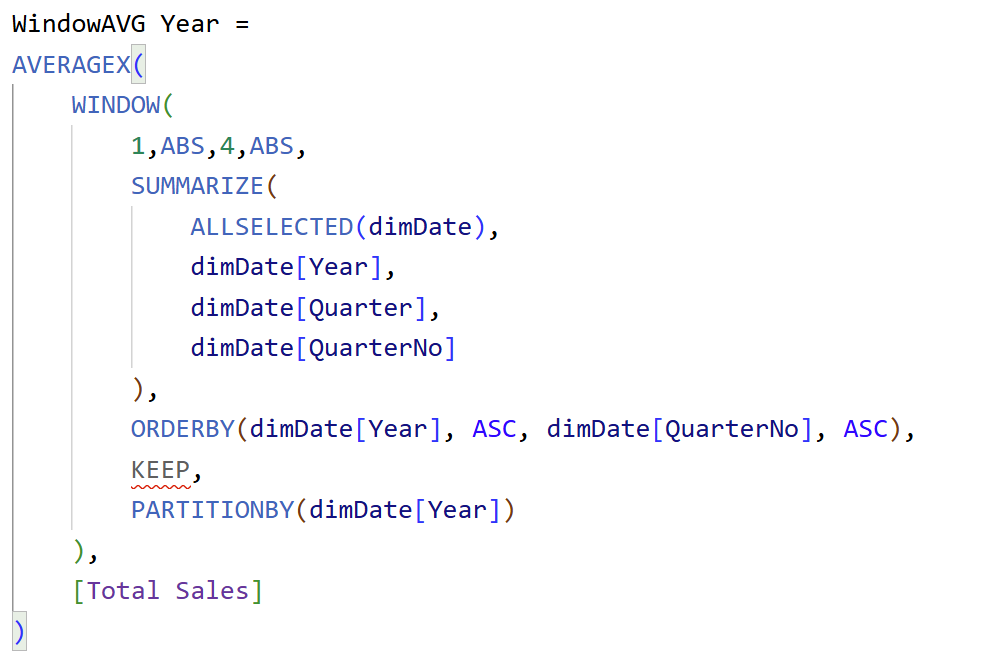
Instead of calculating the average globally, you want one per partition (year). You also need to define a window with a fixed number of rows (e.g., four quarters per year).
Explanation:

  • ABSOLUTE indices define fixed windows (e.g., 4 quarters).
  • PARTITIONBY('Dim Date'[Year]) ensures averages are calculated per year group.

Adding Color Logic

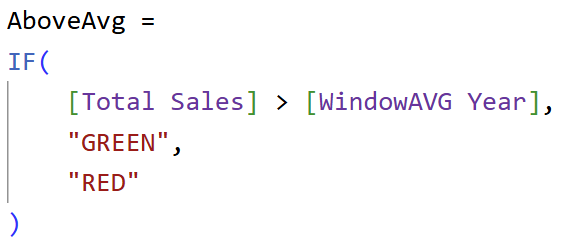
To make visuals more insightful, you can color bars differently depending on whether they’re above or below the reference line.
Apply this measure to bar color via conditional formatting.
Key Takeaways

Element

Purpose

WINDOW

Defines range of rows to perform calculation

RELATIVE

Moves window based on current row’s index

ABSOLUTE

Fixed positions within a partition

ORDERBY

Defines row order in the window

PARTITIONBY

Breaks data into groups like Year or Category

SUMMARIZE

Builds the row context table inside the visual


Hope you like it!

Give it a try and see how it works for you! I’d love to hear what you think or see how you use this trick in your own reports.

How to Power BI

Watch it here

Launch Power BI Reports
that bring your organization
to a fully 
data-driven world.

Power BI Launch

After years of consulting we have developed a holistic solution for launching Power BI Reports in 3 months. From key metrics discovery, to report design, implementation and stakeholders' training. We know precisely how to launch Power BI reports that drive organizations' growth.

Power BI Trainings

Our technical trainings for report developers instantly upskill your teams. Alongside our unique business user trainings the improvement in overall organizational data literacy becomes immediately actionable.

Take your Skills to the Next Level

Power BI Trainings

__________