Visual Calculations in Power BI

Writing DAX has always been a challenge for many Power BI users. But what if you could skip the code and still perform powerful calculations directly within visuals? Welcome to Visual Level Calculations – a game-changing feature in Power BI (from February 2024 version onwards), that allows you to create calculations inside your visual, without writing traditional DAX measures.
Feb 24 / datatraining
I will show you step by step how it is done.
Let's dive in.

Step 1: Enable the Feature


  • Ensure you’re on Power BI Desktop February 2024 or later.
  • Go to File > Options > Preview Features and enable Visual Calculations.

Step 2: Start with a Matrix Visual


  • Add a Matrix to your canvas (e.g. Sales by Quarter and Year).
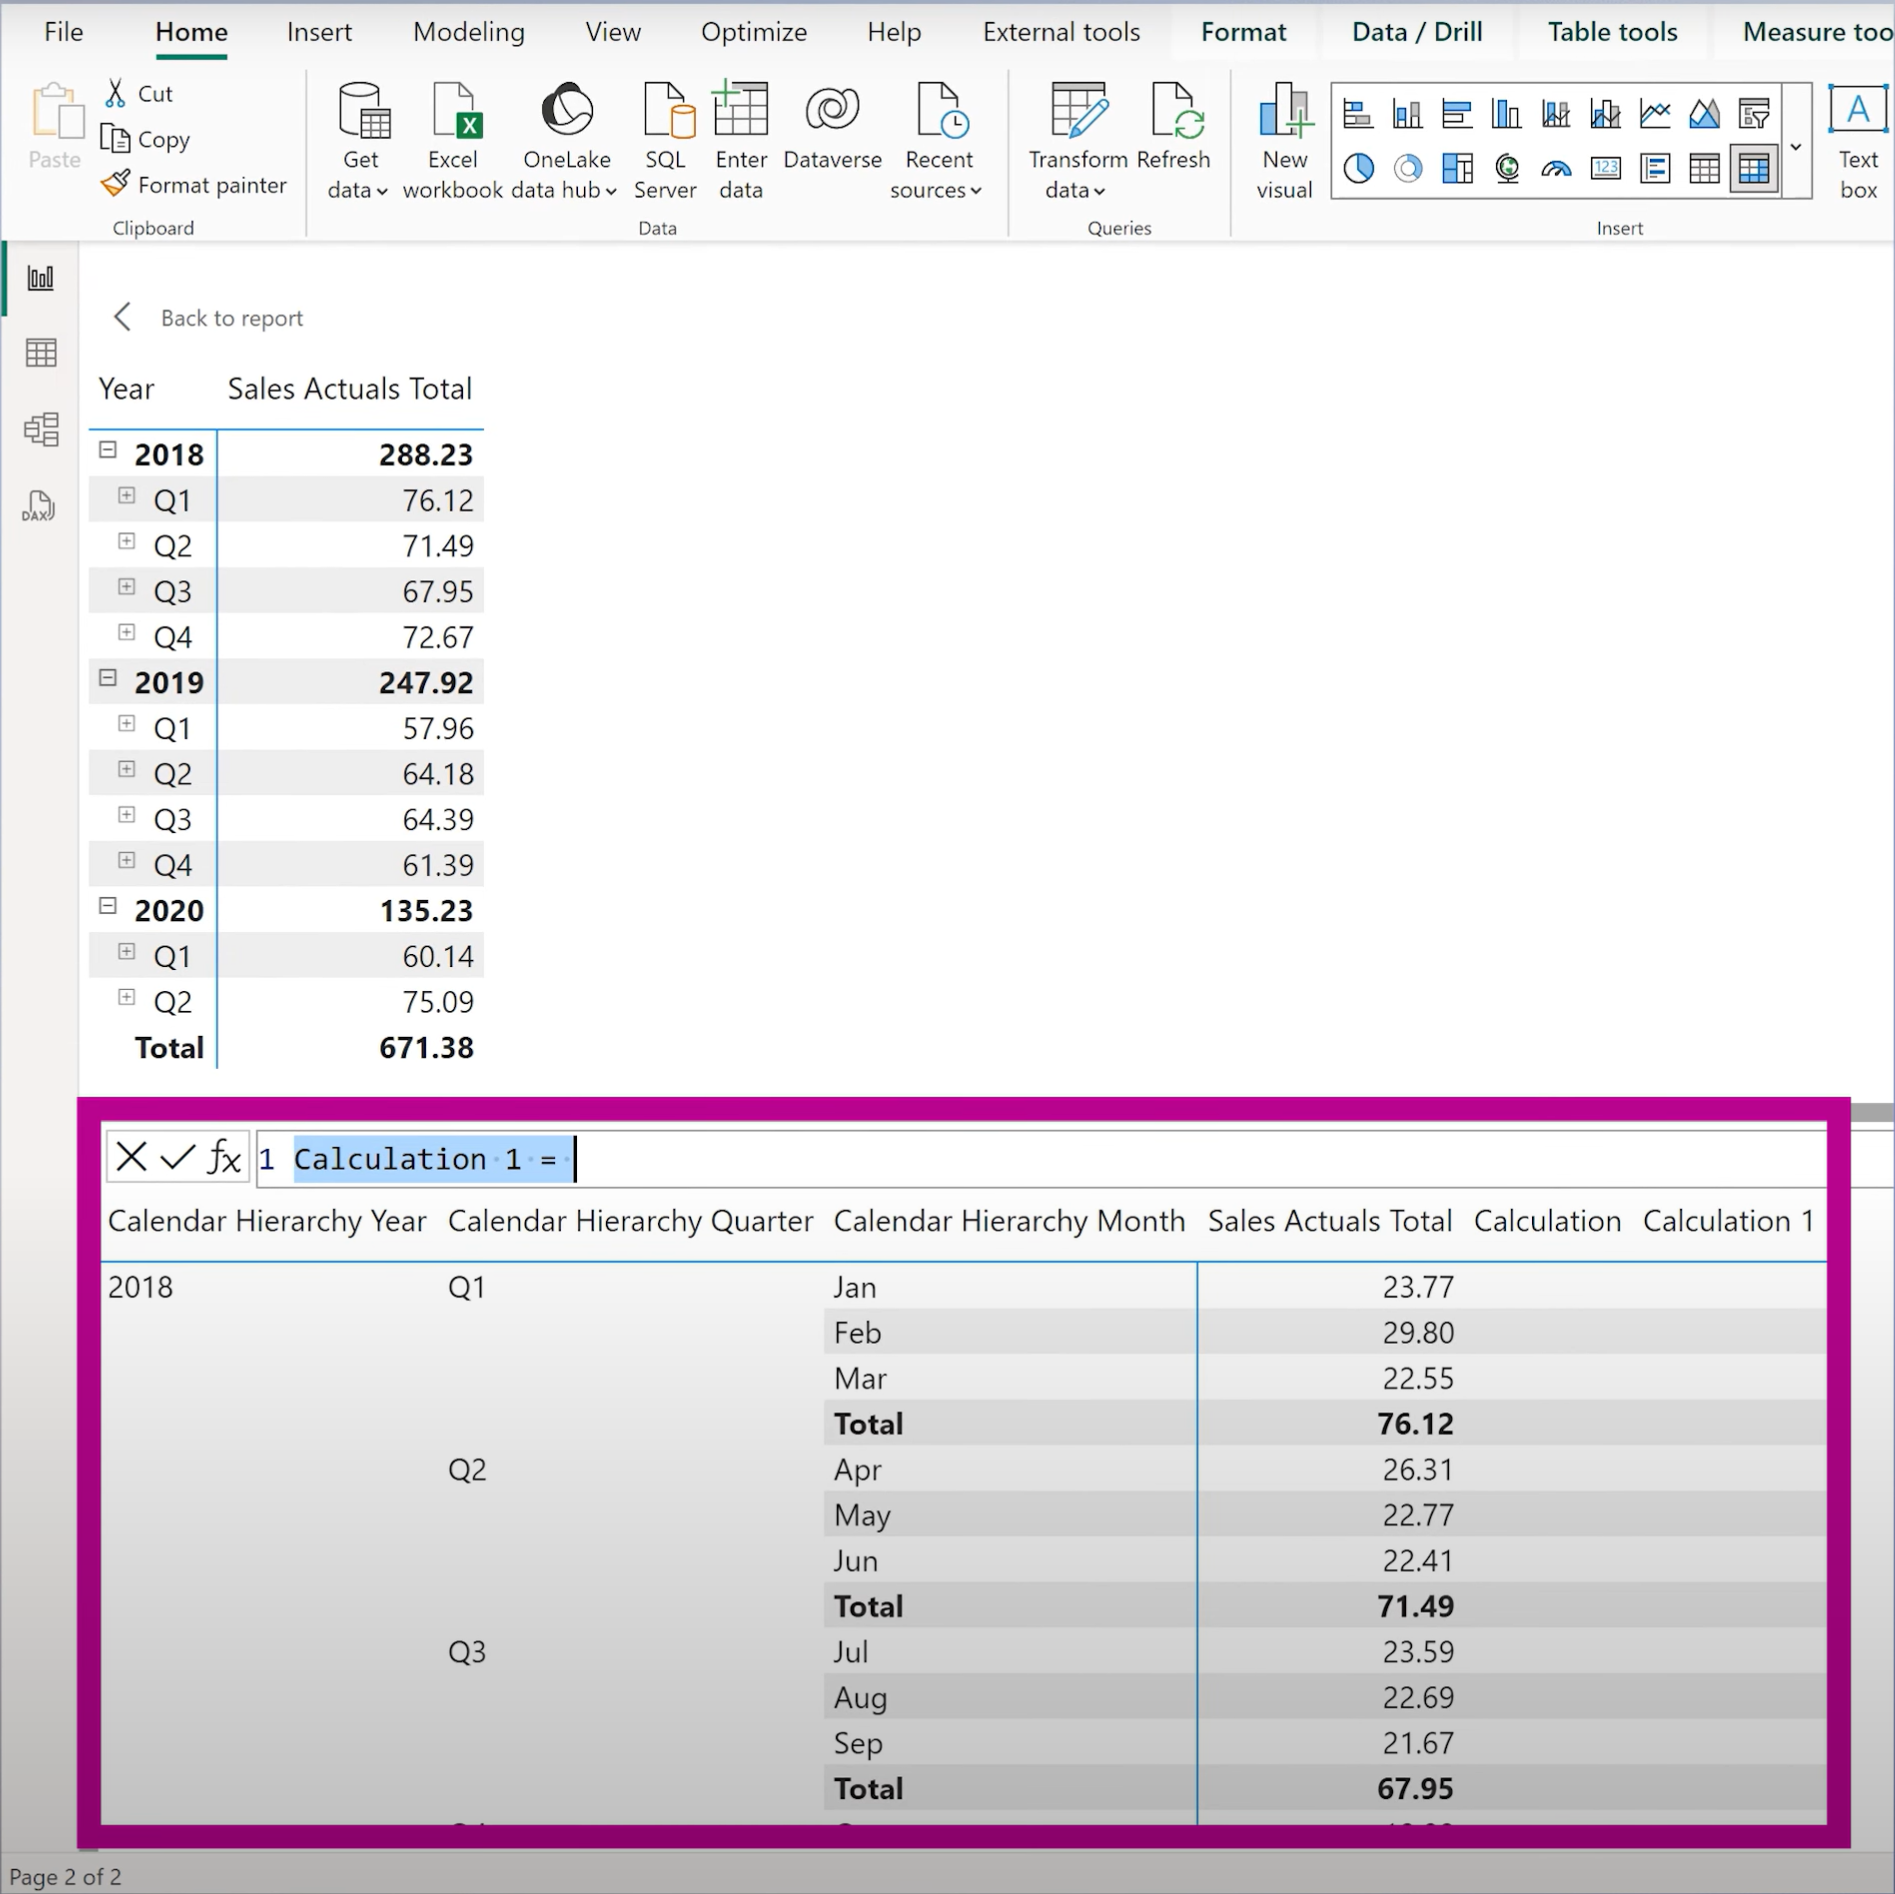
  • Go to Home > New Calculation.
  • A new formula bar opens at the bottom – this is your Visual Calculation Editor.
Step 3: Explore Built-in Calculation Templates

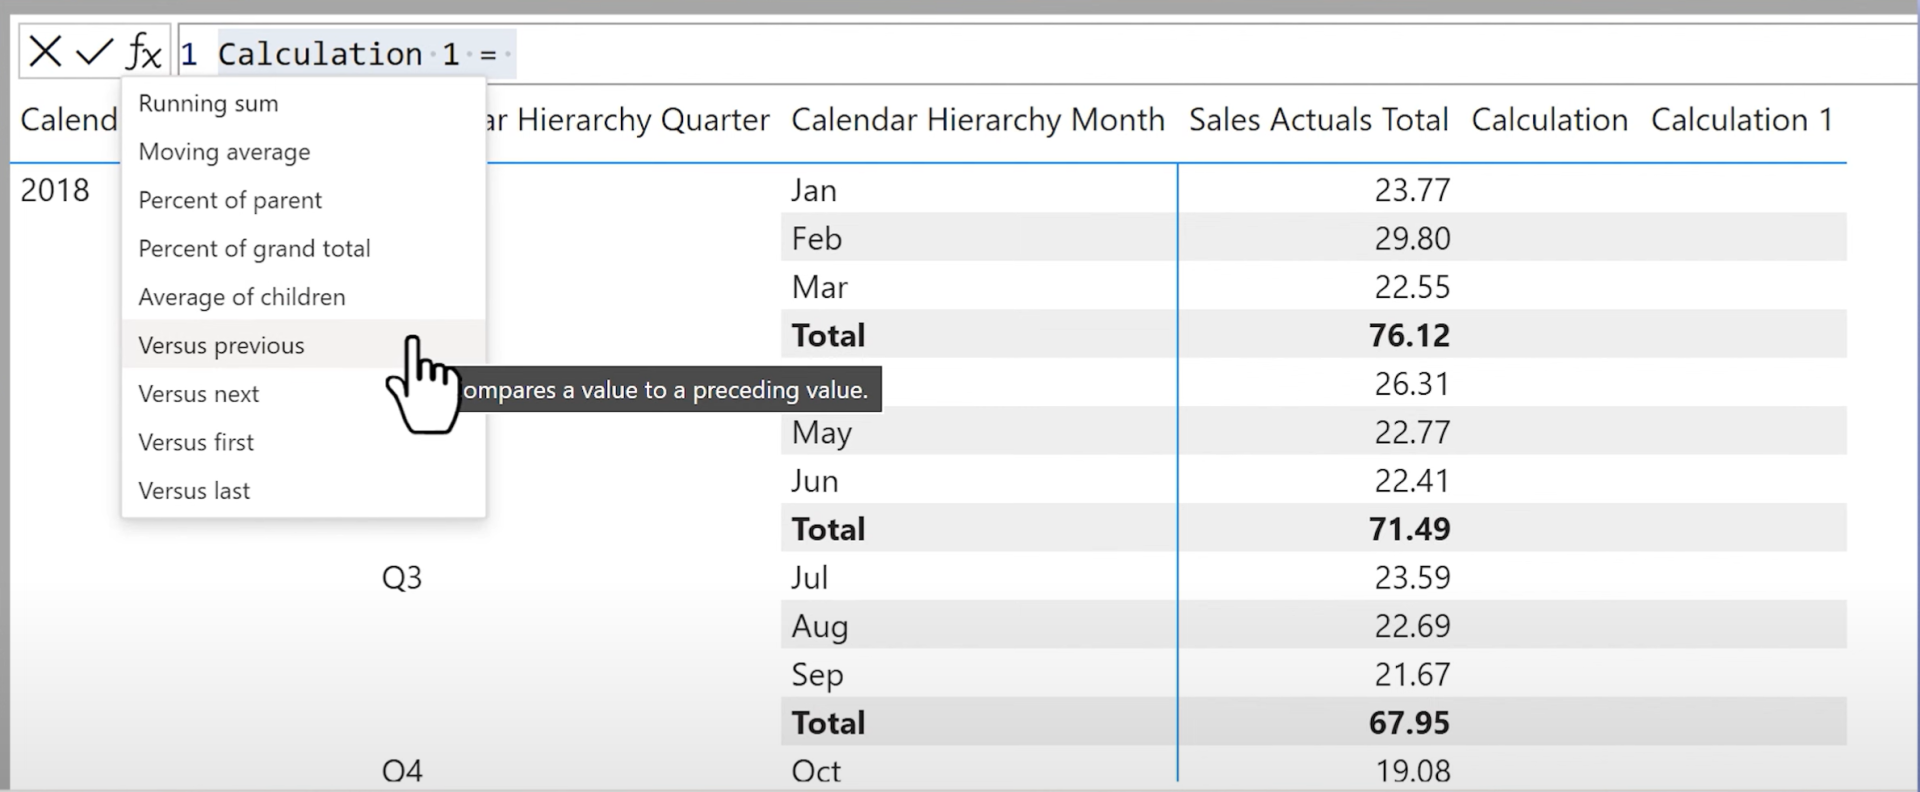
Click the fx button and choose from four groups of pre-built templates:

a. Running Calculations
• Running Sum

b. Rolling/Moving Calculations
• Moving Average (e.g. 3-period)

c. Comparisons
• Versus Previous, Next, First, Last

d. Hierarchy-Based
• % of Parent
• % of Grand Total
• Average of Children
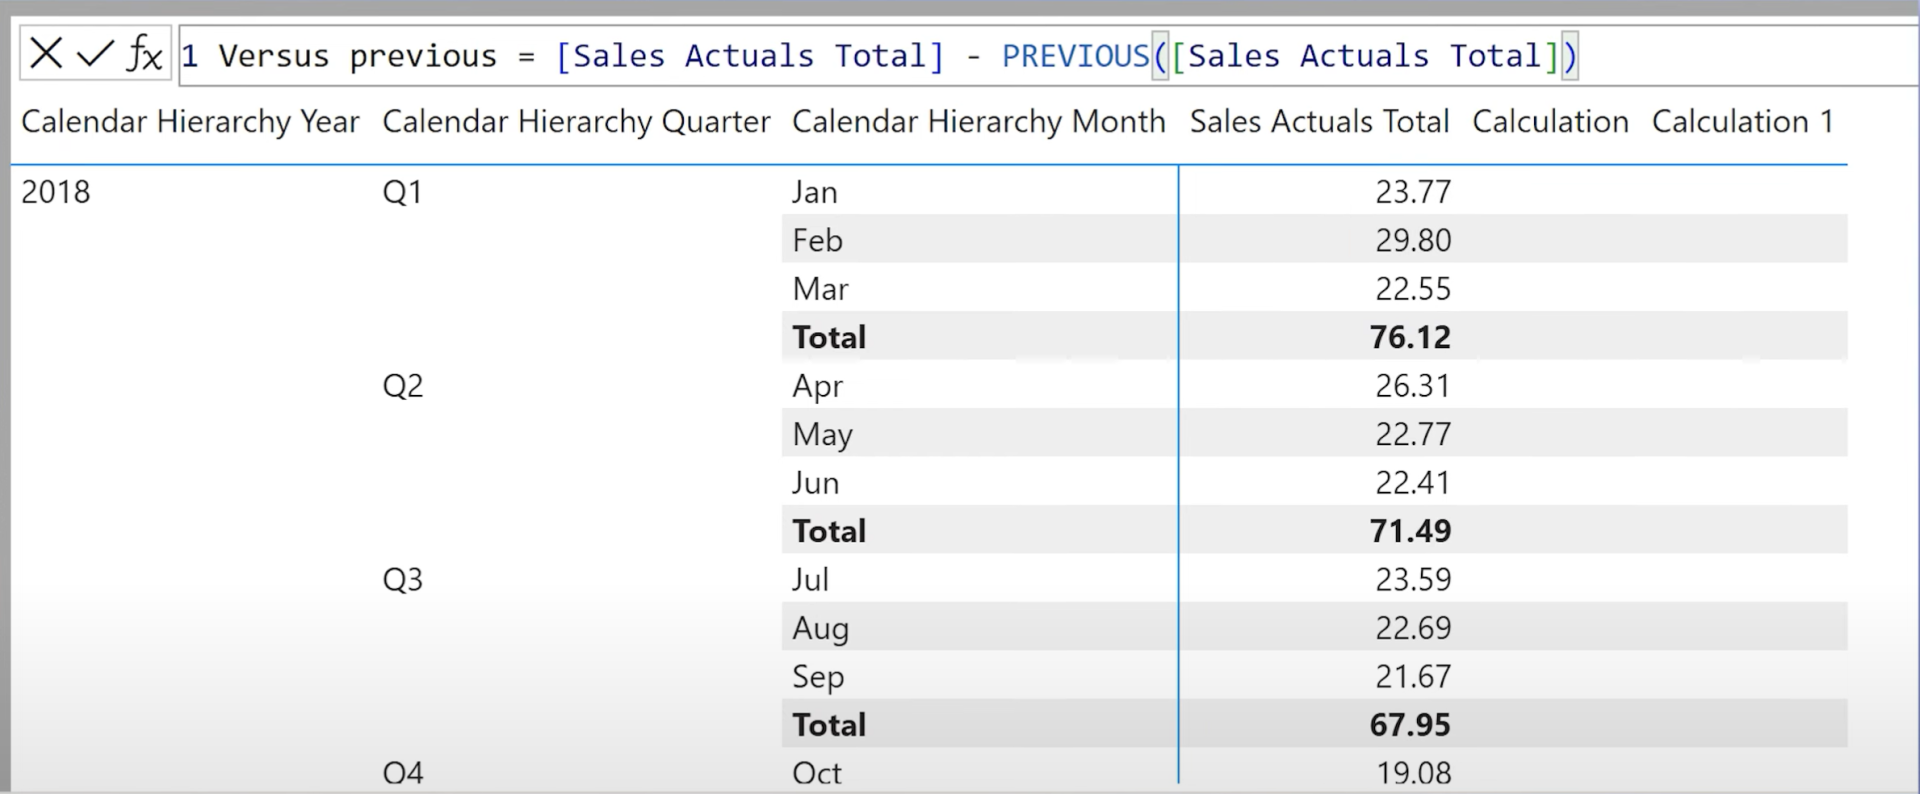
Step 4: Create a "Versus Previous" Calculation

Example:
Sales Change = Sales Actual - Previous(Sales Actual)
This compares the current period with the previous one (e.g. Q2 vs Q1).
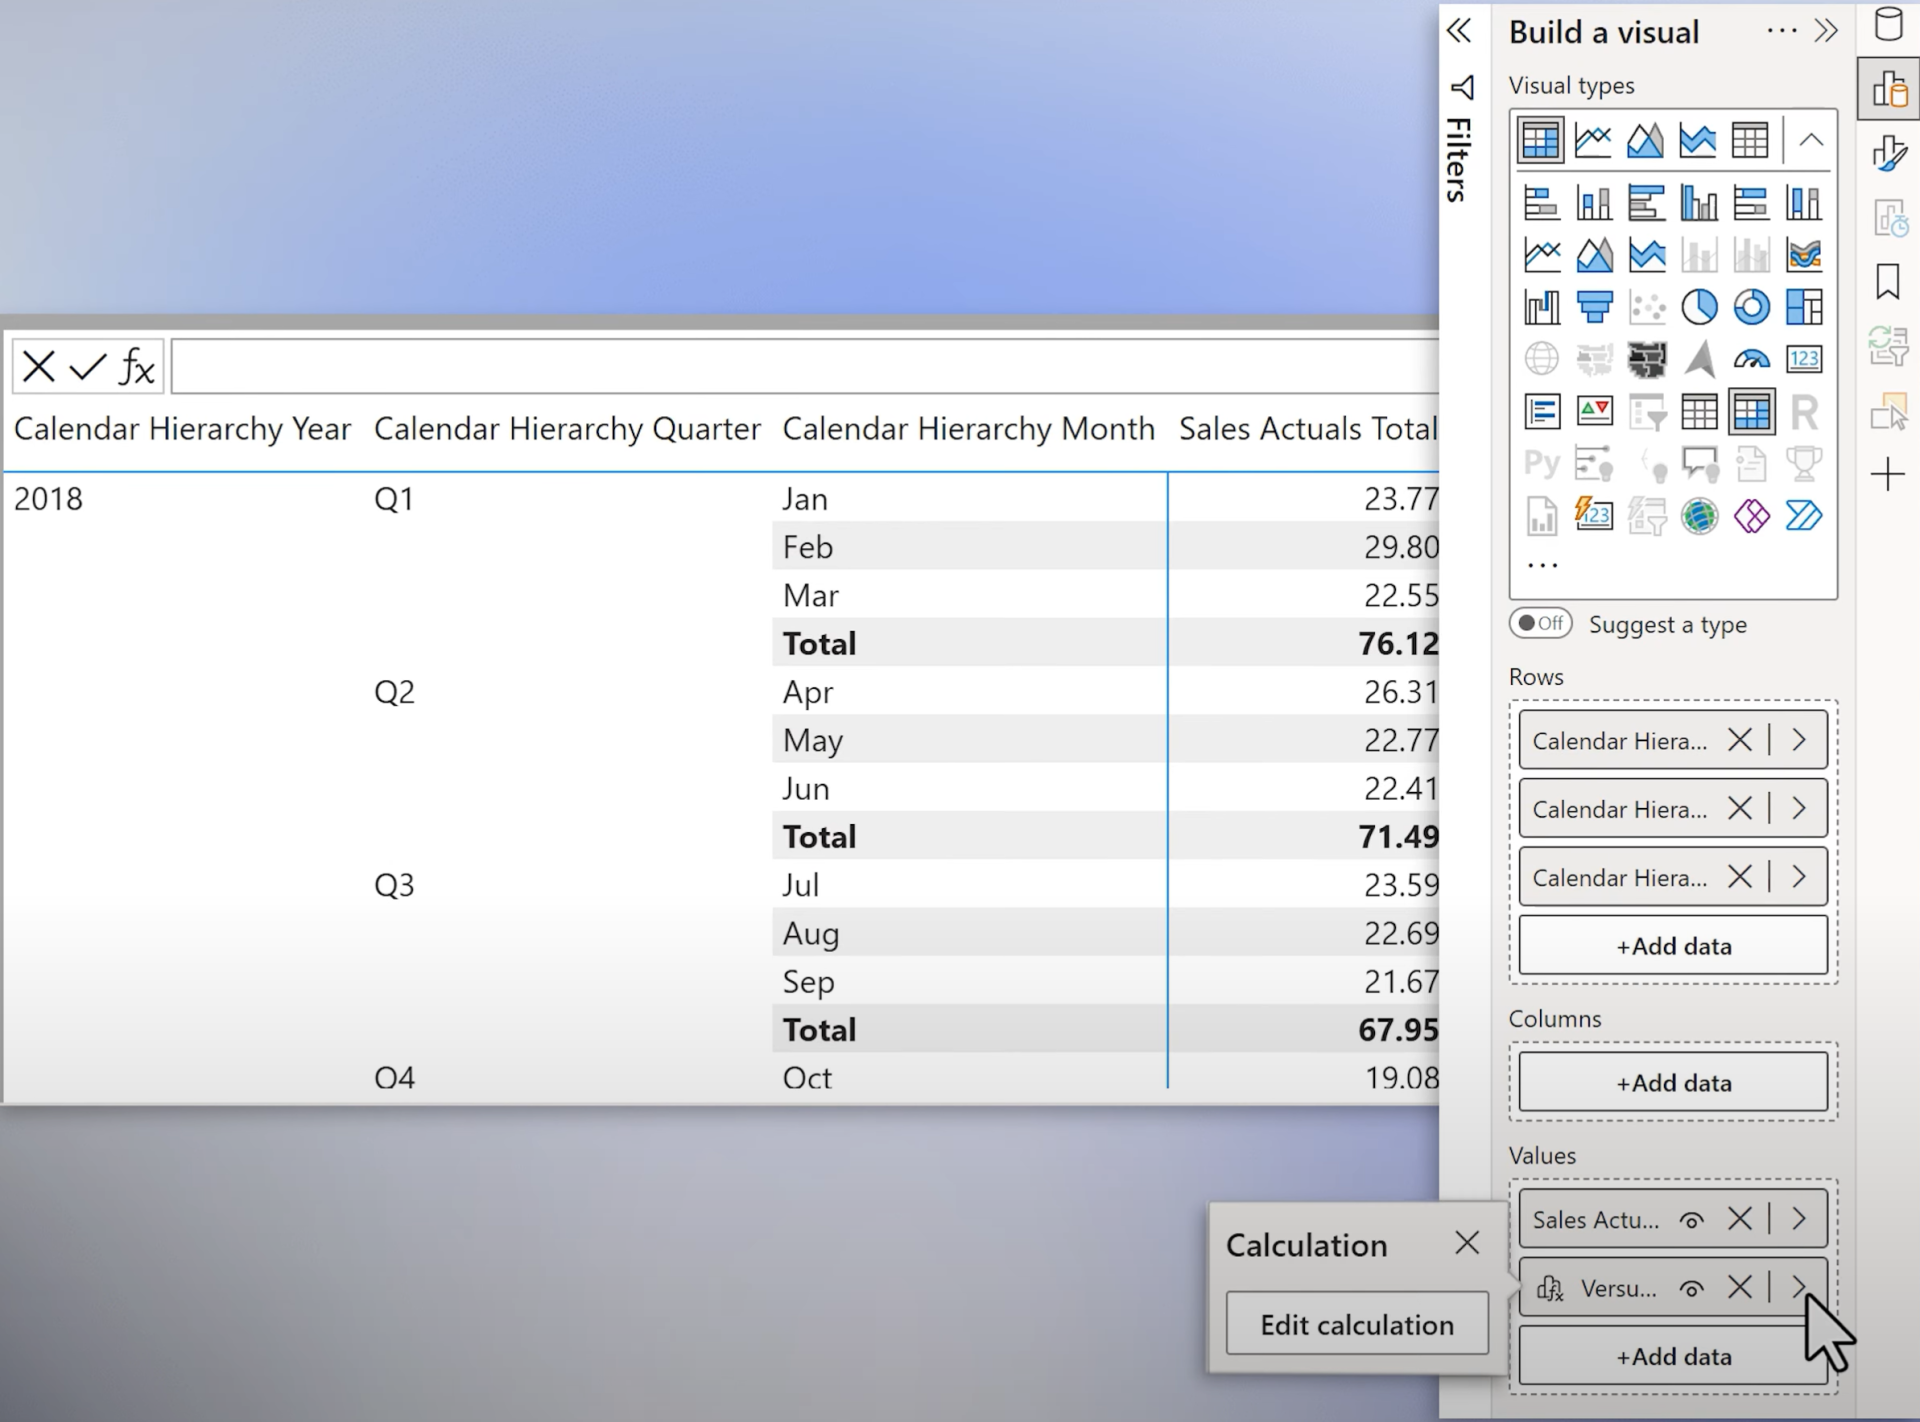
You can adjust the calculation by clicking on edit calculation:
Step 5: Handle Missing Data and Formatting

Wrap calculations in IF to avoid blank or zero baselines:
For formatting, use:
FORMAT([YourCalc], "#,0,,.00M")
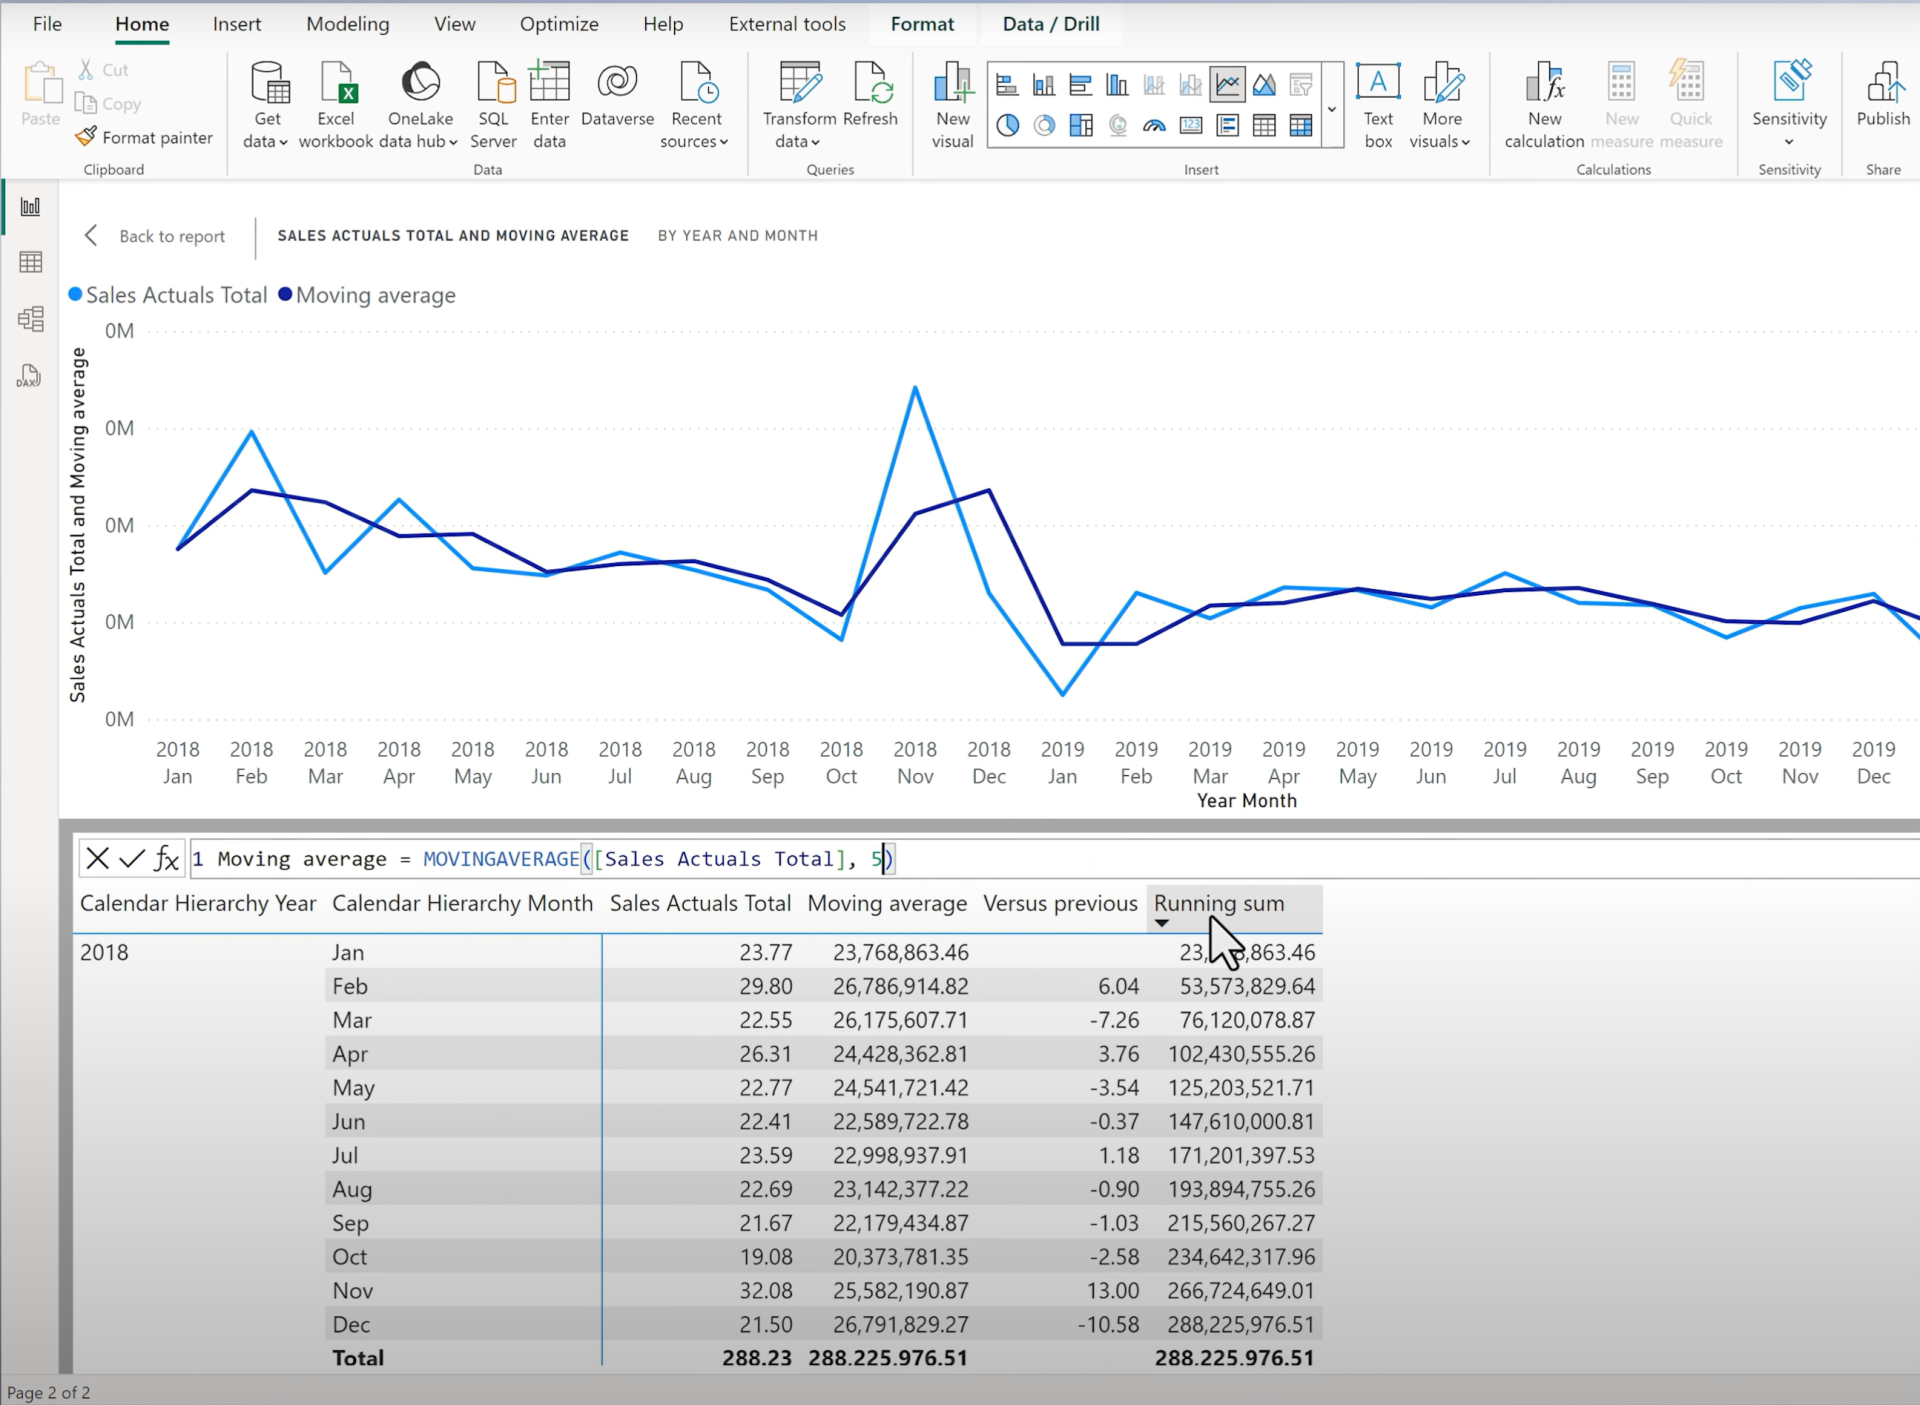
Step 6: Add a Moving Average

Use the Moving Average template:
MovingAvg = MovingAverage(Sales Actual Total, 5)
Step 7: Limitations (for now)

  • Only Moving Average is supported – no MovingSum, MovingMin, MovingMax.
  • Cannot use numeric parameters or field parameters dynamically.
  • Formatting must be manually defined (no auto-inheritance).
  • Visual calculations cannot be reused in other visuals.
  • Combo charts, maps, and some visuals are not supported (yet).
  • Cannot use for Conditional Formatting or Reference Lines (yet).

Step 8: Good News: Works with Custom Visuals and Calculation Groups


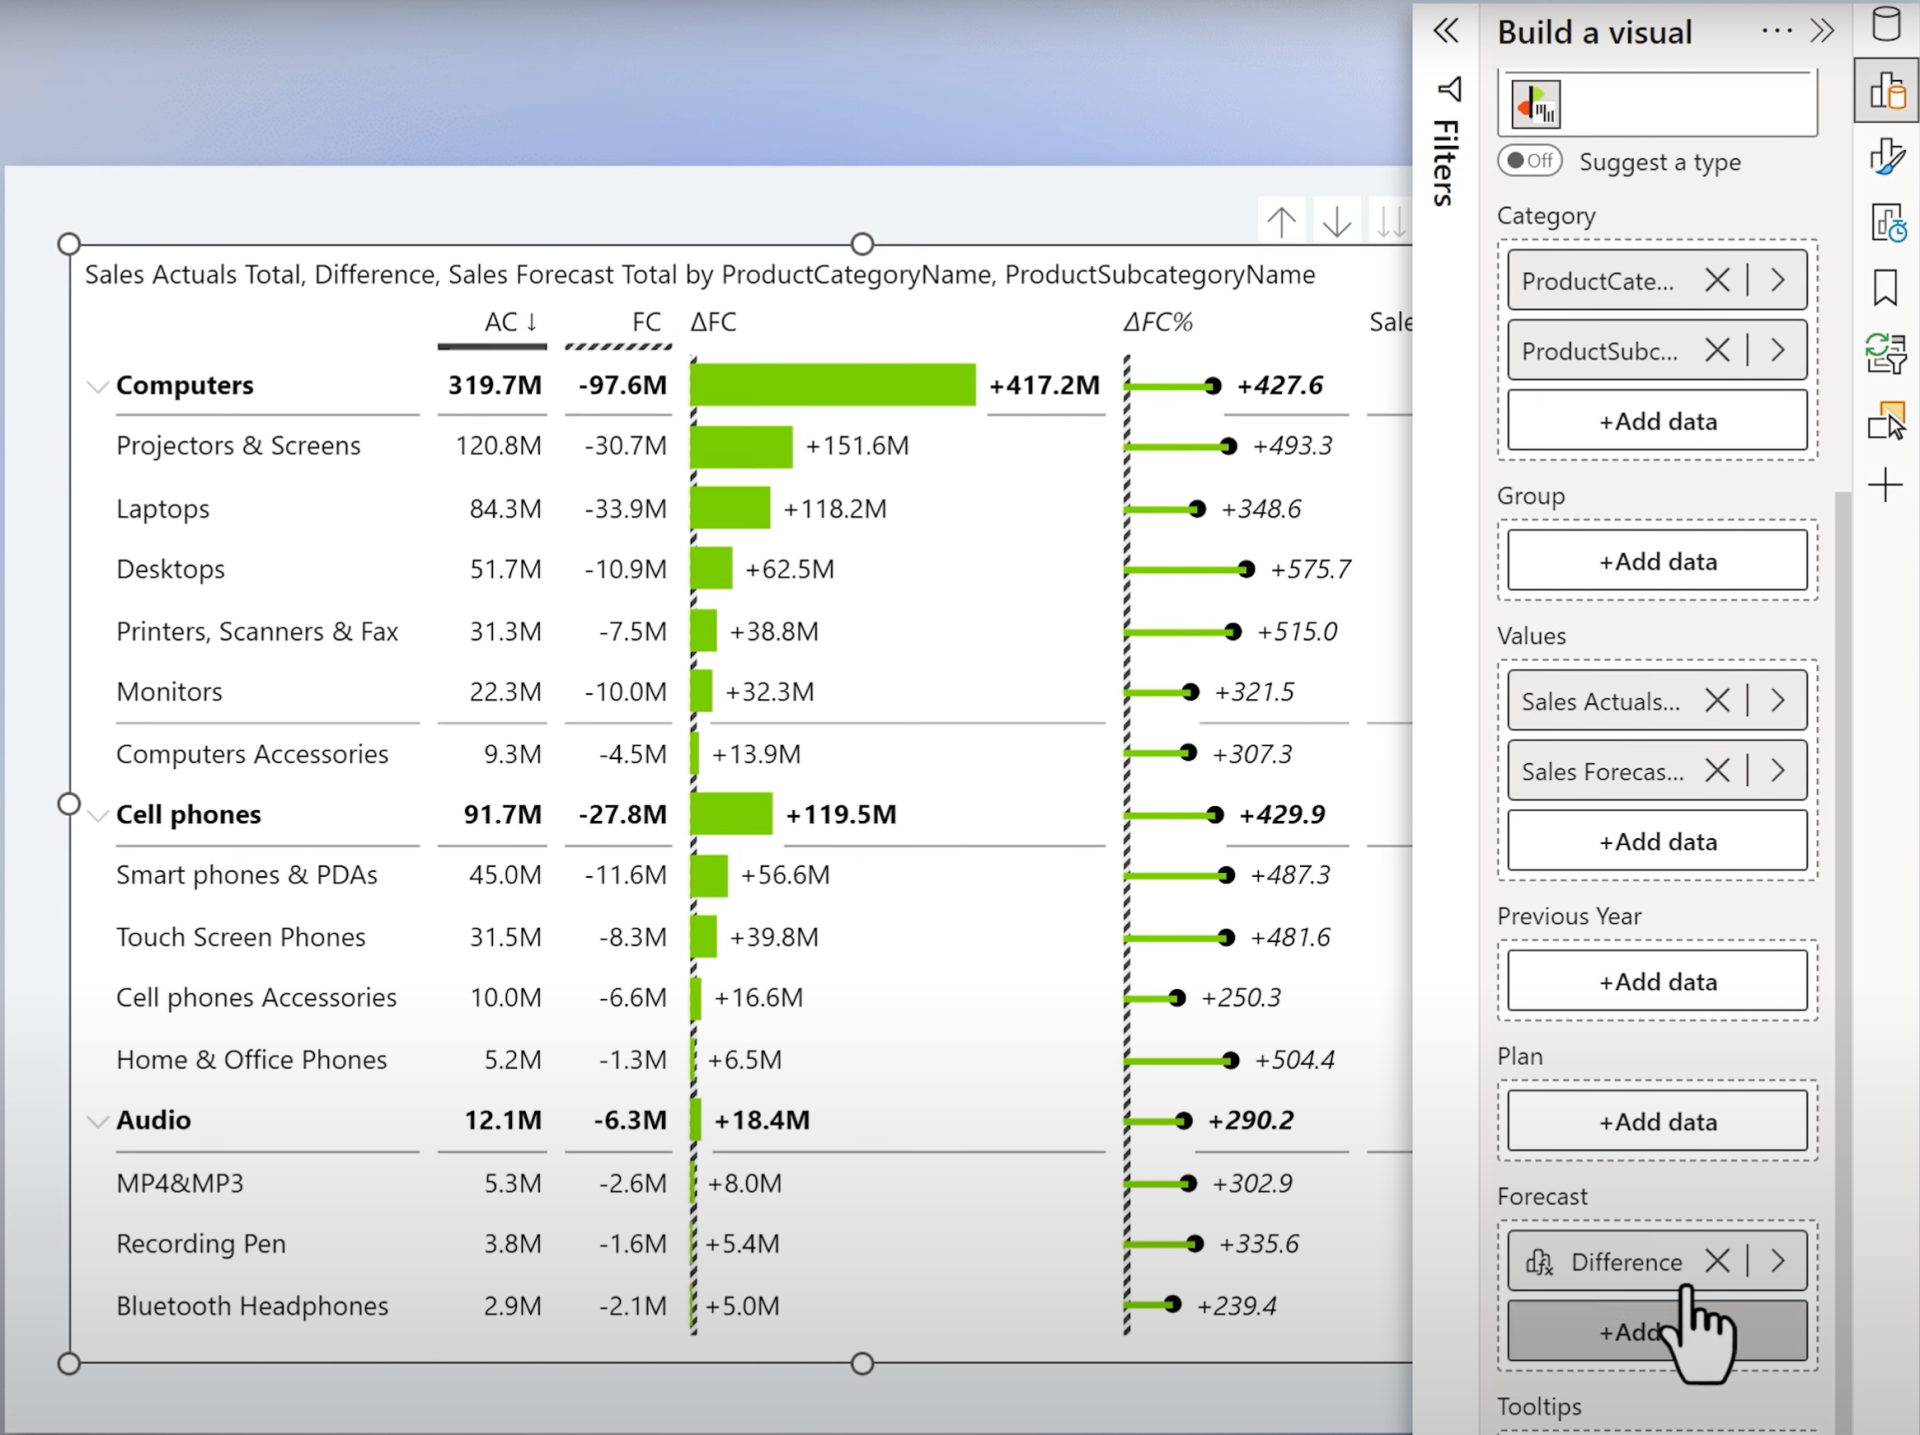
You can use visual calculations in custom visuals (e.g. Zebra BI Matrix).
You can also use them alongside Calculation Groups for dynamic switching between YTD, QTD, etc.
You can also use Visual calculations in Import mode and DirectQuery mode.

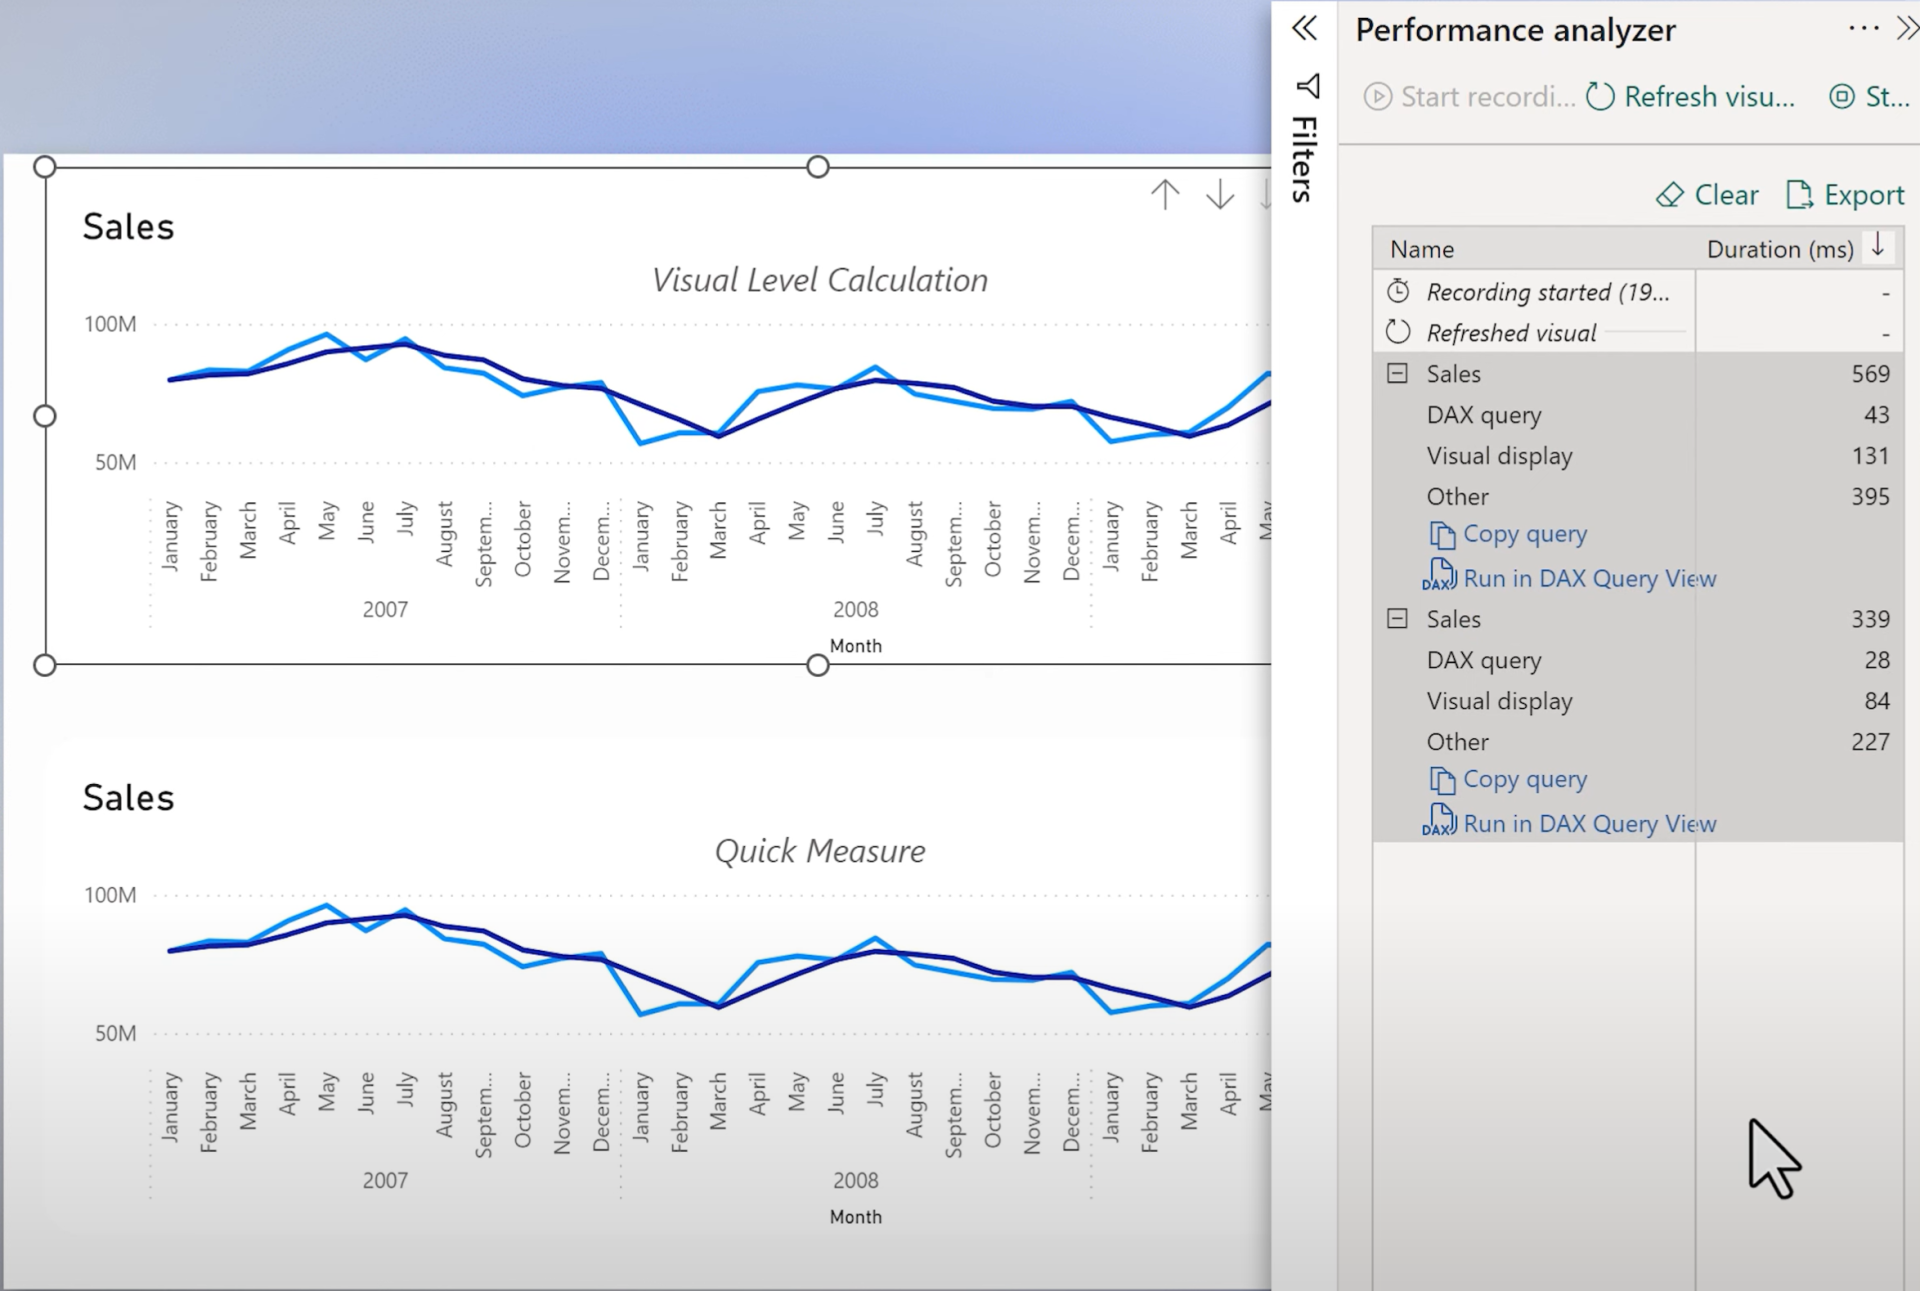
Step 9: Performance Comparison

Visual Calculation ~ DAX Query Time 43ms
Regular Measure (Quick Measure) ~ DAX Query Time 28ms

Difference is minor in simple reports – visual calculations are worth the tradeoff for ease of use.
Final Thoughts

Visual Level Calculations are:
  • Intuitive and no-code friendly
  • Ideal for beginner and intermediate Power BI users
  • Aimed to reduce the DAX learning curve

Though still in preview with a few limitations, they are a promising addition to the Power BI arsenal.

Hope you like it!

Give it a try and see how it works for you! I’d love to hear what you think or see how you use this trick in your own reports.

How to Power BI

Watch it here

Launch Power BI Reports
that bring your organization
to a fully 
data-driven world.

Power BI Launch

After years of consulting we have developed a holistic solution for launching Power BI Reports in 3 months. From key metrics discovery, to report design, implementation and stakeholders' training. We know precisely how to launch Power BI reports that drive organizations' growth.

Power BI Trainings

Our technical trainings for report developers instantly upskill your teams. Alongside our unique business user trainings the improvement in overall organizational data literacy becomes immediately actionable.

Take your Skills to the Next Level

Power BI Trainings

__________