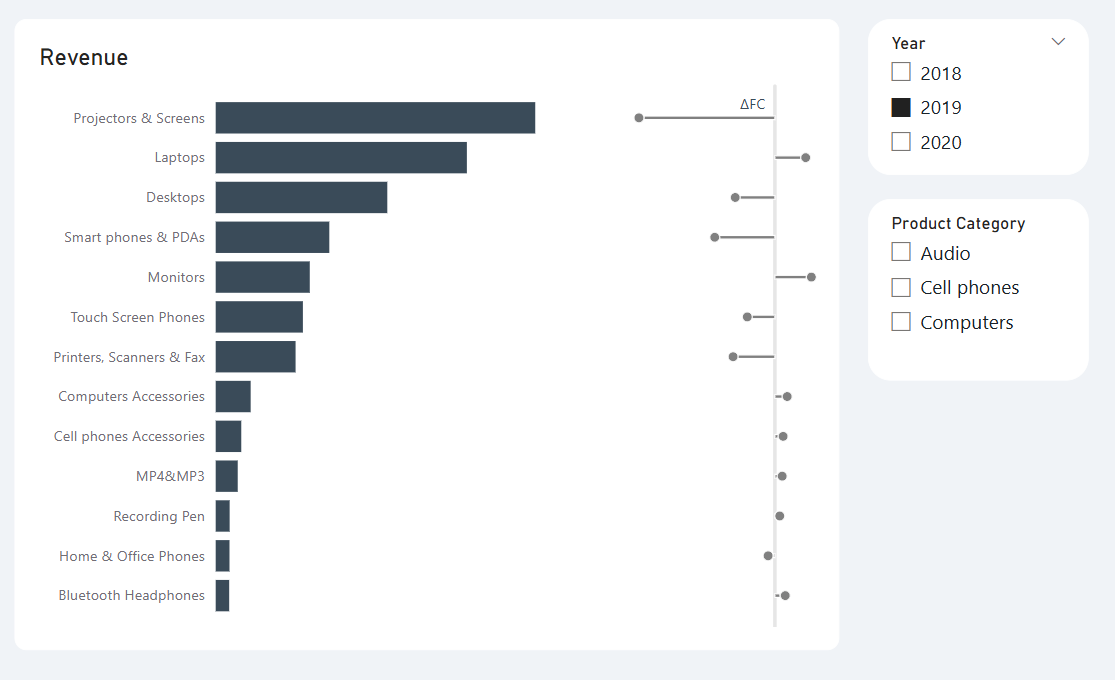
Chart 1: Variance Chart Using Error Bars
Step 1: Build the Foundation
- Create a standard bar chart with actual and previous year sales by subcategory.
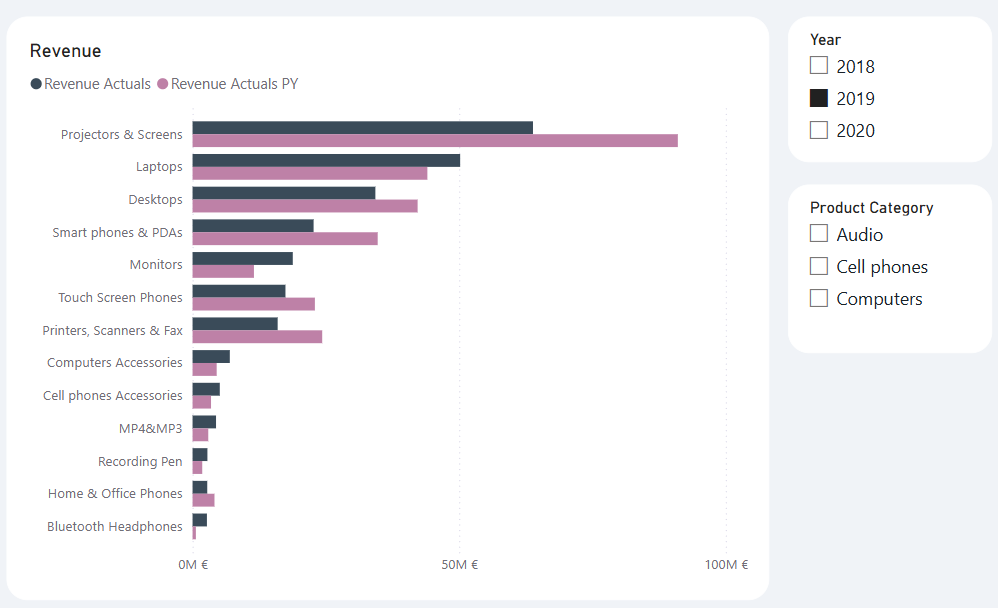
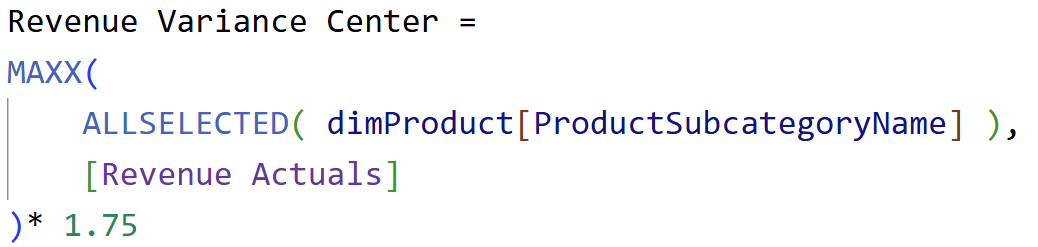
- Add a reference line to create space for variance bars. Use a dynamic measure (e.g. Revenue Variance Center) to define this space.
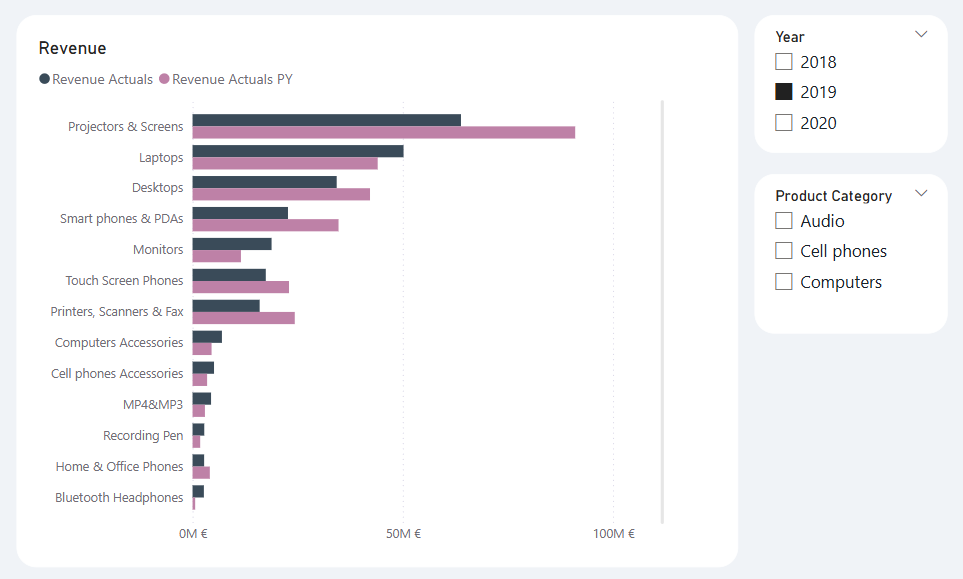
Step 2: Add Error Bars for Variance
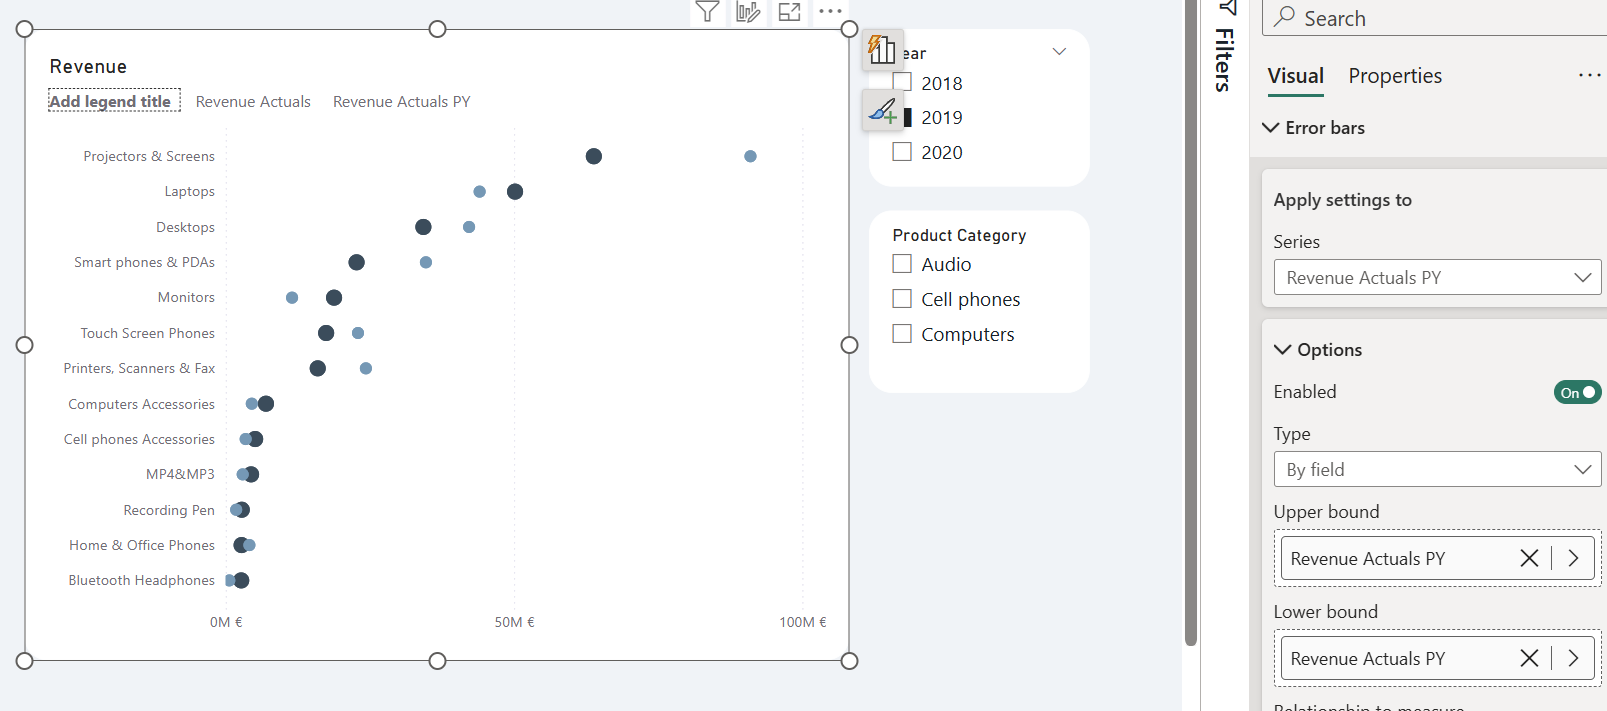
- Place the Revenue Variance Center measure on the X-axis.
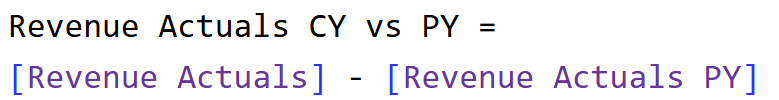
- Add error bars for this field. Use a measure like Revenue Actual CY vs PY for upper or lower bounds. Relationship to the measure is relative.
- Set bars to 100% transparent for Revenue Variance Center and Revenue Actuals PY, so only the error bars remain visible.
- Turn on the overlap option and set the space of the series to 100%.
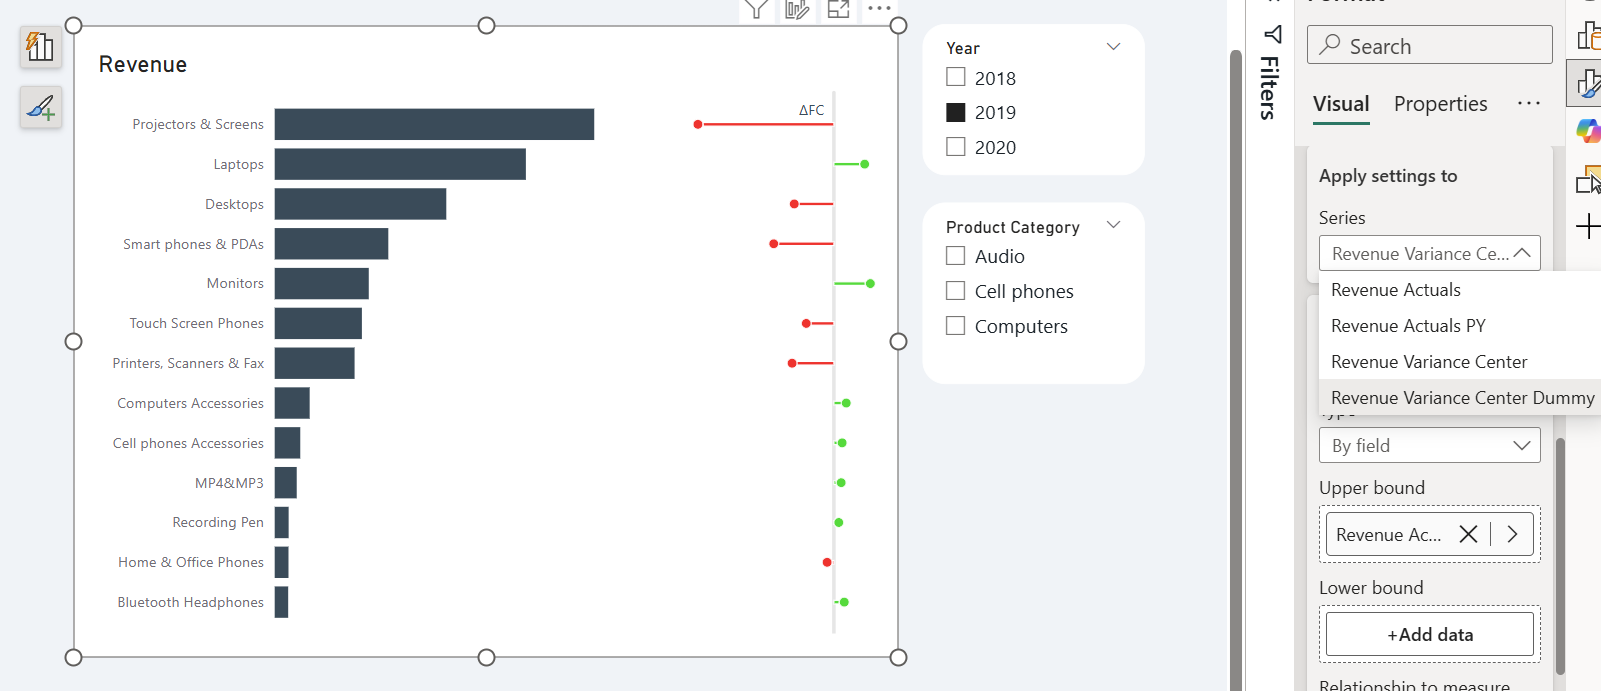
Step 3: Color Error Bars Dynamically
- Use two separate measures for positive and negative values.
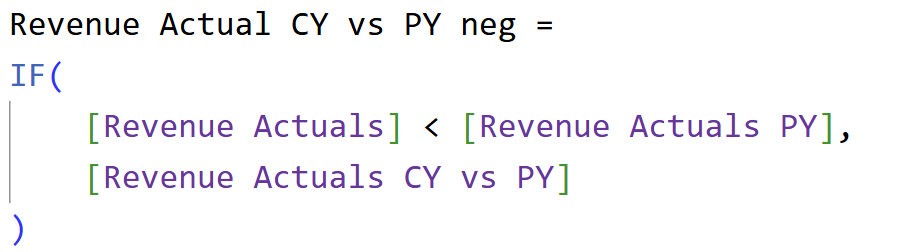
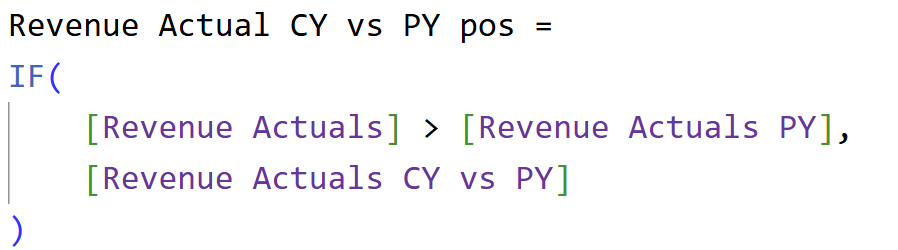
- Add the positive error bars in green, the negative ones in red, by duplicating the center measure or creating a dummy.
Step 4: Label It Right
- Use calculated positions for dynamic data labels (right or left side). Place those measures on the X-axis.
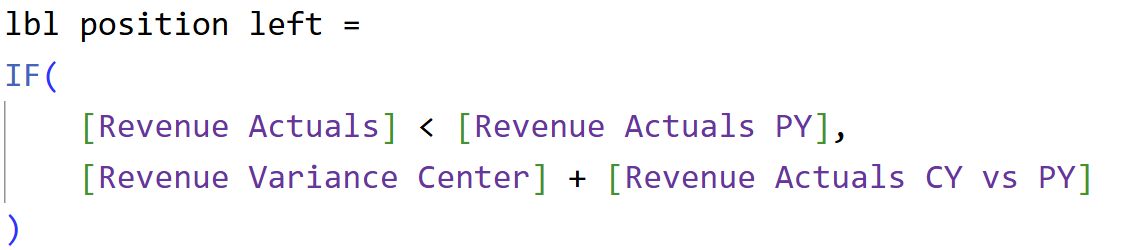
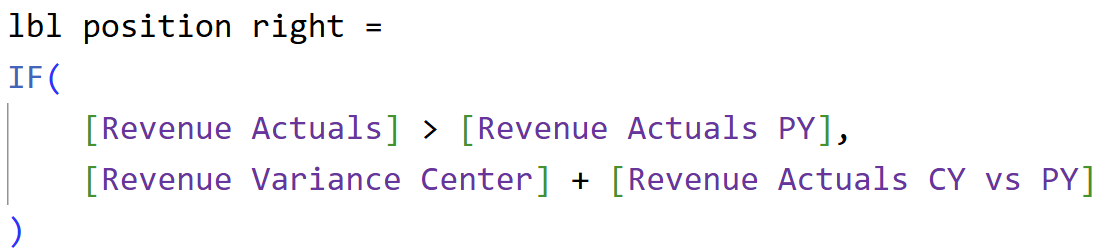
- Format numbers, align labels, and use symbols (e.g. "+" sign) where needed.

Chart 2: Dumbbell Chart (Current vs Previous Year Comparison)
Step 1: Two Dots, One Chart
- Reuse the original setup.
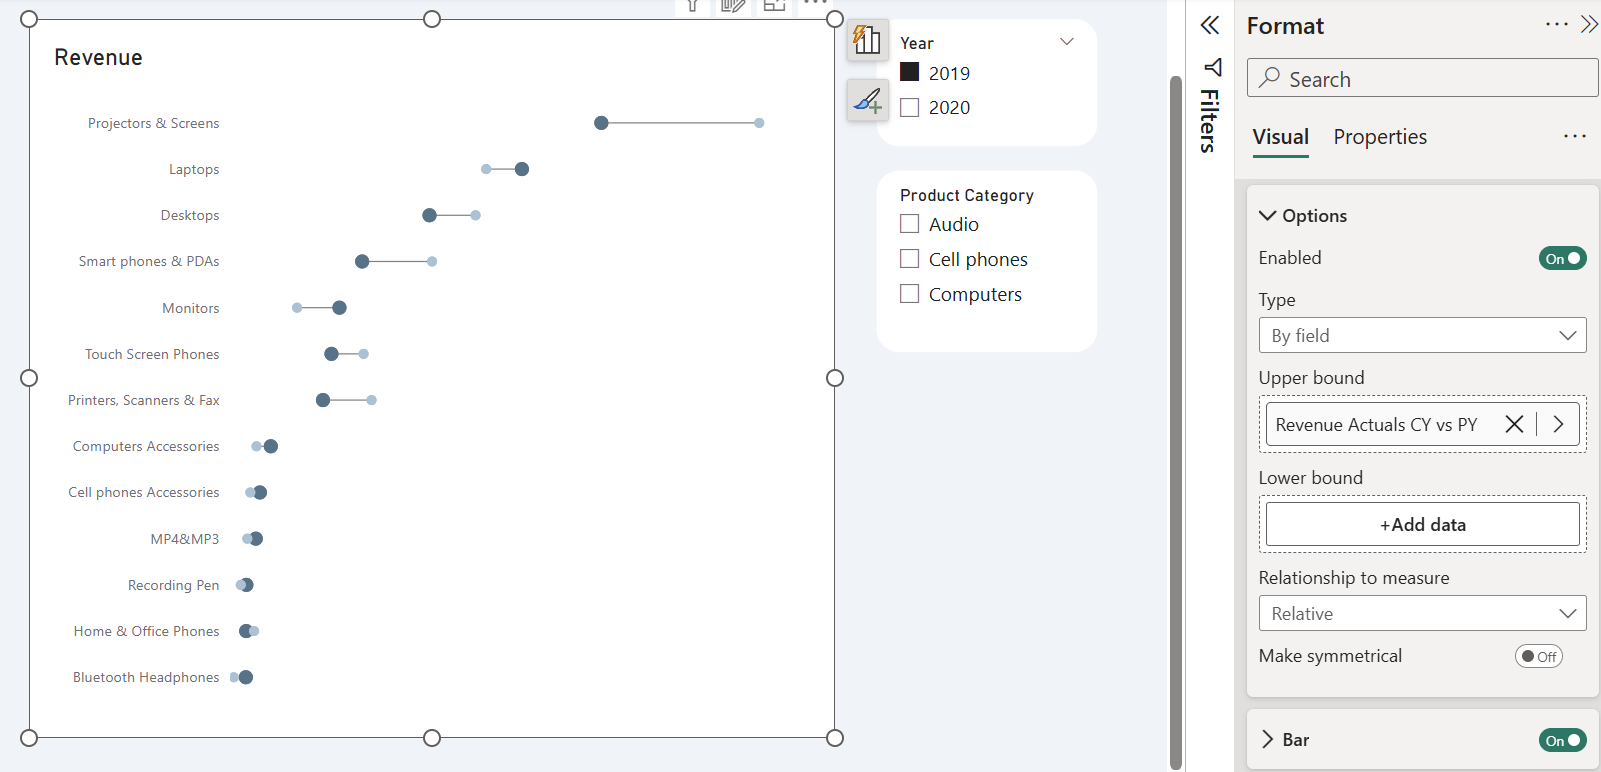
- Add error bars for both current and previous year values with upper and lower bounds set to the same value. Adjust the bars to overlap and set the transparency to 100%.
Step 2: Create the Connecting Line- Add a dummy series and use it to draw the error bar from the previous to the current year.
- Adjust marker shapes and formatting for clarity. Adjust the bars to overlap.
Step 3: Add Smart Labels
- Dynamically position labels depending on which value is greater.
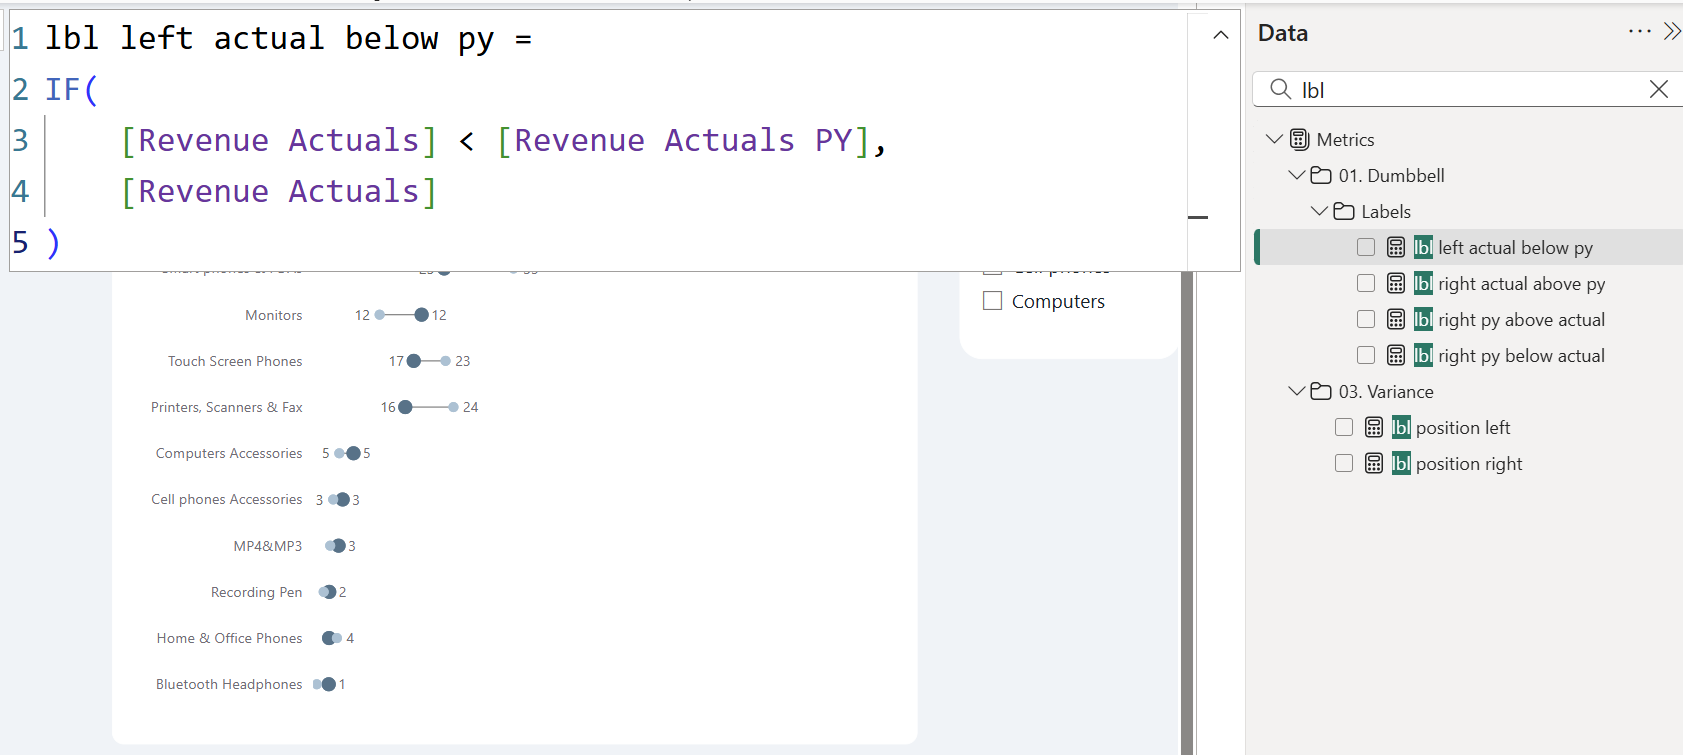
Requires four separate measures for different label placements.
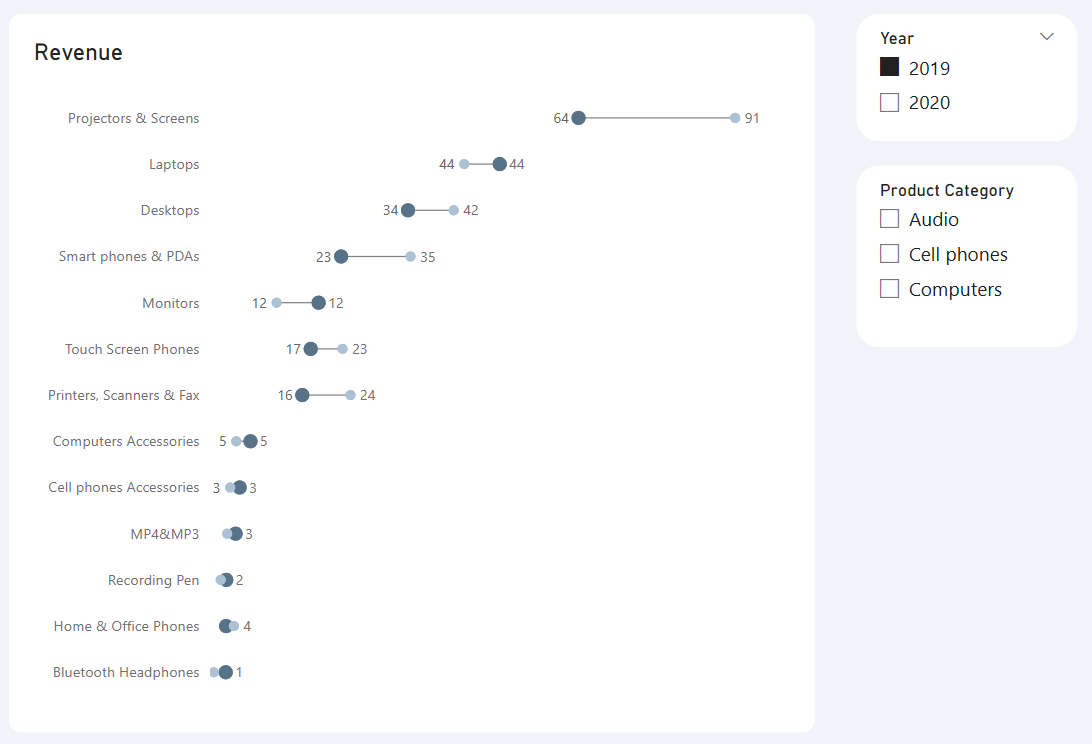
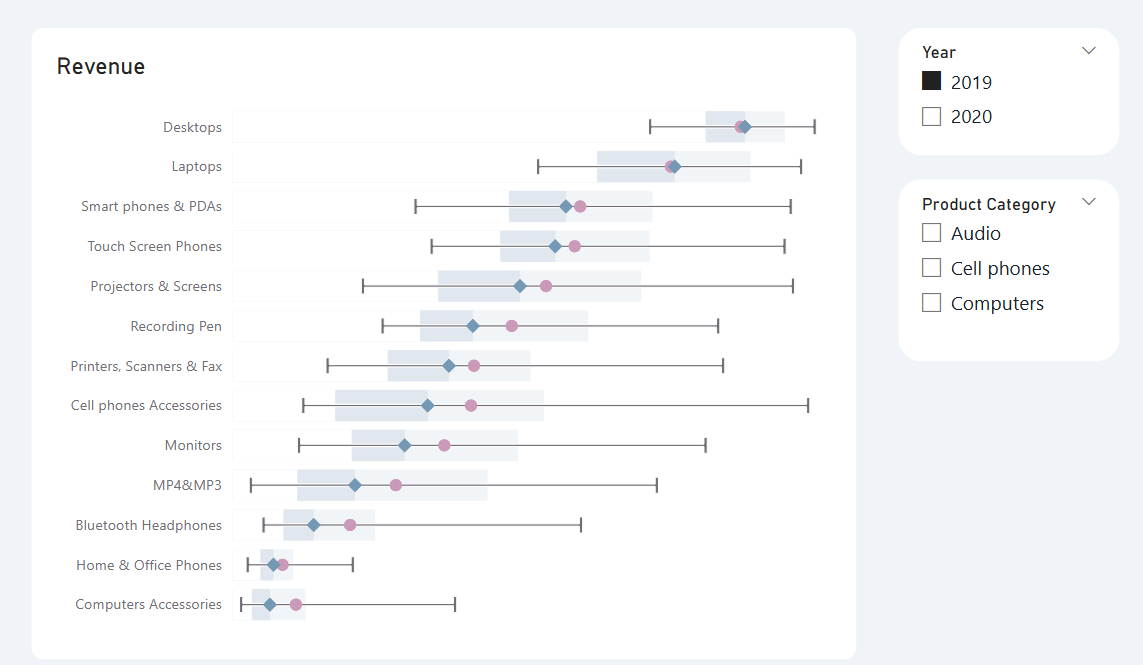
Chart 3: Box Plot (With Min, Max, Median, Quartiles)
Step 1: Add All Summary Stats to X-Axis
- Use measures: Min, Max, Median, Average, 25th & 75th Percentiles.
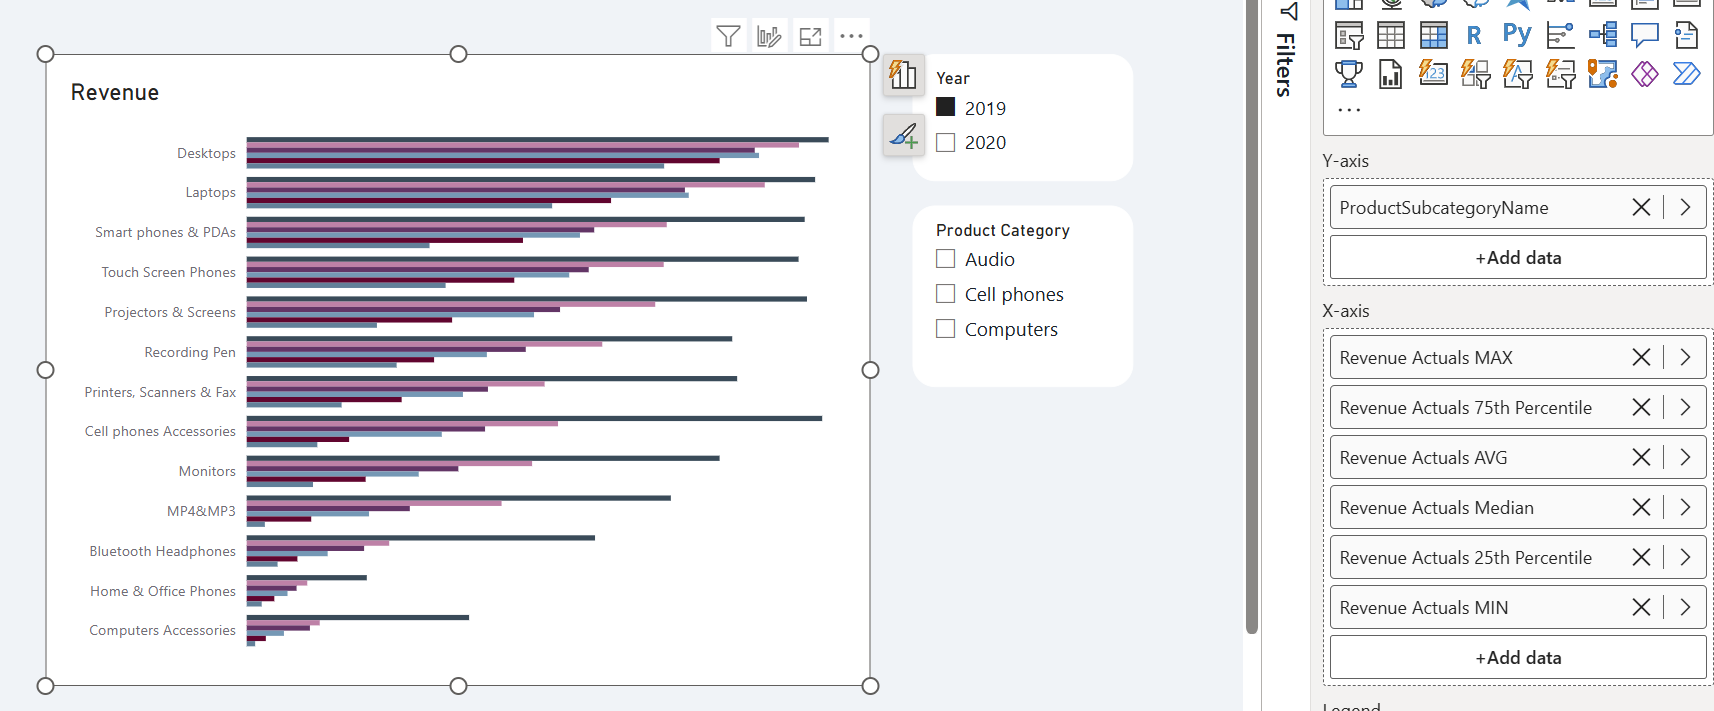
- Set all series bars to 100% transparent and turn on overlap.
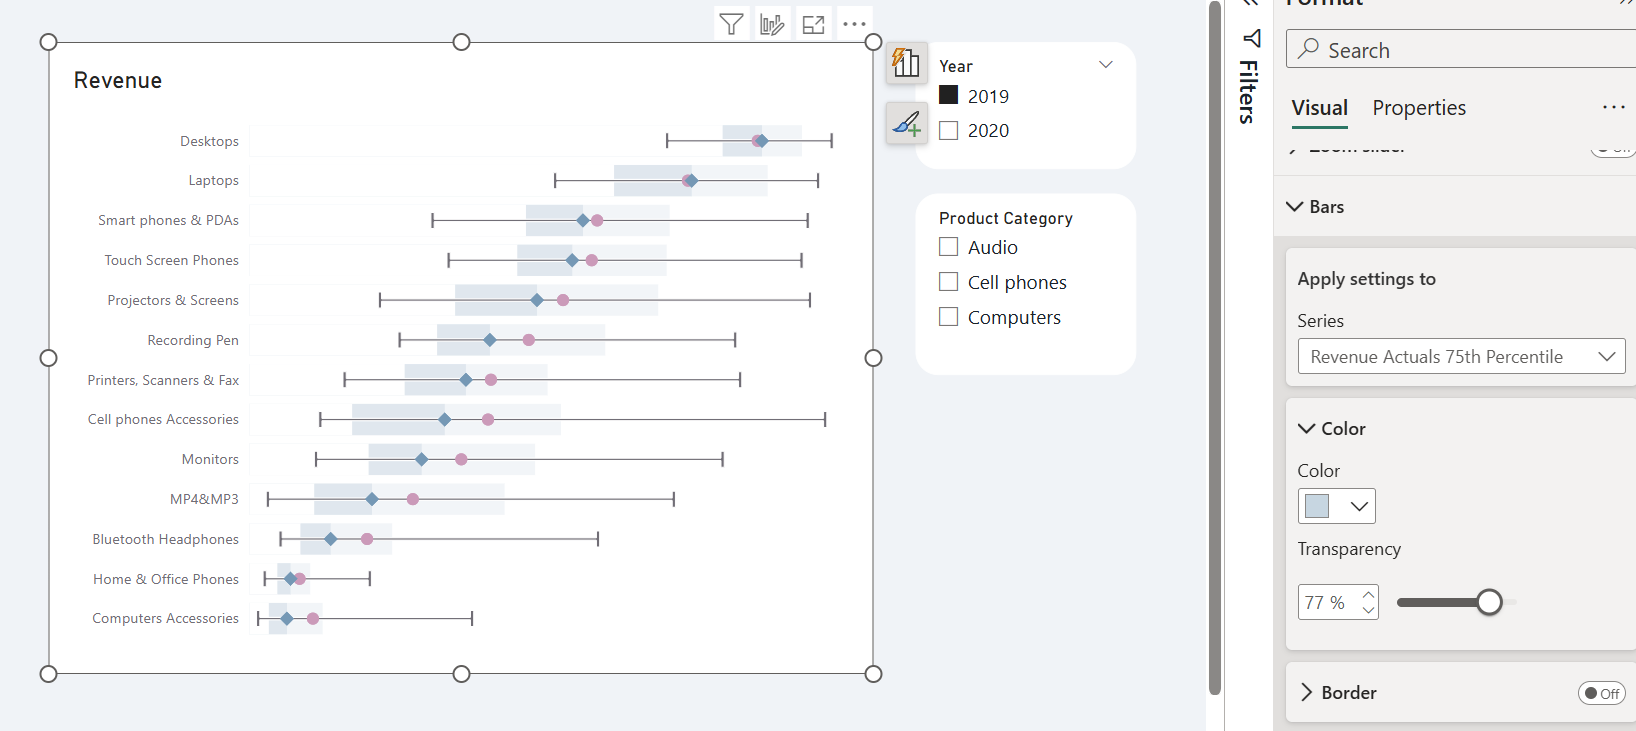
Step 2: Add Error Bars and Markers
- Error bars connect Min to Max.
- Median and Average are added as circular or diamond-shaped markers.
Step 3: Create the Box
Use overlapping bar tricks:
- A visible bar for the 75th percentile.
- A white bar with 0 transparency on top for the 25th percentile (to hide part of the first bar).
Wrap-Up
With this one formatting trick, you can now create:
- Variance Charts - compare actual vs. previous year with color-coded errors.
- Dumbbell Charts - pinpoint before-after or year-to-year changes.
- Box Plots - display statistical distribution natively in Power BI.
This opens doors to endless custom visuals using default components - no bookmarks or external visuals needed.
Hope you like it!
Give it a try and see how it works for you! I’d love to hear what you think or see how you use this trick in your own reports.

