
The Ultimate Time-Saver: Style Presets in Power BI
Styling visuals consistently in Power BI just got easier and smarter. If you're tired of manually tweaking formatting for every visual, Style Presets are your new best friend.
You probably already know about presets from tables and matrix visuals. But now, with the March 2024 update, you can define your own style presets for any visual type - saving time and ensuring design consistency across your reports.
Apr 9
/
datatraining
What Are Style Presets?
Style Presets let you define a set of visual properties (like background color, border, corner radius) and apply them with one click to visuals of the same type.
This means:
Style Presets let you define a set of visual properties (like background color, border, corner radius) and apply them with one click to visuals of the same type.
This means:
- Less manual formatting
- More consistent design
- Easier collaboration across teams
Step 1: Set Up a Theme in Power BI
To start, use Power BI Desktop (March 2024 or later).
To start, use Power BI Desktop (March 2024 or later).
- Insert a visual (like a table or bar chart).
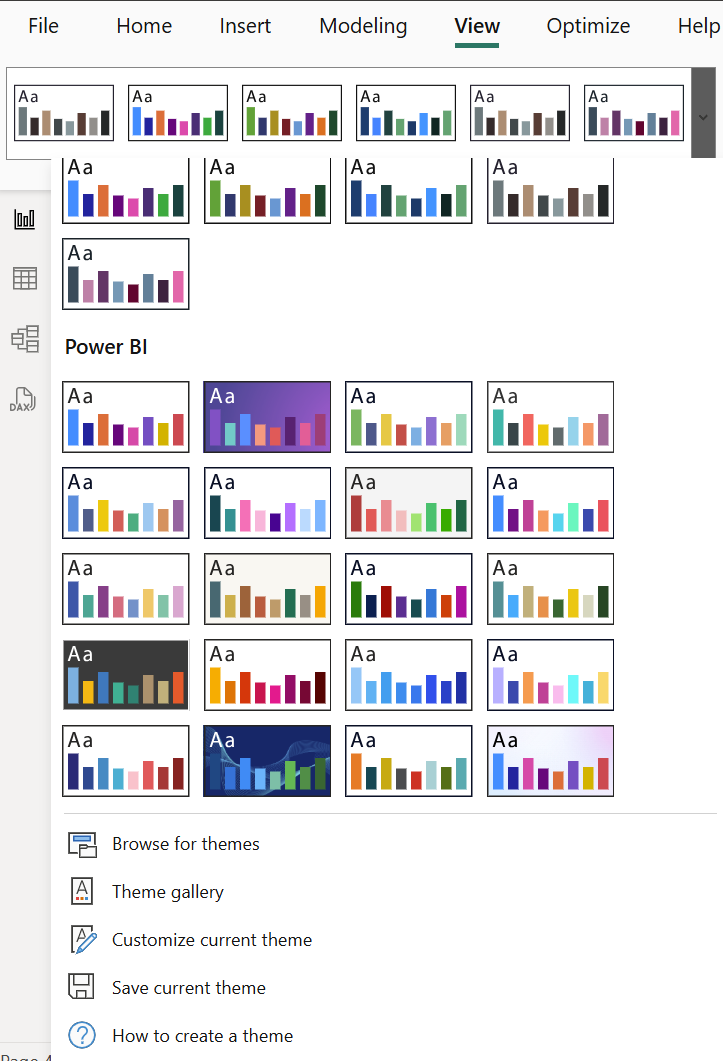
- Go to the View tab → Select a base theme.
- Click Customize current theme.
4. Give it a name (e.g. “Demo Theme”).
5. Go to Visuals and define formatting:
5. Go to Visuals and define formatting:
- Background color
- Border color
- Corner radius (e.g. 20px)
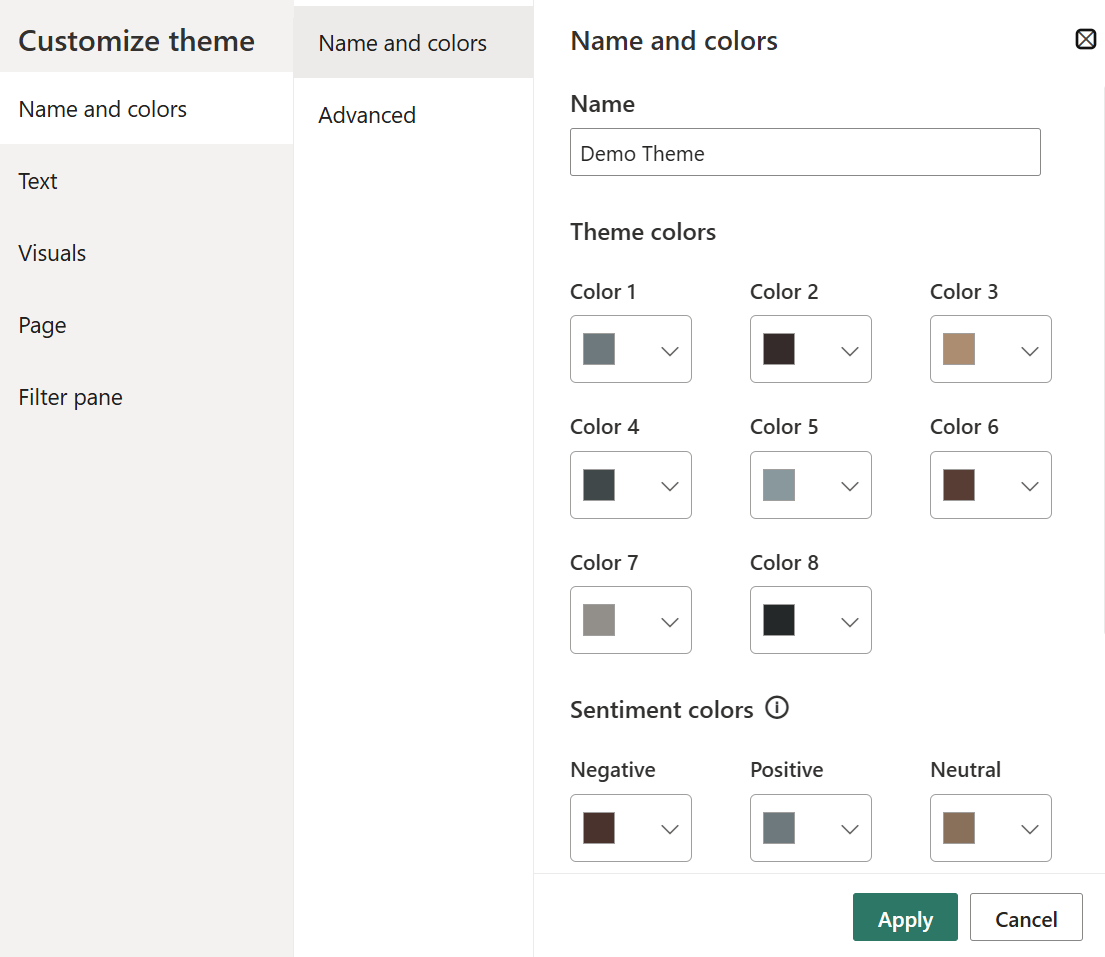
Click Apply and see your changes reflected on all visuals.
Step 2: Export the Theme as JSON
Now we take it a step further:
- Export the theme: View → Save current theme
- Save it as demo-theme.json
- Open it in a code editor (Visual Studio Code recommended)
To make it readable, right-click → Format Document.
Step 3: Add a Schema Reference
For IntelliSense and validation, insert the Power BI theme schema at the top:
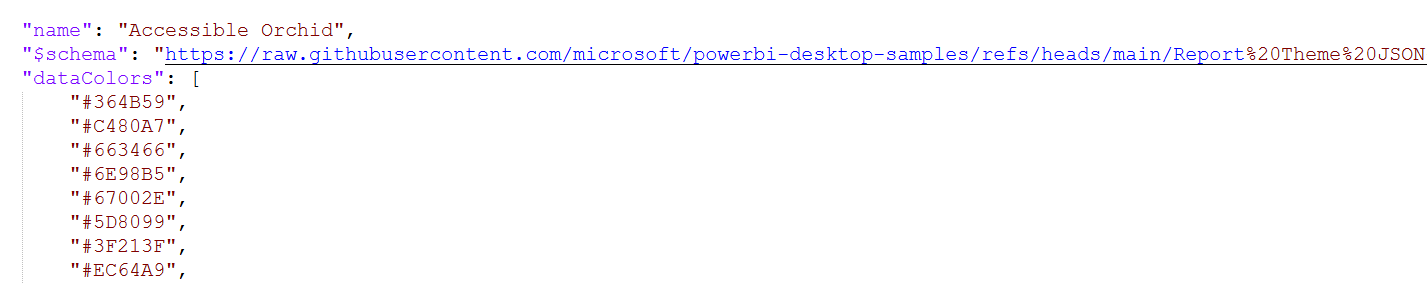
"$schema": https://raw.githubusercontent.com/microsoft/powerbi-desktop-samples/refs/heads/main/Report%20Theme%20JSON%20Schema/reportThemeSchema-2.140.json
You can find the latest schema link in Microsoft's documentation and schema repository.
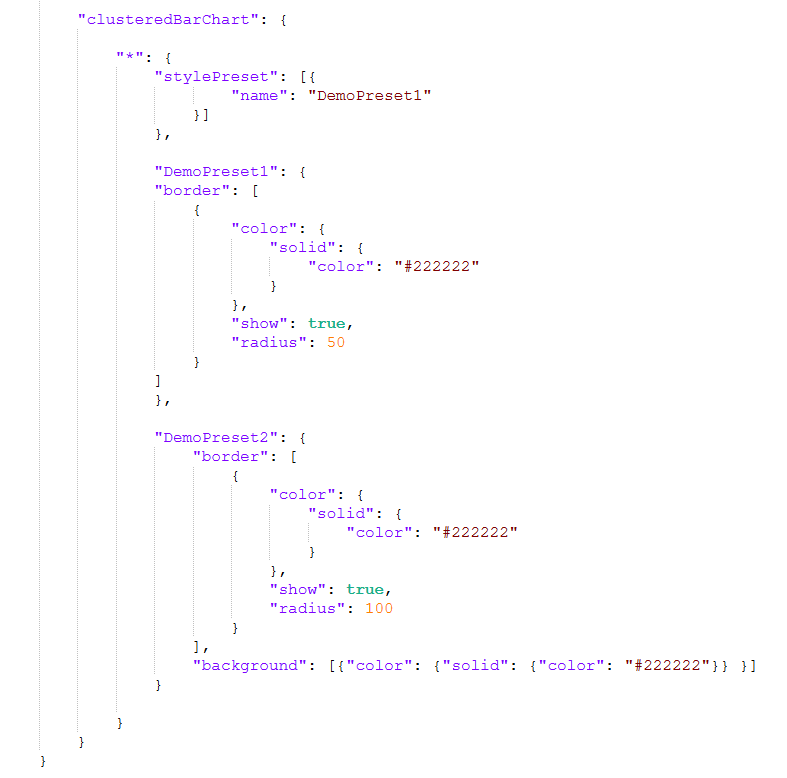
Step 4: Define Custom Presets for Visuals
Inside the visualStyles section, you’ll define presets for a specific visual type (e.g., clusteredBarChart).
- Use the visual type name as the key.
- Within it, define multiple presets by name.
- Set formatting options for each.
Step 5: Import and Test in Power BI
- Save the JSON file.
- Go to View → Browse for themes → Import your modified JSON.
Once imported:
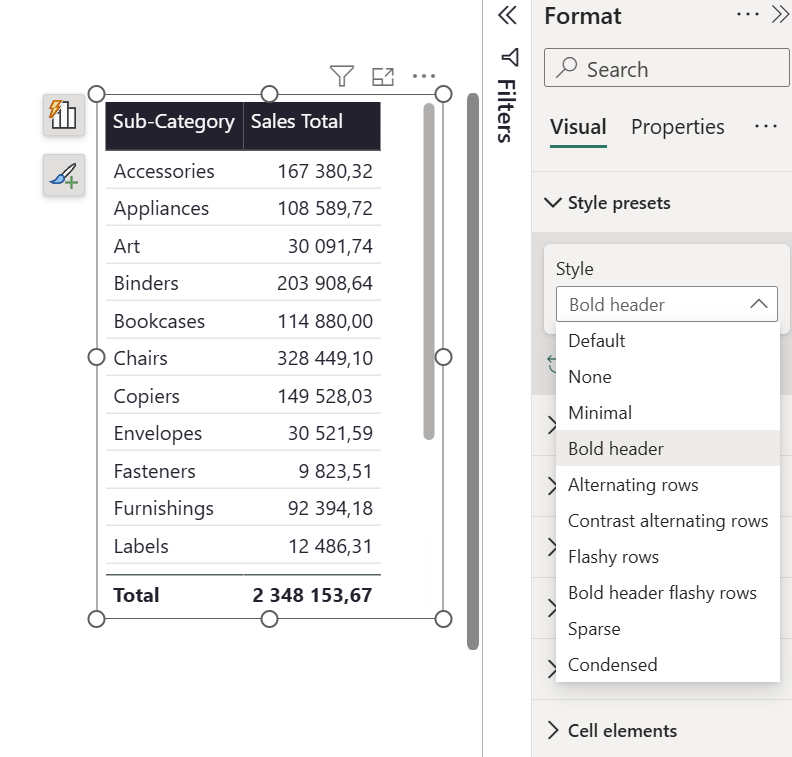
- Go to a visual’s Format pane.
- Under Style Presets, you'll now see your custom styles.
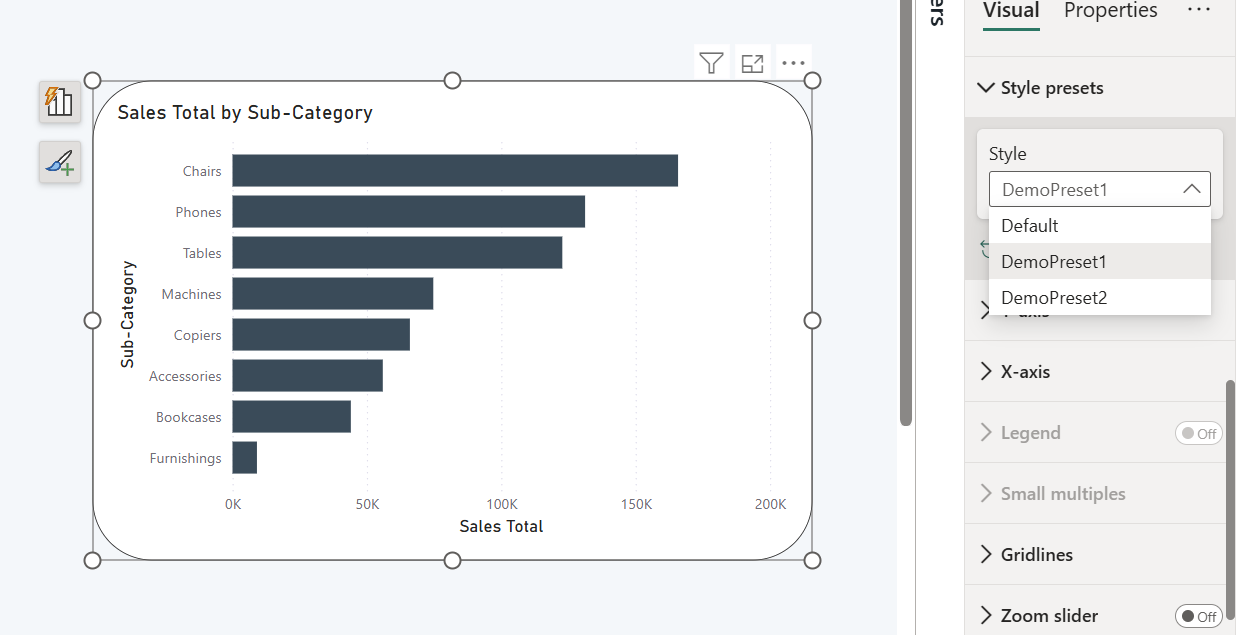
Switching between them applies all settings instantly.
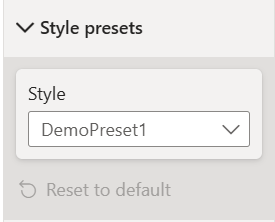
Bonus: Default Preset Behavior
Bonus: Default Preset Behavior
If you click Reset to default, Power BI uses the preset defined as "default" in your theme file. However, note: sometimes this might not apply visual formatting unless you explicitly select the preset. This may be a bug or a nuance to be aware of.
Why This Matters
With custom style presets, you can:
With custom style presets, you can:
• Define branding and design guidelines once.
• Reuse them across visuals and reports.
• Speed up development significantly.
• Promote visual consistency across your team or organization.
Imagine one theme file containing presets for bar charts, line charts, pie charts, cards, and more - all selectable with one click.
Hope you like it!
Give it a try and see how it works for you! I’d love to hear what you think or see how you use this trick in your own reports.
How to Power BI
Watch it here

COMPANY
Power BI Report Launch
CONSULTING
Power BI Report Launch
ESSENTIAL
Power BI Report Launch
PRO
Write your awesome label here.
Embedding Power BI in Power Point
TEAM
Power BI User Training
Add your email and we will let you know when the Power BI Design Transformation starts
Join us in 2025
Thank you!
Write your awesome label here.
Join our newsletter!
Thank you!
EARLY ACCESS
Write your awesome label here.
Join our newsletter!
Thank you!
https://datatraining.io/path-player?courseid=pl300intro&unit=674075f0305e7aabd10d3afbUnit
Power BI Report
CONSULTING
Power BI Project
We will be in touch in 24h
Fabric Project
We will be in touch in 24h
Design Transformation Program
We will be in touch in 24h
Design Transformation Program
Schedule the call with our team
Power BI Project
Schedule a call with our team
Intro Session
Schedule a call with our team
Fabric Project