Why Resumes Often FailHiring based on resumes alone can be misleading. Some candidates might oversell their experience, while others with huge potential get overlooked because their resumes don’t reflect the depth of their skills.
That’s why shifting the screening process to focus on actual Power BI reports has proven to be a game-changer. It allows candidates to demonstrate skills instead of just describing them.
The Demo Report That Changes Everything
Imagine you're applying for a job. Instead of just listing your skills, you build and submit a Power BI report that shows your design thinking, modeling skills, DAX ability, and creativity.
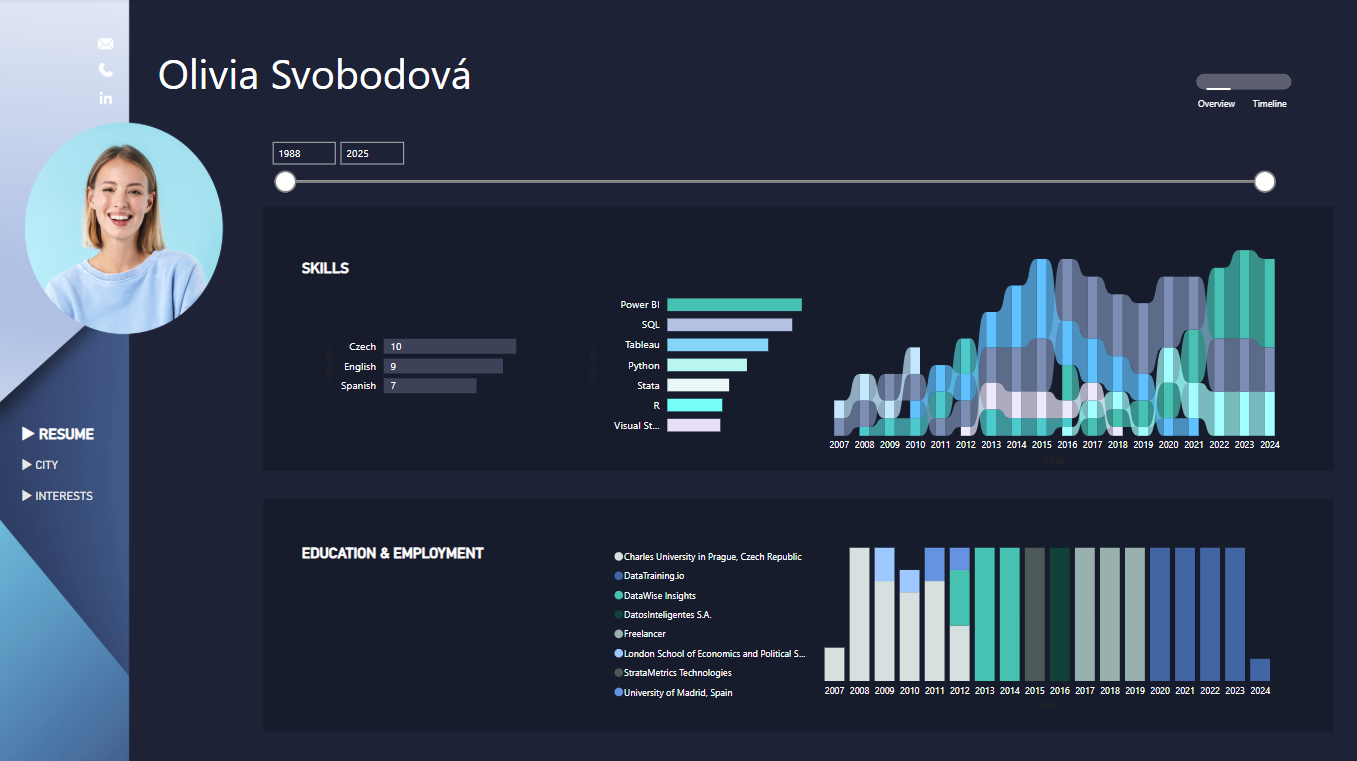
A sample resume-style Power BI report, with custom design and visual storytelling.
This report wasn’t just a visual resume, it had unique data and engaging visuals showing real Power BI skill in action.
Start with the Data Model
Any review of a report should begin with the data model. A strong data model tells the reviewer that the person understands how Power BI works under the hood, not just how to make charts.
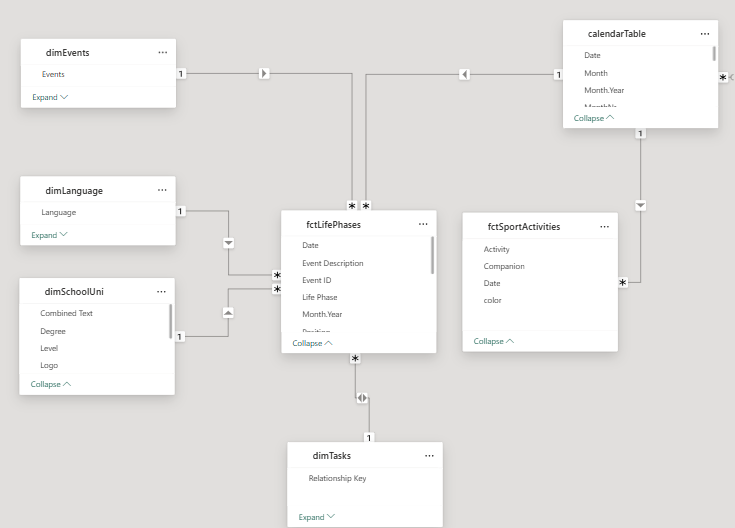
Tables are separated into fact and dimension tables, showing thoughtful model structure.
One key detail: the applicant used a custom calendar table, not the default Auto Date/Time. This shows understanding of best practices in Power BI.
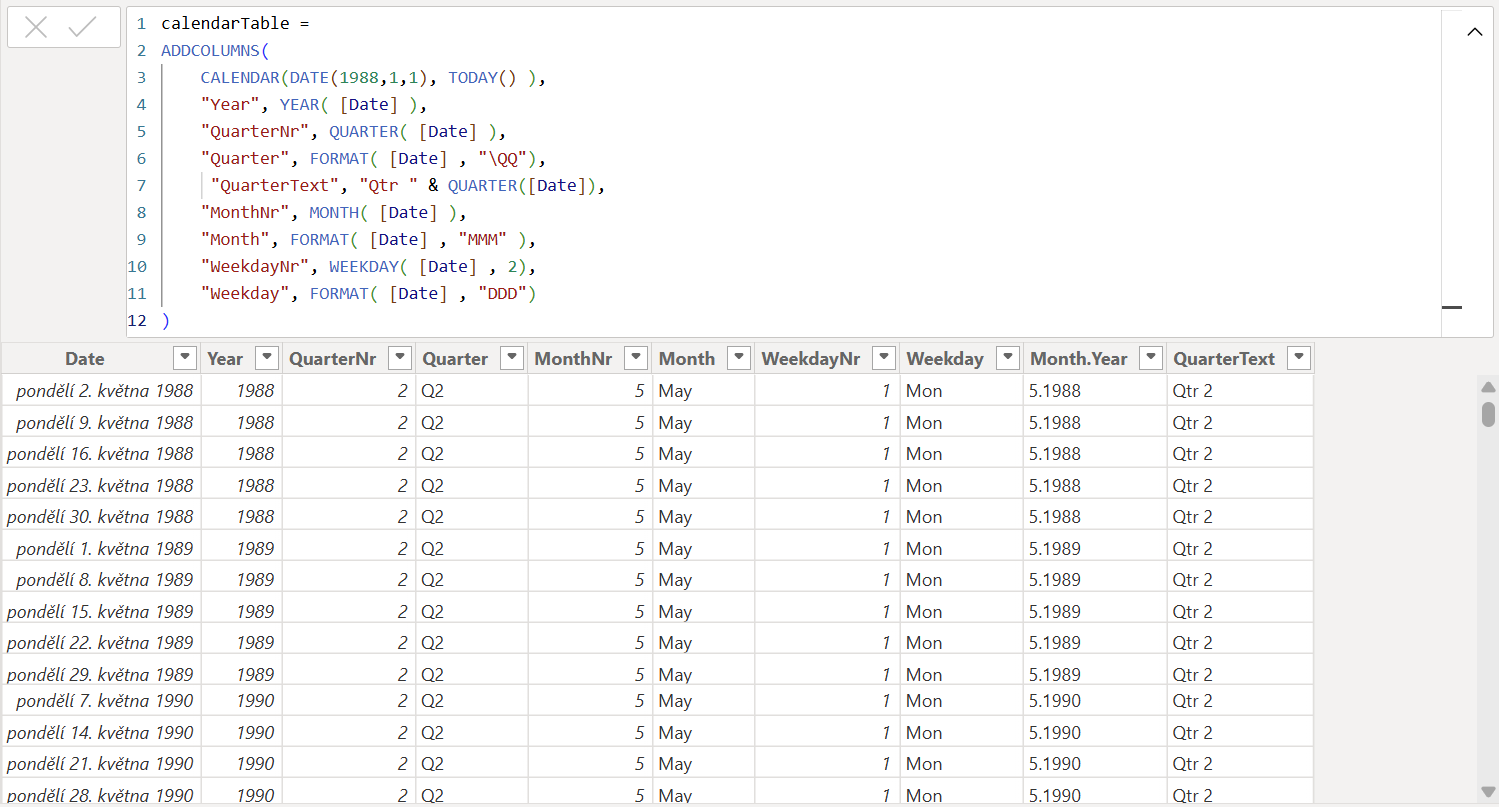
Even small touches - like sorting months correctly or using a date hierarchy - signal experience and attention to detail.
DAX Patterns That Tell a Story
Beyond visuals, look at the DAX measures used in the report.
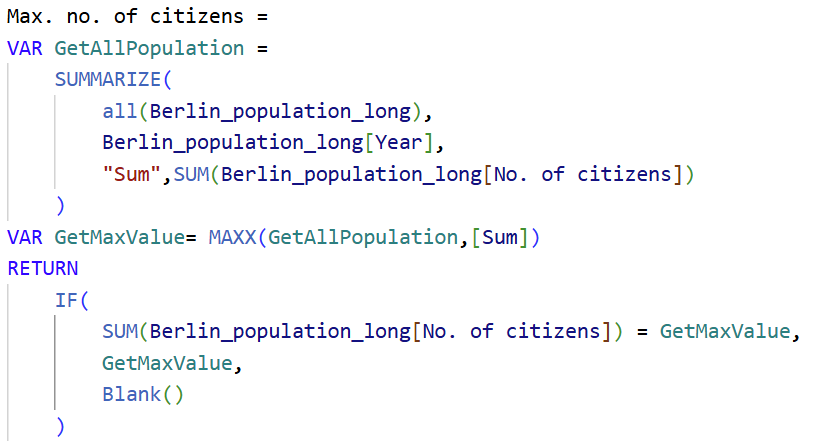
The example here highlights the max, first, and last values in a line chart using custom measures. The way the applicant used SUMMARIZE, variables, and filtering logic showed deep understanding of filter context and calculation logic.
Design That Stands OutNext, the visual presentation.
This report used:
- A custom theme
- Clean alignment and spacing
- Consistent visual language

Design isn’t about making things pretty, it’s about
user experience. This report had a clear navigation pane, a memorable layout, and visuals tailored to tell a story.
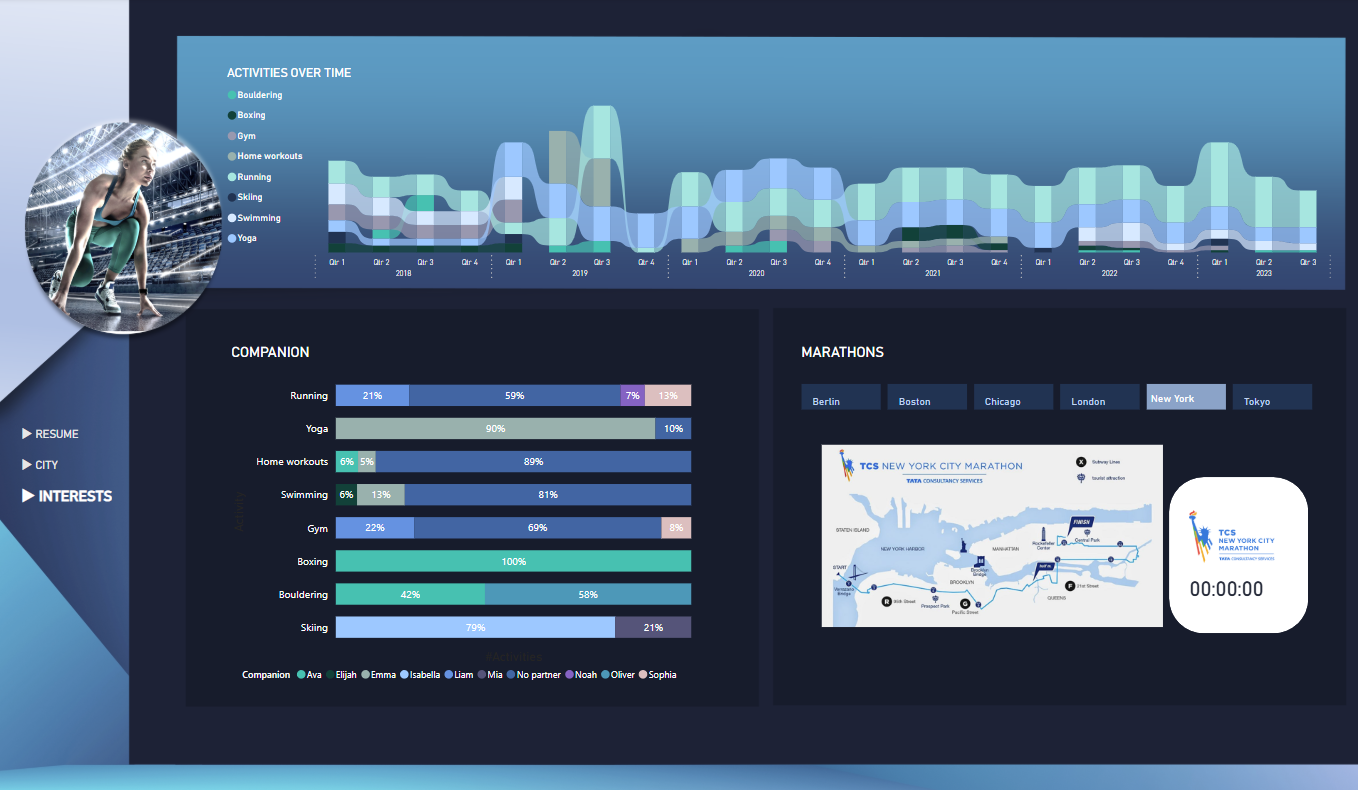
One unique feature: equal-height columns that showed working periods.
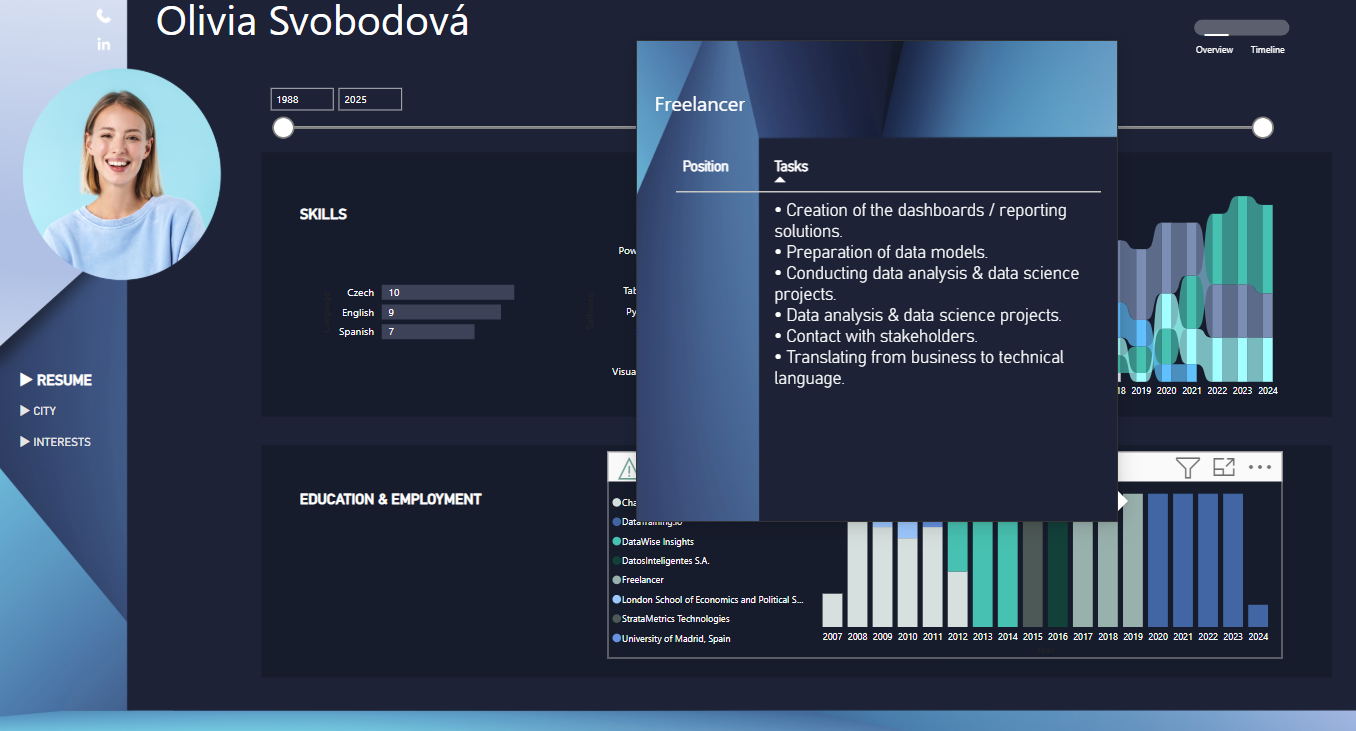
And a toggle that switched to a timeline view with custom tooltips and images = a sign that the applicant is up to date on advanced Power BI techniques.
Showcasing Interaction and UX
On the city page, the applicant used slicers and icons to toggle between metrics like number of cinemas and libraries.
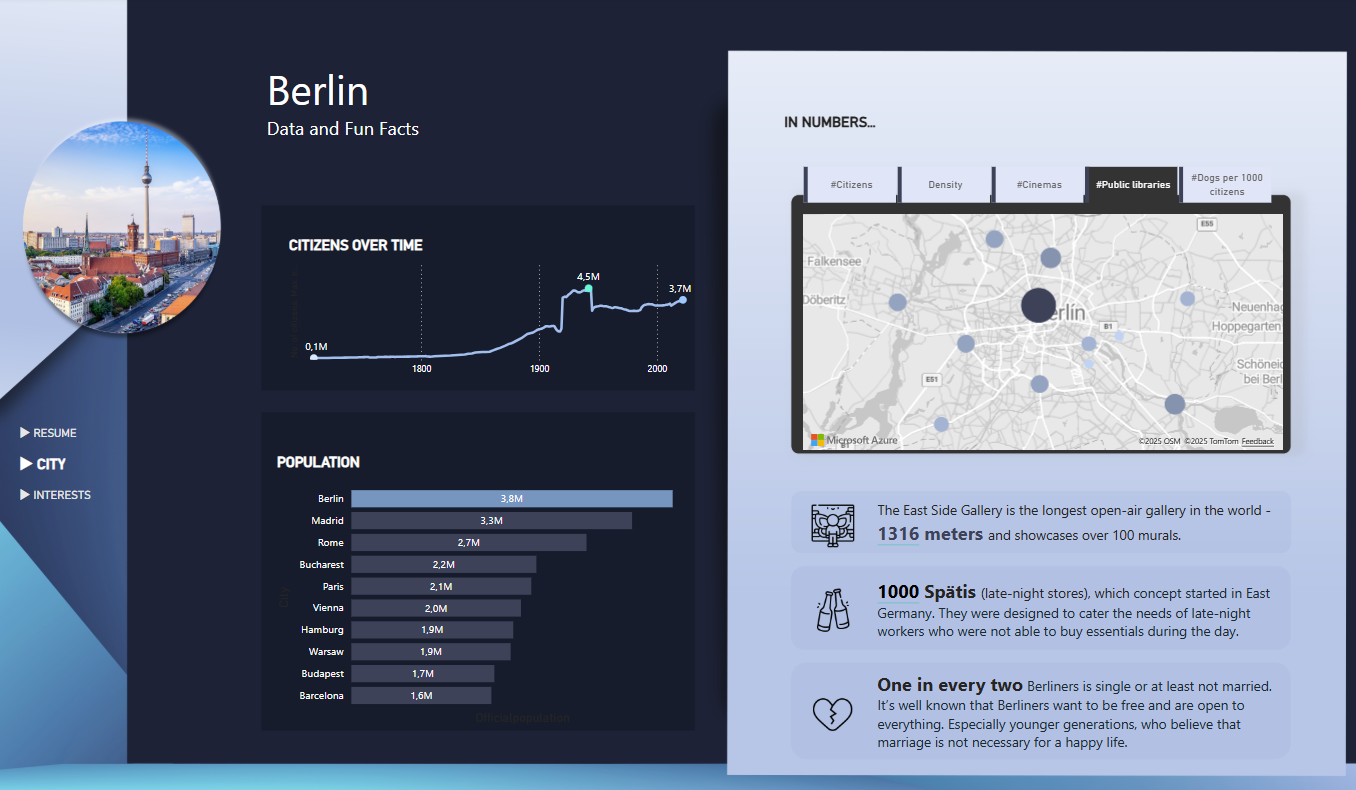
This kind of interaction reflects UX thinking and demonstrates how a developer can build user-friendly reports.
Power Query Matters Too
Even though visual and modeling skills are important, don’t overlook Power Query.
Using query parameters, combining files from a folder, custom functions, or advanced transformations shows a candidate’s ability to handle real-world messy data.
Even small steps like using Change Type with Locale indicate an understanding of precision and robustness in transformations.
Final Advice (For Applicants and Recruiters)
For applicants:
- Don’t say you have nothing to show. Build a project using open or personal data.
- Think of this as a portfolio piece.
- Don’t copy existing resume report templates. Make it personal and unique.
For recruiters:
- Consider switching from resume-based screening to report-based evaluations.
- You’ll get faster, clearer signals about who has real potential.
Hope you like it!
Give it a try and see how it works for you! I’d love to hear what you think or see how you use this trick in your own reports.


