

How to Implement Pagination in Power BI: A Step - by - Step Guide

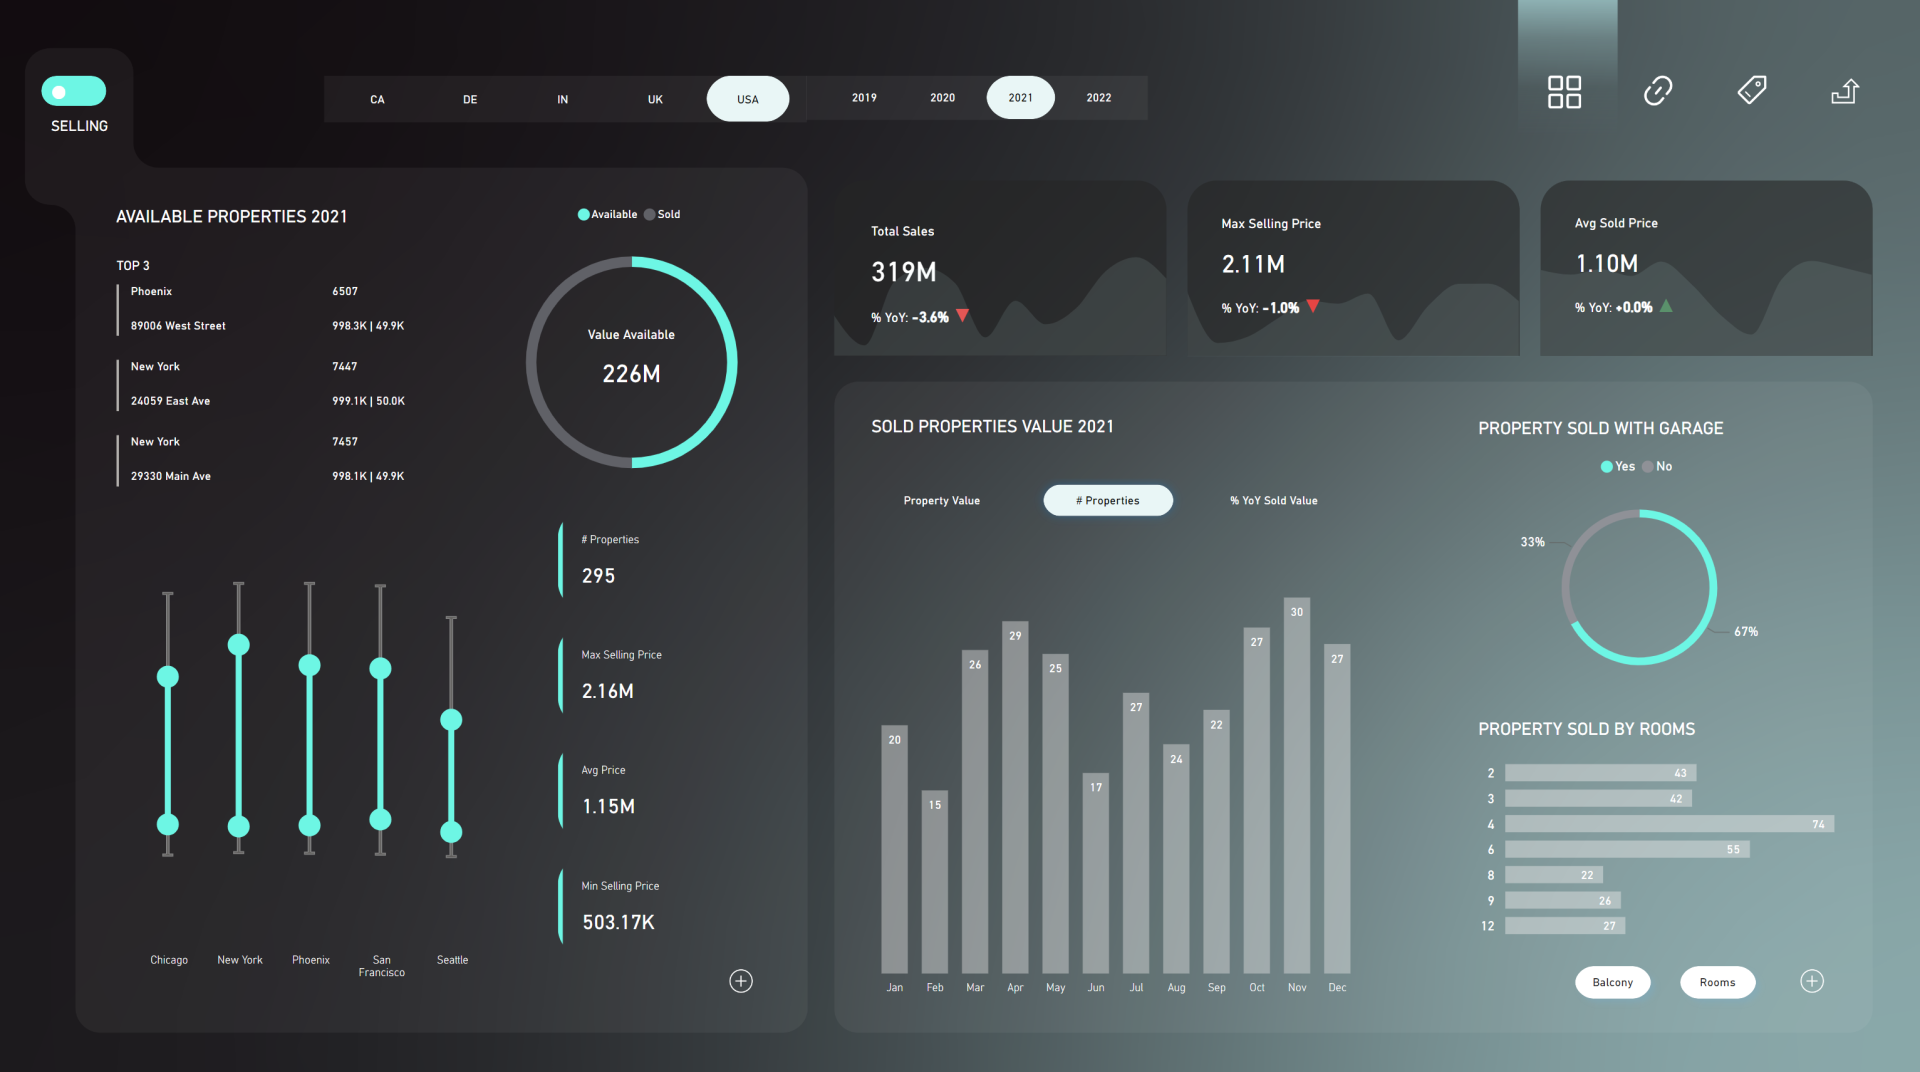
Looking move your Power BI reports beyond static visualization? Let's try to add some subtle animations, specifically animated arrows. Ready for a reporting game changer?
Apr 20 / datatraining
Step 1: Create GIFs
First, go to the 'Animations' tab in PowerPoint. Here, you can make icons or images move just the way you want by picking from various animation options, directions, and cool special effects.
Step 2: Adjust GIF Loops
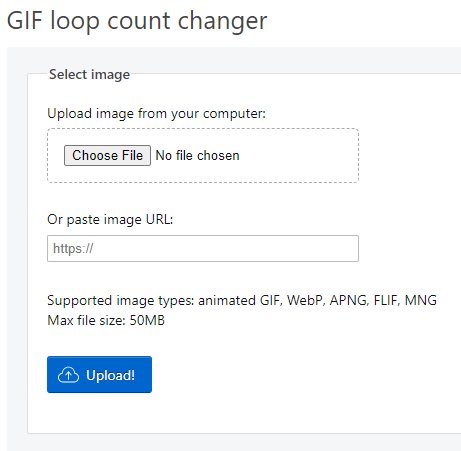
Once you're happy with your GIFs in PowerPoint, save and export them. If you wish to decide how many times your GIF plays on a loop, go to this website: [ezgif.com/loop-count](https://ezgif.com/loop-count). Upload your GIF, and set the number of times you want it to repeat. Remember, if you don't specify the number of loops using the website, the GIF will loop endlessly, potentially causing distraction for report users. My suggestions is to set it to loop only once.


Step 3: Host Your GIFs

Take your GIFs and upload them to image hosting websites such as [Postimages.org](https://postimages.org/). Once uploaded, grab the direct links to these images for the upcoming step.
 

Step 4: Set Up Conditional Measure
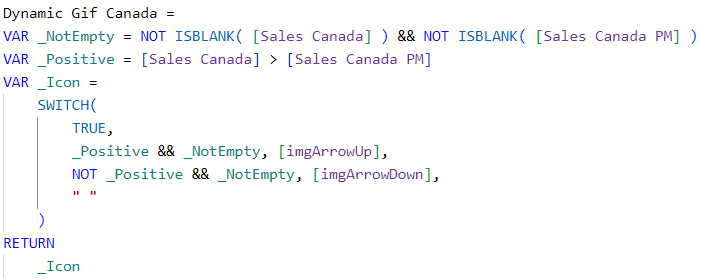
Integrate your GIFs by placing their links as text in Power BI measures, ensuring the data category is set to image URL. Next, create a measure that checks if values are not blank and conditionally compares the current value with the previous or target value. Depending on the increase, decrease, or any specific situation you specify, the measure will return the corresponding GIF.

Step 5: Add to New Card Visual
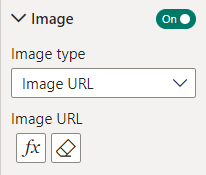
Adjust the image settings of the New Card Visual to Image URL, and within the conditional formatting options of the image URL, apply the measure. This ensures that the appropriate GIF appears alongside the KPI based on the specified conditions. Explore different placements and sizes of the GIF in the image settings to find the perfect balance for a visually engaging KPI card.


Hope you like it!
When used in moderation it can be a true upgrade :)

How to Power BI

Watch it here

Launch Power BI Reports
that bring your organization
to a fully 
data-driven world.

Power BI Launch

After years of consulting we have developed a holistic solution for launching Power BI Reports in 3 months. From key metrics discovery, to report design, implementation and stakeholders' training. We know precisely how to launch Power BI reports that drive organizations' growth.

Power BI Trainings

Our technical trainings for report developers instantly upskill your teams. Alongside our unique business user trainings the improvement in overall organizational data literacy becomes immediately actionable.