Step 1:
First, let’s create a disconnected table with the recruitment process steps.

Step 2:
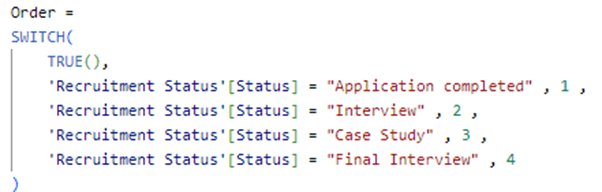
Next, create a calculated column in this table to define the sorting order for the process steps. This will make sure everything appears in the right sequence and you are set with the very first step.
Step 3:
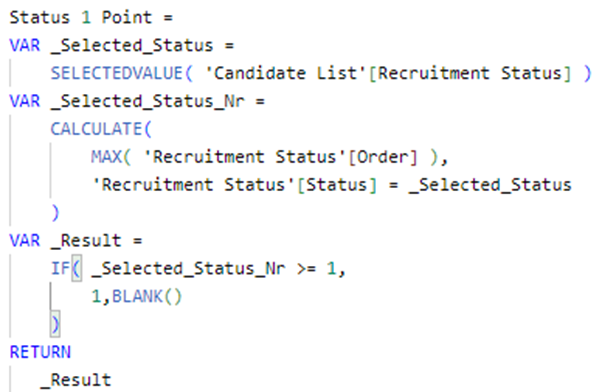
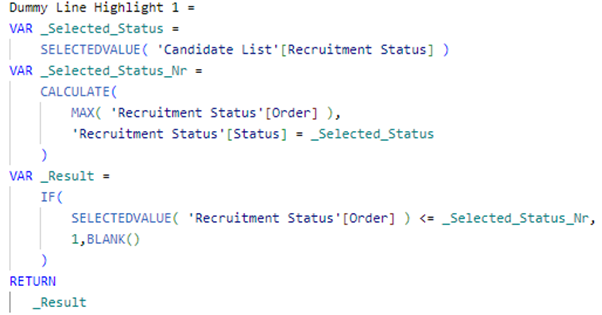
Now it is time to Create the DAX measures: one that retrieves the value of the order, second - highlighting the previous status. We have to create one for each status. Finally, create one measure highlighting the actual status.
Step 4:
Now that we have the Measures ready, it’s time to build the chart. Let’s begin with the simple line chart and watch the magic happen.
• Drag all the measures created to the y axis (as below) and you will find a dummy measure created in order to have a position.
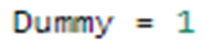
• Now, its time for formatting. Let’s turn the “Series Labels” on and position it to the left. Also, turn on the markers and choose the desired marker – I have selected the circle and increased the size.
• Next, we have to play around with the error bars settings to create the clean, distinct lines – grey for previous statuses and colored for the actual status.
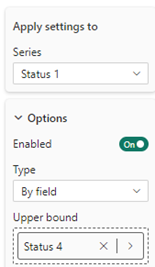
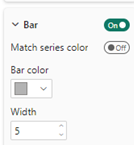
• Repeat for the actual status as well.
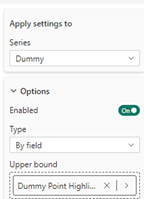
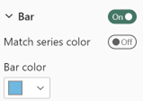
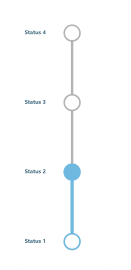
Hope you like it!
Give it a try and see how it works for you! I’d love to hear what you think or see how you use this trick in your own reports.