1. Slicer Search Box
When you're working with long slicers, like a product list, scrolling becomes frustrating. Luckily, you can activate a search box inside slicers.
Just click on the ellipses (...) in the top-right corner of the slicer and enable the search box.
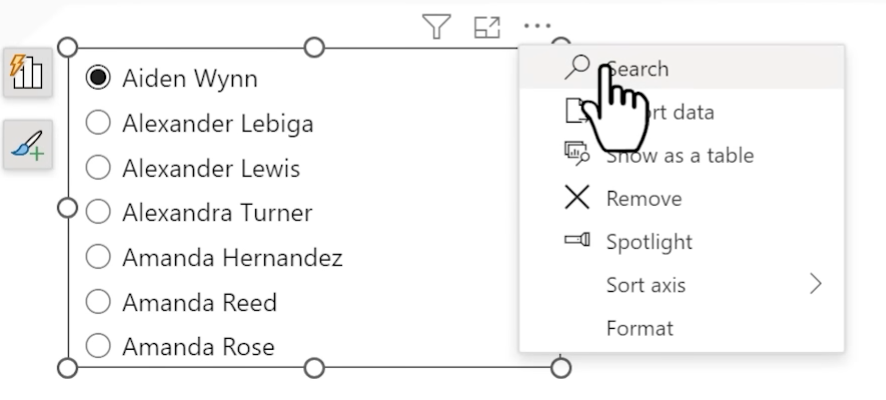
This instantly boosts usability, especially for users navigating large datasets.
2. Wildcard Search in Filters
In Power BI filters, you can use wildcards for more flexible search behavior.
For example:
- *bike* → finds anything that contains the word "bike"
- bike* → starts with "bike"
- *bike → ends with "bike"
This works in Basic filters, Slicer filters, and the Filter pane.
Wildcard logic is case-insensitive and extremely handy when working with inconsistent naming conventions.
3. Multi-Column Sorting in Tables
Want your tables to sort by more than one column (e.g., Region first, then Product)?
Just hold Shift and click additional column headers.
Power BI remembers the order in which you clicked. You can sort by up to three columns this way.
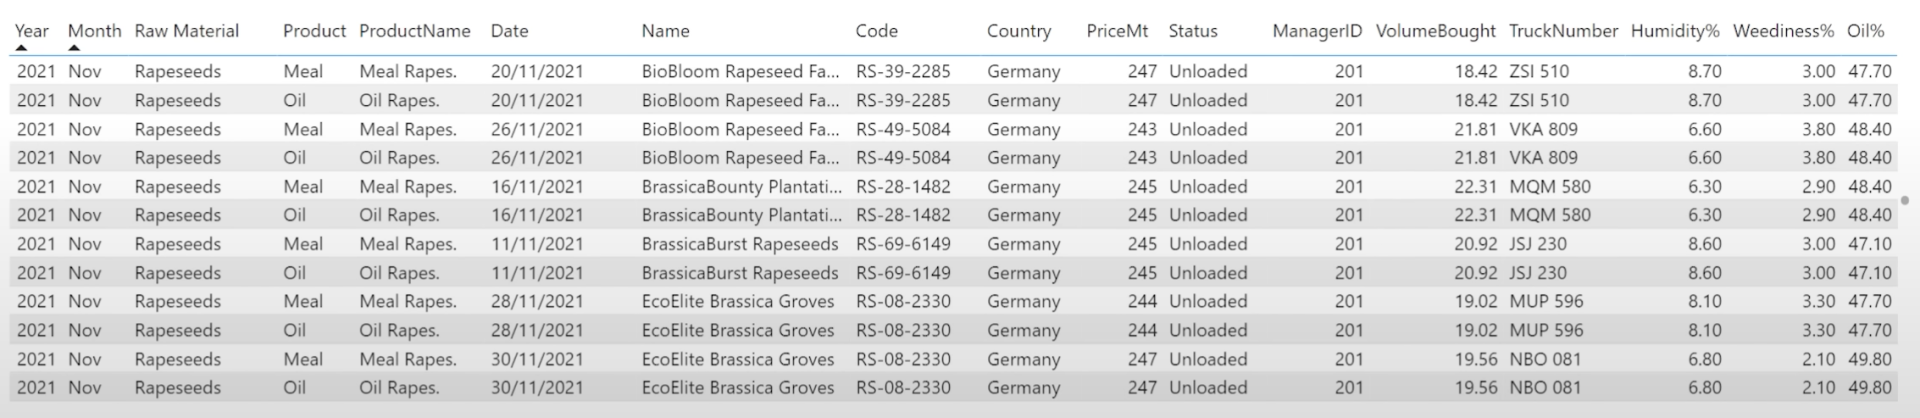
This trick is great for reports that require hierarchical or grouped sorting logic.
4. Sort Visuals by Hidden Measures
You don’t need to display a measure to use it for sorting.
Example:
You want to sort a chart by revenue, but display profit. So just,
- Drag revenue into the visual on the tooltip section
- Sort by revenue
This gives you full control over how visuals are ordered, even when the measure isn't shown.
If the visual doesn’t have a tooltip section, such as in a table, you can still use a field for sorting or calculations by dragging it directly onto the visual. Then resize the column to make it invisible. Just make sure to turn off text wrap so the column stays collapsed and doesn’t expand automatically.
5. Page Navigation Shortcut
Jumping between pages quickly? Just right click onto arrows to open it in a new window.
Perfect for multi-monitor setups or comparing multiple pages side-by-side.
Note: This only works in Power BI Desktop.
6. DAX Shortcuts
Speed up your DAX writing with these keyboard shortcuts:
1. Ctrl + Shift + L → Multiselect
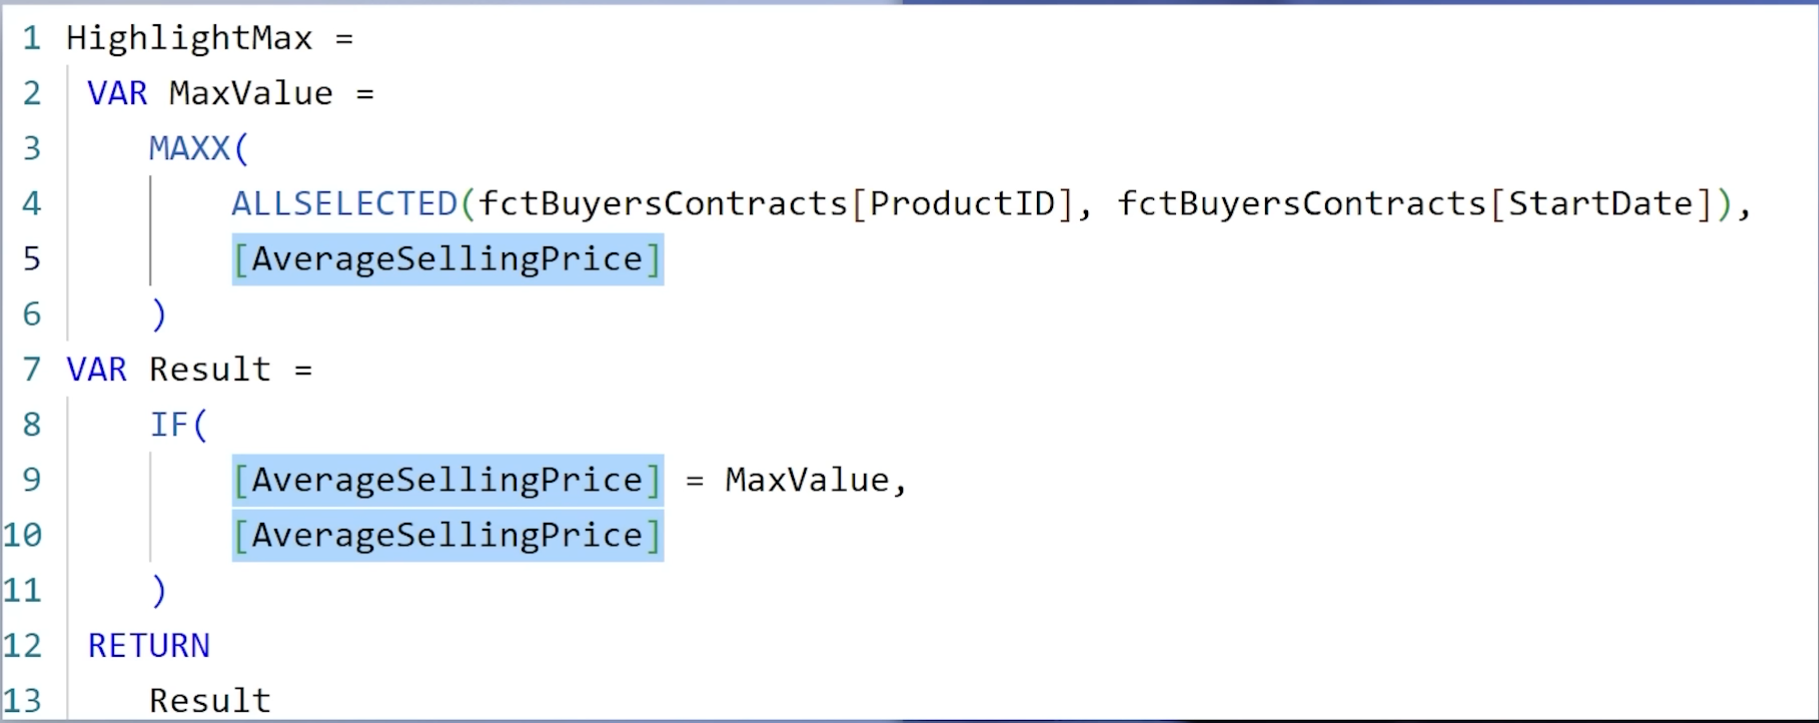
2. Ctrl + / → Comment selected rows
Using shortcuts can greatly improve your DAX writing efficiency - especially in complex models.
7. Measure Tables & Folders
Keep your data model clean by organizing measures into a dedicated table.
Steps:
Create a new table with Enter Data (call it for e.g."_Measures")
- Move all your measures into this table
- Delete the dummy column
Then organize them into folders:
Right-click a measure → Display Folder → use \ to create subfolders
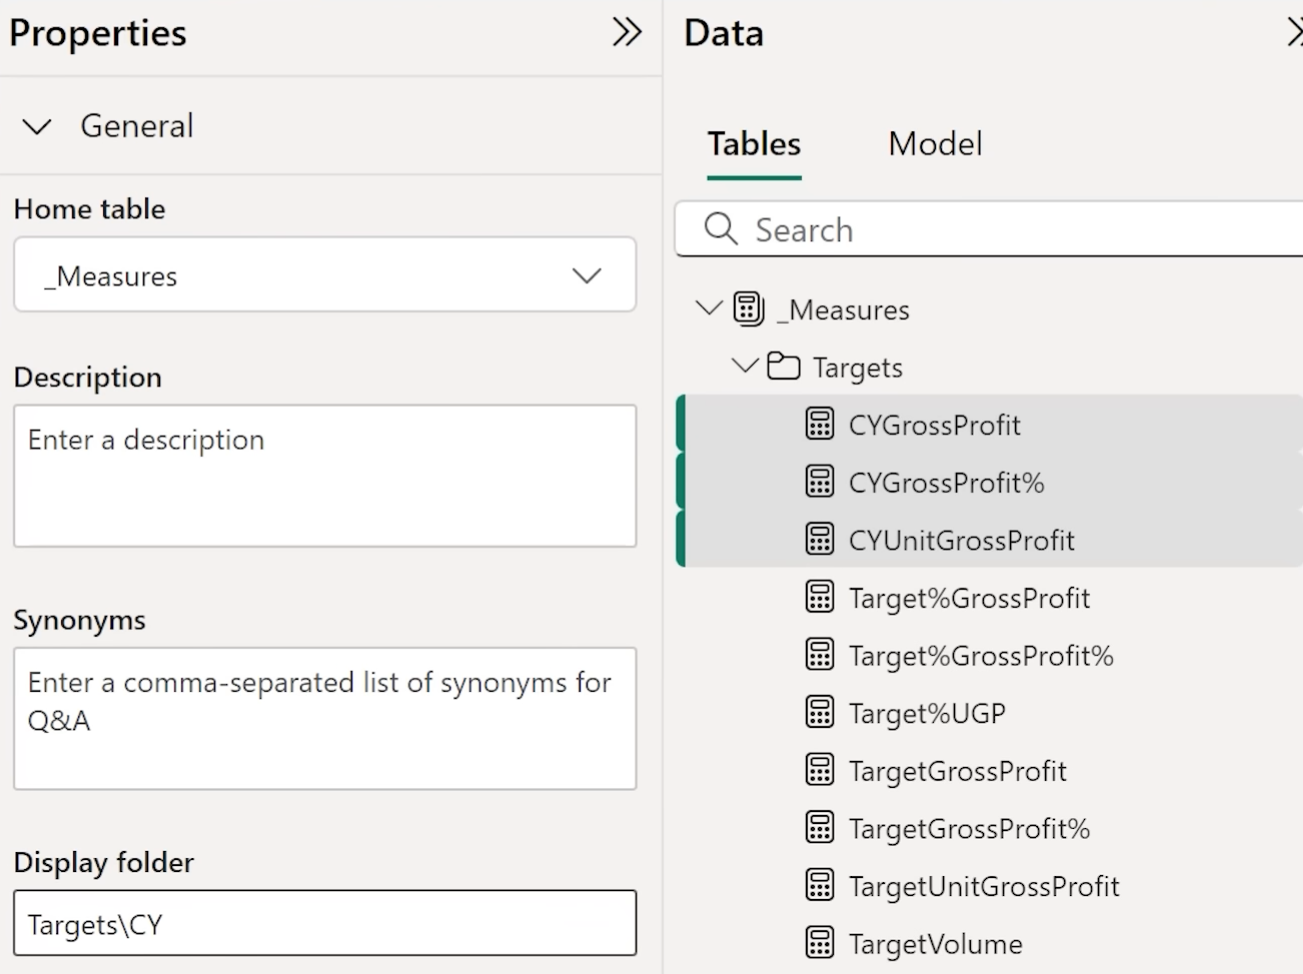
This helps reduce clutter and makes collaboration easier.
8. Column from Examples in Power Query
Instead of writing M code manually, use Column from Examples.
Steps:
In Power Query, go to Add Column → Column from Examples
- Type a few sample outputs
- Power BI guesses the logic
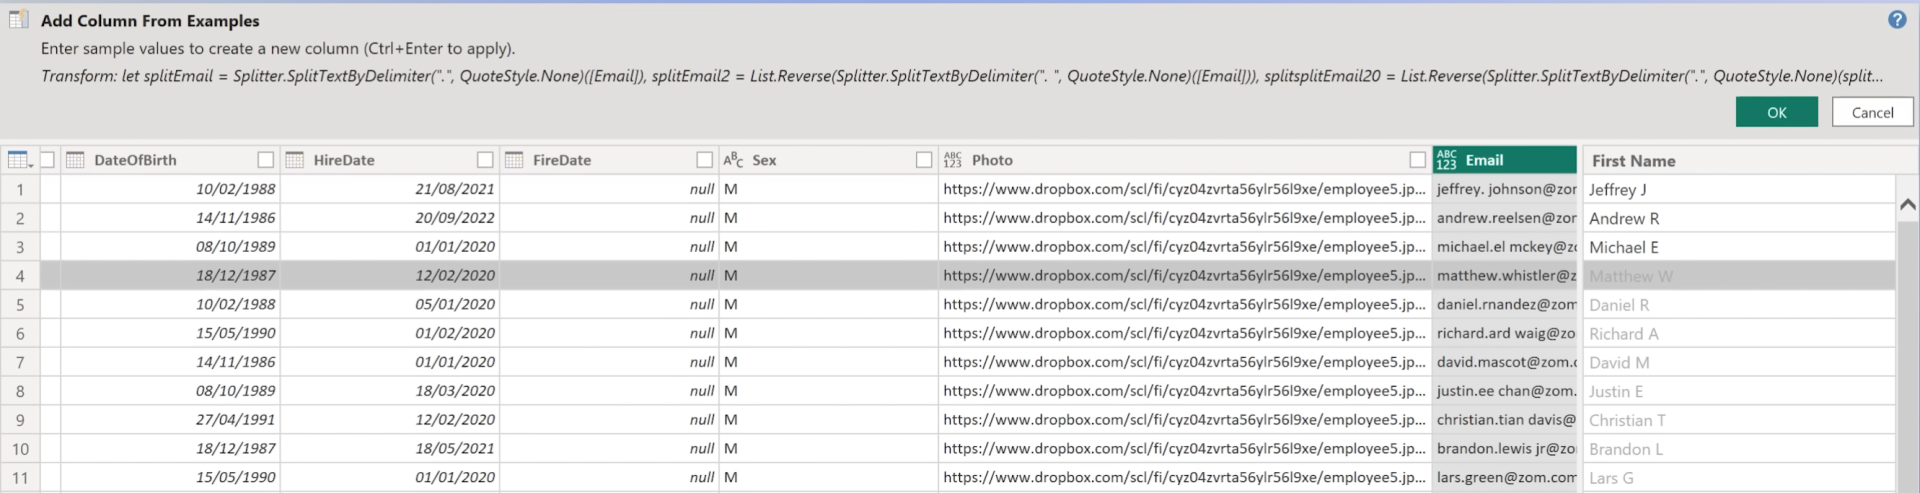
This is a huge time-saver for string manipulation, date parsing, and more.
9. Explore the List of All M Functions
Want to learn more about Power Query (M) functions?
In Power Query, go to the formula bar and type = #shared and convert it into a table.
This displays a list of all functions available - over 700 of them - with previews and tooltips.
It’s a powerful way to discover new capabilities without needing to check the documentation.
10. Copy Queries Between Files
Need to reuse a Power Query transformation?
- Go to Advanced Editor
- Right click on the query and copy it
- Paste it into another report’s queries pane
Great for templates, shared logic, or migrating transformations between environments, you don’t have to copy a code pro advanced editor.
Final Thoughts
These 10 features may seem small individually, but combined, they can drastically improve your Power BI workflow. From usability boosts to modeling tricks, these are tools you’ll want to use every day.
Which one is new for you? Let us know, or pass it along to your Power BI team to spread the knowledge.
Hope you like it!
Give it a try and see how it works for you! I’d love to hear what you think or see how you use this trick in your own reports.

