In Power BI, the core visuals have limitations and might not fit every business scenario. To overcome this, we have two options: either customize existing visuals or import custom visuals, which can have some downsides. Here, our focus is on creating a status tracking visual with the core visuals of Power BI. If you've ever ordered something online, you're probably familiar with tracking visuals that show the various stages of your package's delivery process. This type of visual helps us see at which stage our items are and track their progress. The beauty of it is that it can have many use cases, like recruitment stages or sales funnel progress. You can adapt this visual to infinite scenarios.
Step 1: Setting up a Disconnected Table
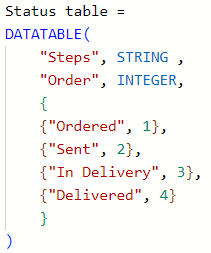
The first step is to create a disconnected table containing all the different stages or statuses in your process. In the example, we're tracking shipments from order placement to delivery. The table includes statuses like "Ordered," "Sent," "In Delivery," and "Delivered." Additionally, a sorting order column ensures the correct sequence.
1. In Power BI, create a table with the necessary statuses and a sorting order column.
2. Ensure there's no relationship between this table and your shipment data.
3. Sort the Steps (stages) column by the order column.
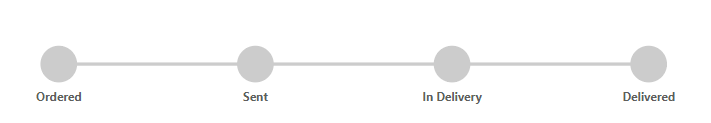
Step 2: Building the Line Chart
1. Add a line chart to your report.
2. Drag the shipment status from the disconnected table to the x-axis.
3. Create a dummy measure for a horizontal line using a simple formula like `dummy = 1`.
4. Add the dummy measure to the visual, resulting in a flat line, and make the markers as big as possible.

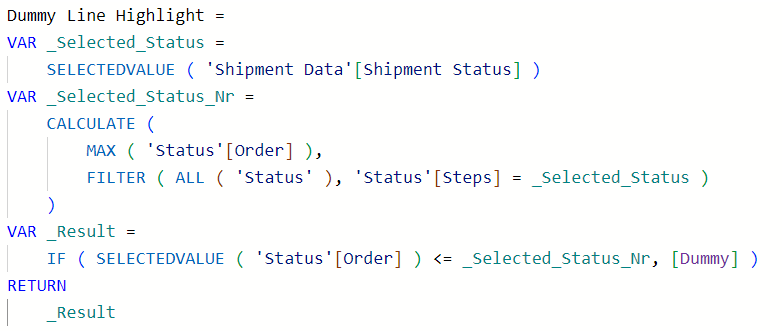
Step 3: Adding Highlights for Selected Shipment
Next, we'll add a highlight to the line, indicating the progress of the selected shipment.
1. Create a measure named "dummy line highlight" using variables to identify the selected shipment's status and status number. This measure to highlight the line up to the selected shipment's status.
2. Add the "dummy line highlight" measure to the visual.
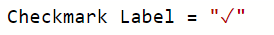
Step 4: Incorporating Check Marks
Let's add check marks to signify completed stages. This involves creating a dummy measure for positioning the check marks and also another measure for checkmark values that will be as custom data labels.
1. Add a measure for check mark positions to the visual, and make sure the value of the measure is slightly below than the dummy measure, for best positioning the checkmarks, and set the stroke width of this measure to zero.
2. Create a measure for check marks (e.g., using the check mark symbol) and add it to the custom data label of the positioning measure.

Bonus: Display Additional KPIs
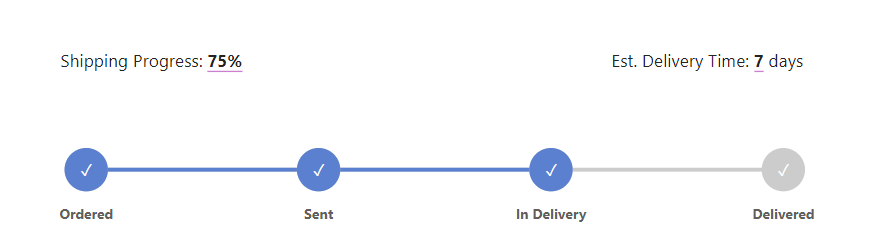
You can use the extra space above the line to display additional key performance indicators (KPIs). In the example, we added a shipping progress percentage and estimated delivery time in days.
1. Create measures for additional KPIs (e.g., progress percentage, estimated delivery time).
2. Add text boxes to the visual to display these KPIs, aligning them appropriately.
Unlike relying solely on core visuals with limitations, our approach focuses on utilizing Power BI's native visuals to create a customized status tracking visual. Whether monitoring shipment stages, recruitment progress, or sales funnel advancement, this visual provides a universal solution.

