While the default slicers in Power BI, including Vertical list, Tile, and Dropdown styles, are quite limited in formatting, there are a few tricks you can use to make more out of the native slicers. In this blog post, we will dive into an innovative method for enhancing the style and usability of slicers. We will add checkmark signs alongside each field on the slicer. This approach effectively captures the user's attention, providing a clear distinction between selected and unselected fields. Additionally, It is eye-catching and makes your dashboard look more like an app. Also, this method adds a visually appealing hover effect to the slicer's overall appearance, making it truly ideal. Let’s explore the process of making these checkmark slicers:
1. Add a New Column Containing Checkmark Signs
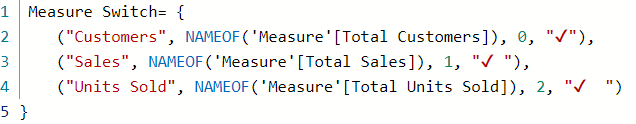
Whether the field of your slicer is from the data model itself or it is created as a field parameter, to use checkmark signs in a slicer, first we have to add a new column along to the field. Then, we have to add checkmarks (✓) as the values of the new column.
2. Make Checkmark Signs Unique
After creating the new column and adding checkmarks as values, we must make them unique for each field value, Because when we add the new column as a slicer, they will be all the same, and the slicer will show just one checkmark. To avoid that, we add extra space to checkmarks to make them unique, like this: "✓ ", "✓ ". Any checkmark should represent a distinctive field value in the column next to them.

3. Adjust the Settings of the Checkmark Slicer
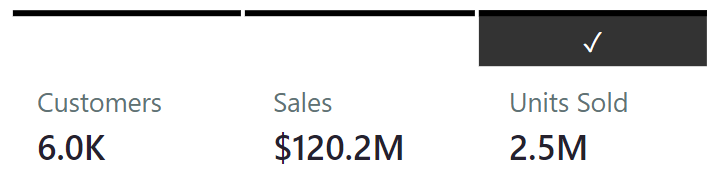
We need to edit the slicer's Style to be Tile. Additionally, if preferred, we can change the Selection to be Single select. In doing so, we will notice that one checkmark is highlighted, but the other not selected checkmarks are still visible. To resolve this, we must change the color of the slicer's values to white. This will hide the unselected checkmarks. Moreover, we can experiment with both the color and size of the slicer's border to enhance its visual appeal.

4. Add the Slicer Field as a New Card Visual along the Checkmark Slicer
By now, we have a professional looking slicer. However, we also need to know exactly what value has been selected. Therefore, we must add our field column (the initial column from which we want to create the slicer) as a new card visual next to the Checkmark Slicer. Then we have to edit the interaction of the checkmark slicer with the card visual to None. This way, all the field values will be shown along with checkmarks next to them. We will align the two visuals together so that we can easily identify which field value is selected by each checkmark.
Conclusion
The default slicer styles in Power BI are functional, but taking the time to customize and make them more appealing can greatly enhance the dashboard experience for your users. By creating a stunning checkmark slicer, you can add more style to your dashboard and make the selection of field values clearer for users. They can instantly identify which field has been selected.
How to Power BI
Watch it here
Launch Power BI Reportsthat bring your organization
to a fully data-driven world.
to a fully data-driven world.
Power BI Launch
After years of consulting we have developed a holistic solution for launching Power BI Reports in 3 months. From key metrics discovery, to report design, implementation and stakeholders' training. We know precisely how to launch Power BI reports that drive organizations' growth.
Power BI Trainings
Our technical trainings for report developers instantly upskill your teams. Alongside our unique business user trainings the improvement in overall organizational data literacy becomes immediately actionable.

Take your Skills to the Next Level
Power BI Trainings
__________
ULTIMATE TEAM TRAINING
__________
This training takes Power BI developers team from beginner/intermediate to advanced. End result? A team that can build reports from data import, transformation, through model, DAX calculations to out-of-the-box visuals.
for teams
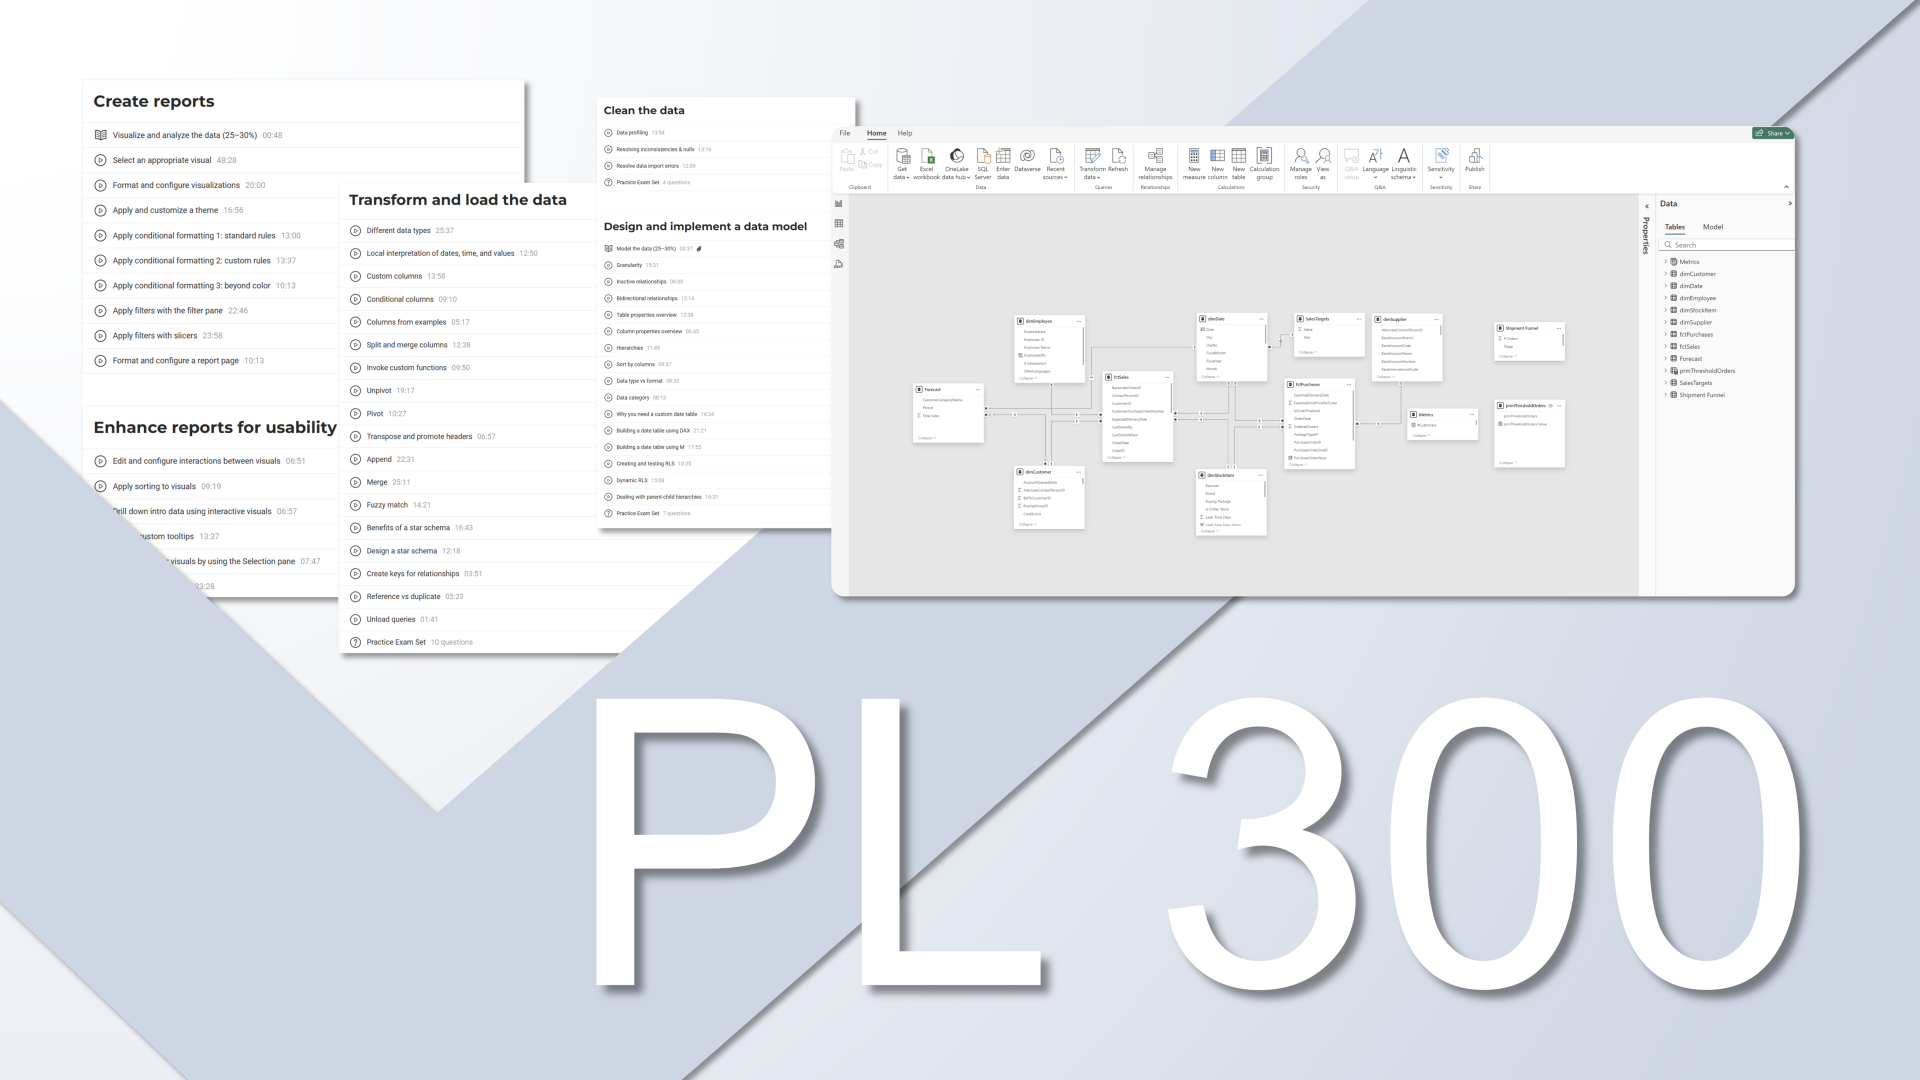
DATA ANALYST
PL-300
__________
Everything you need to build Power BI reports and gain real-world skills. Whether you're looking to improve reporting skills or advance career with passing PL 300, our training prepares you for success at every step.
self-paced