Enhancing Bar Charts Clarity: Improved Labels in Power BI

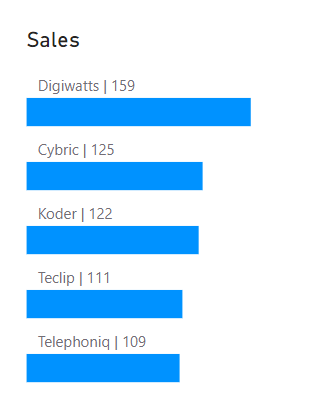
Bar charts, widely used for their simplicity, encounter a common challenge when handling lengthy item names within limited space. In this tutorial, we'll delve into a straightforward solution, transforming your charts into visually striking and informative assets. Here is a quick step-by-step guide of how to implement bar chart labels above each bar.
Oct 2 / datatraining
Addressing Bar Charts Label Issues:
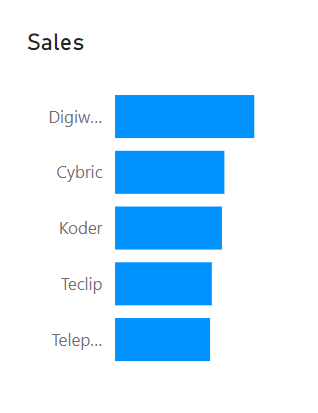
Starting with a normal bar chart, the problem becomes evident – insufficient space for lengthy labels on the y-axis. Adjusting font size or expanding the chart's width comes with downsides, making the labels smaller or less readable. Let's explore a more effective solution.
Creating Label Space:
To address the challenge of limited label space, we opted for a clustered bar chart visual. We introduce a new measure called 'Labels Placeholder,' initially set to zero. This measure is strategically placed above the actual measure, creating space without compromising visual appeal.

Formatting for Clarity:
The initial appearance may seem chaotic, but with a few formatting adjustments, such as turning off the legend, turning off labels for the y-axis, and adjusting the sorting by the main measure, the chart begins to take shape.

Displaying Labels Above Bars:
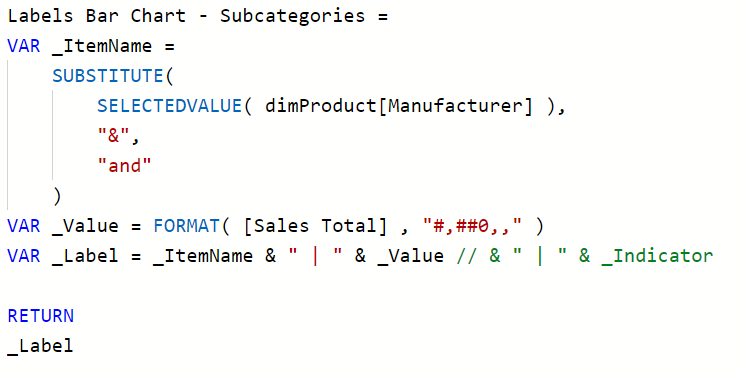
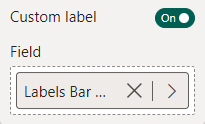
By turning on data labels and using custom labels of the label placeholder measure, we link them to a measure returning the desired text (e.g., product subcategory names). This transforms the zeros of that dummy measure into informative labels, providing clarity without compromising the chart's aesthetics.


Fixing Bar Spacing:
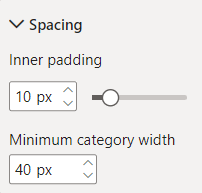
Sometimes, the labels above the bars can overlap with the bars, making it unclear. To solve this, adjust the spacing between the bars by playing with inner padding or minimum category width.


Conclusion:
By following these straightforward steps, you not only enhance the clarity of your Power BI bar charts but also open the door to more dynamic and informative visualizations. The improved labels not only boost readability but also add a polished and professional touch to your reports. As you apply these techniques, don't hesitate to experiment with variations in your own projects. 

How to Power BI

Watch it here

Launch Power BI Reports
that bring your organization
to a fully 
data-driven world.

Power BI Launch

After years of consulting we have developed a holistic solution for launching Power BI Reports in 3 months. From key metrics discovery, to report design, implementation and stakeholders' training. We know precisely how to launch Power BI reports that drive organizations' growth.

Power BI Trainings

Our technical trainings for report developers instantly upskill your teams. Alongside our unique business user trainings the improvement in overall organizational data literacy becomes immediately actionable.