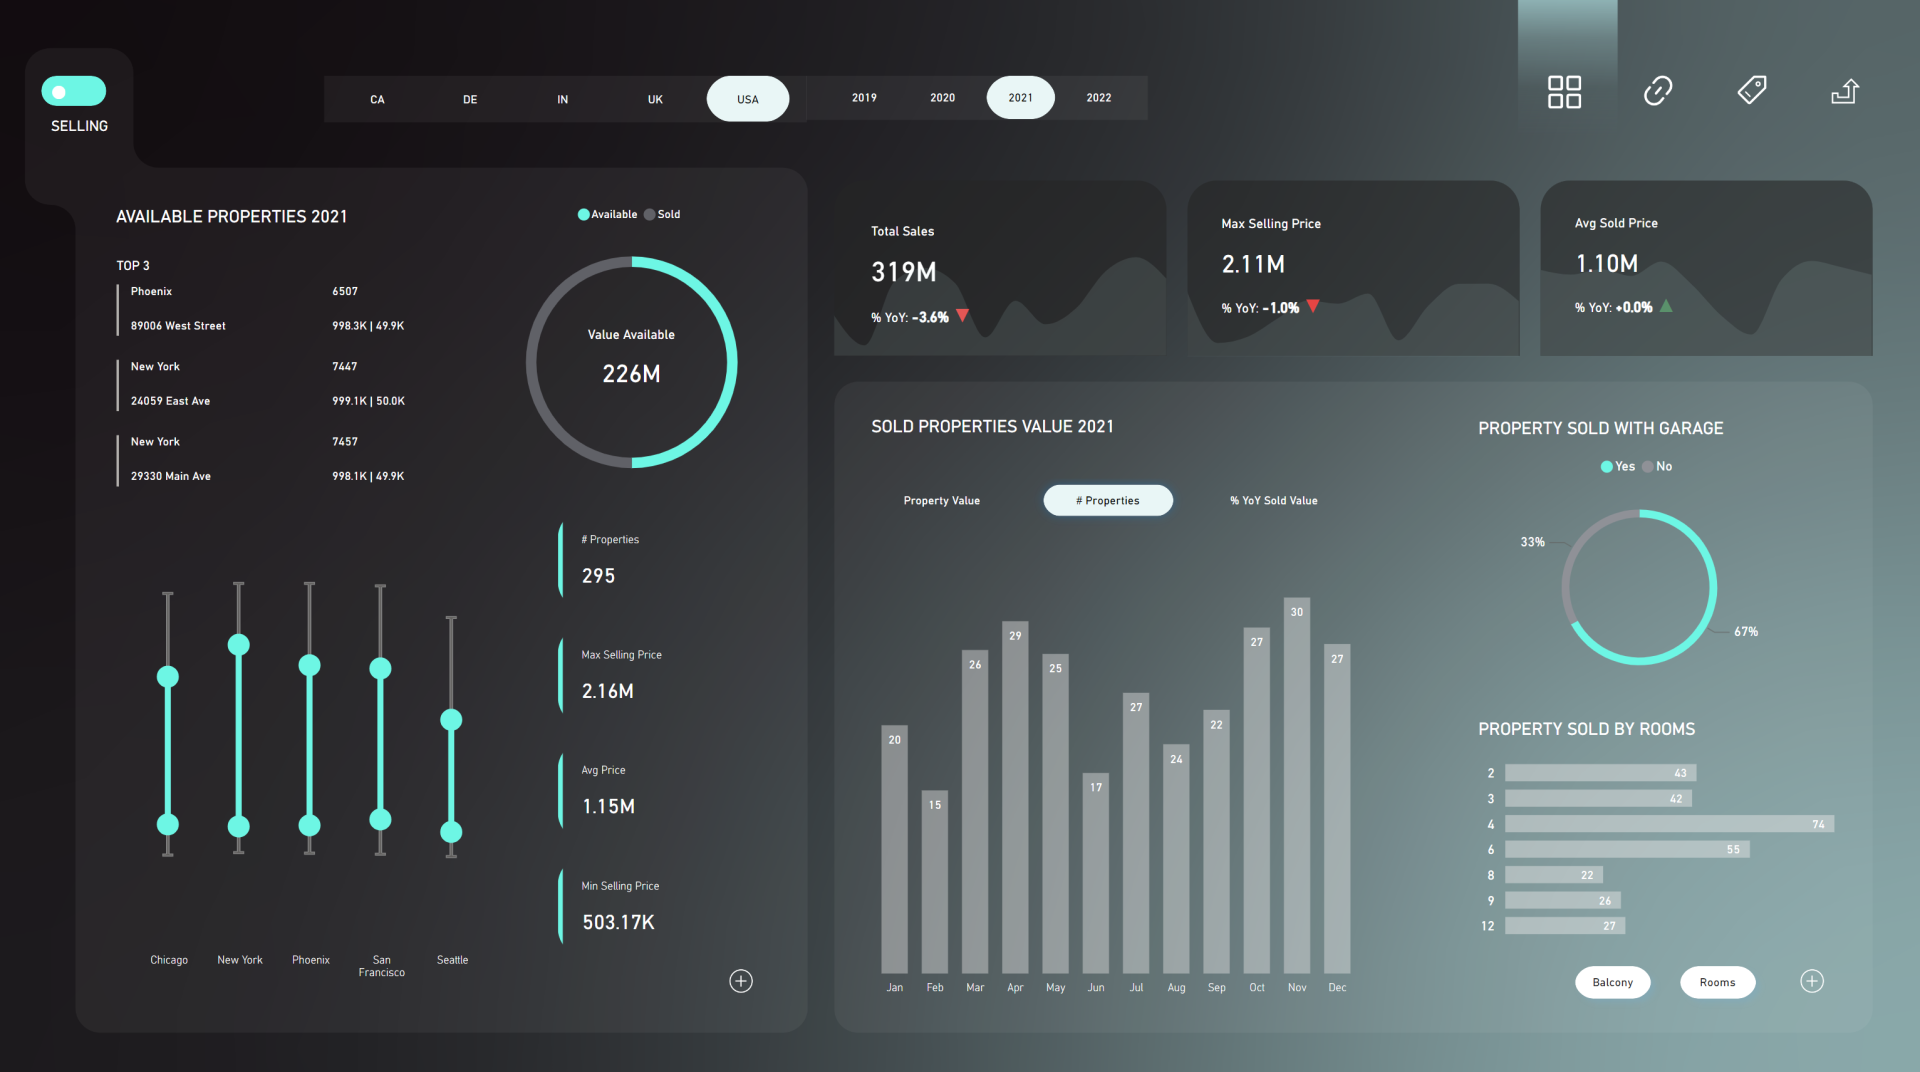
While Power BI allows you to create placeholders and shapes for report design, it's essential to recognize its limitations as a full-fledged design tool. Incorporating an excessive number of shapes in Power BI can lead to performance issues and a cluttered report page, making it challenging to locate charts and buttons. To achieve stunning report backgrounds efficiently, consider using a design tool like PowerPoint. By crafting your background in PowerPoint and then importing it as an image into Power BI, you harness the best of both worlds—efficiency and visual appeal. This approach empowers you to create visually captivating reports without compromising performance or the overall design integrity. Unlock the potential of your Power BI reports with this smart and visually compelling method for crafting remarkable backgrounds that captivate your audience:
1- Create placeholders for your report
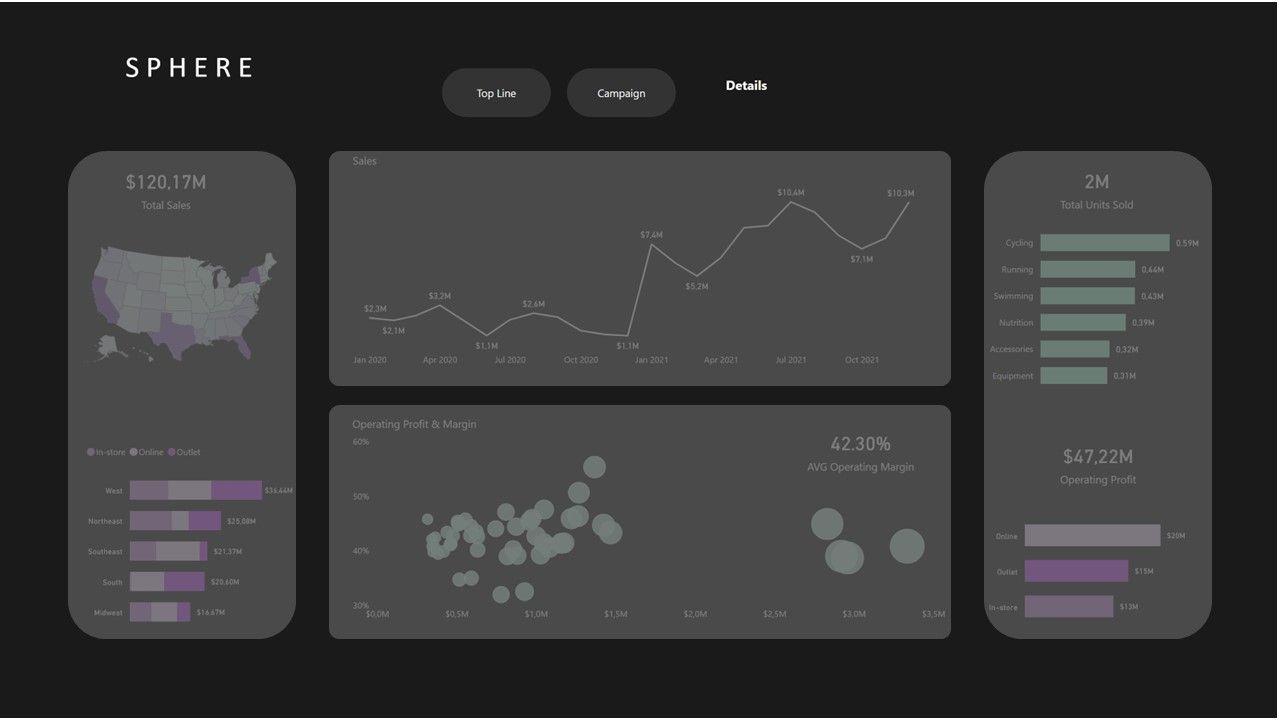
Take a screenshot of your Power BI report and paste it into Power Point. Ensure that the Power BI report and PowerPoint slide have identical dimensions to maintain the accuracy of your placeholders. Start creating placeholders for your report. You can make the placeholders a little bit transparent to see the visuals behind it exactly fit with the placeholder.
2- Find high quality background images
Why spend hours creating a background image from scratch when an entire realm of high-quality options awaits you? For instance, Unsplash offers free images, while Shutterstock provides paid options for premium background images. Feel free to get inspired by these professionally crafted backgrounds or directly incorporate them into your Power BI projects. With this incredible resource at your fingertips, creating visually captivating reports has never been easier.
Why spend hours creating a background image from scratch when an entire realm of high-quality options awaits you? For instance, Unsplash offers free images, while Shutterstock provides paid options for premium background images. Feel free to get inspired by these professionally crafted backgrounds or directly incorporate them into your Power BI projects. With this incredible resource at your fingertips, creating visually captivating reports has never been easier.
3- Edit the image you picked
Now that you have your chosen image in hand, it's time to enhance the background design of your Power BI report. Leverage the powerful editing tools within PowerPoint to tailor the image to your exact requirements. Some essential and versatile tools at your disposal include Crop, which allows you to focus on specific elements of the image, and the ability to add various shapes, rotation, flip horizontally or vertically, and apply captivating picture effects. With these editing tools at your fingertips, you have the creative freedom to transform the selected image into a truly desirable background for your Power BI report.
Now that you have your chosen image in hand, it's time to enhance the background design of your Power BI report. Leverage the powerful editing tools within PowerPoint to tailor the image to your exact requirements. Some essential and versatile tools at your disposal include Crop, which allows you to focus on specific elements of the image, and the ability to add various shapes, rotation, flip horizontally or vertically, and apply captivating picture effects. With these editing tools at your fingertips, you have the creative freedom to transform the selected image into a truly desirable background for your Power BI report.

4: Integrate Your background design into Power BI
With your background design now finished, it's time to seamlessly integrate it into Power BI. Export the report as an image from PowerPoint, and then set it as the background for your Power BI report. While doing so, be prepared to make minor adjustments to ensure your visuals align flawlessly with the newly designed background.
With your background design now finished, it's time to seamlessly integrate it into Power BI. Export the report as an image from PowerPoint, and then set it as the background for your Power BI report. While doing so, be prepared to make minor adjustments to ensure your visuals align flawlessly with the newly designed background.

5. Conclusion
In conclusion, by using a dedicated design tool, you can create placeholders that set the stage for your report's visual journey. Additionally, the wealth of high-quality background images available online presents a treasure trove of possibilities. Tailor these images to suit your vision, elevating your report's aesthetics to new heights. Also, you have to remember, to achieve the best results, tackle the design aspect after constructing your Power BI report.
How to Power BI
Watch it here
Launch Power BI Reportsthat bring your organization
to a fully data-driven world.
to a fully data-driven world.
Power BI Launch
After years of consulting we have developed a holistic solution for launching Power BI Reports in 3 months. From key metrics discovery, to report design, implementation and stakeholders' training. We know precisely how to launch Power BI reports that drive organizations' growth.
Power BI Trainings
Our technical trainings for report developers instantly upskill your teams. Alongside our unique business user trainings the improvement in overall organizational data literacy becomes immediately actionable.

Take your Skills to the Next Level
Power BI Trainings
__________
ULTIMATE TEAM TRAINING
__________
This training takes Power BI developers team from beginner/intermediate to advanced. End result? A team that can build reports from data import, transformation, through model, DAX calculations to out-of-the-box visuals.
for teams
DATA ANALYST
PL-300
__________
Everything you need to build Power BI reports and gain real-world skills. Whether you're looking to improve reporting skills or advance career with passing PL 300, our training prepares you for success at every step.
self-paced


