1. The new Power Query editor (Preview)
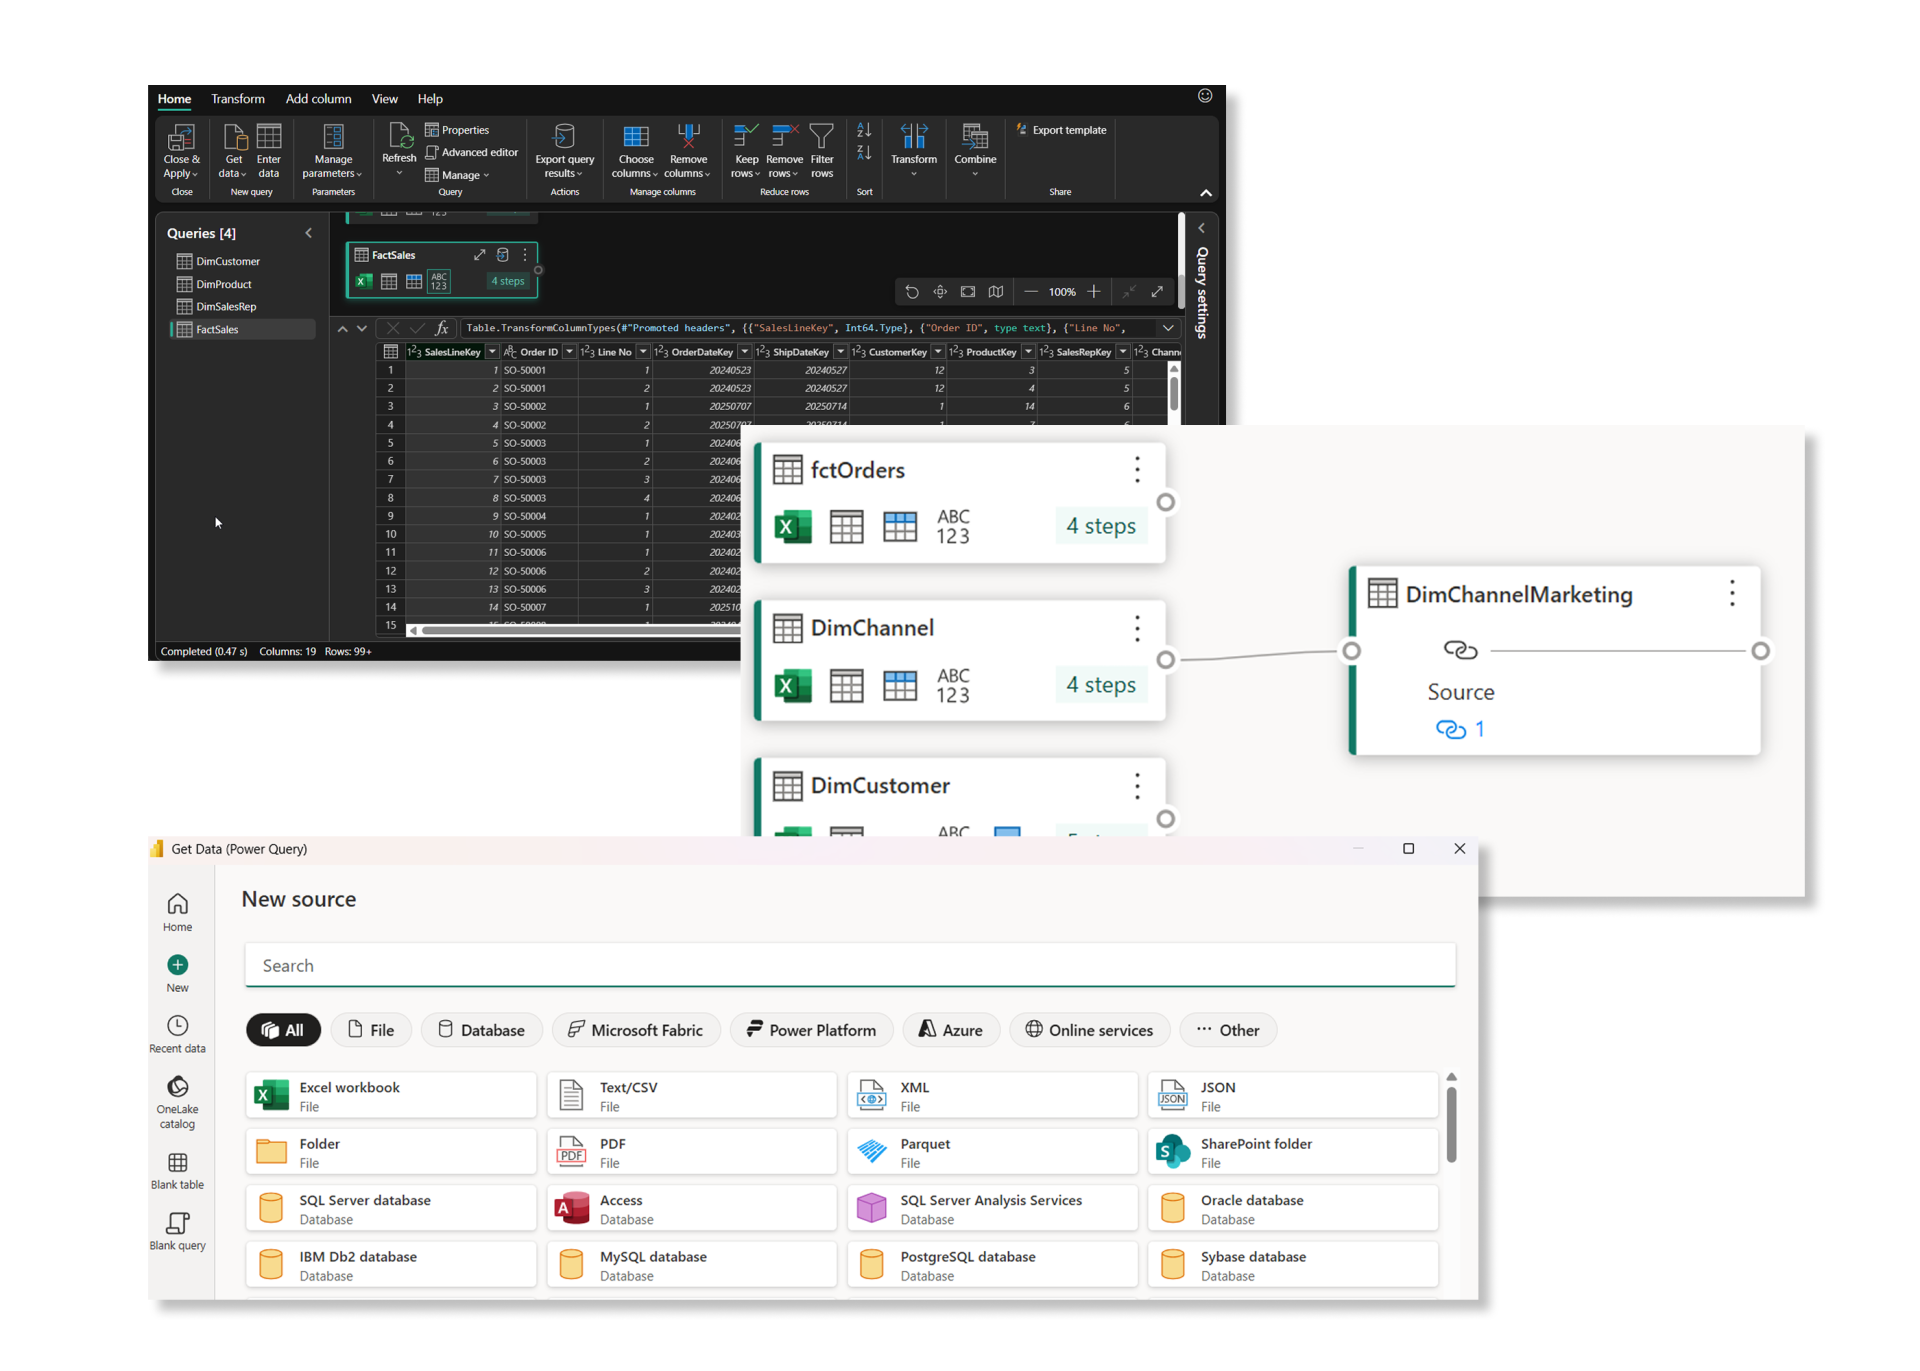
This is honestly my favorite change in a long time. Dataflow Gen2 kept getting the nice things, and Desktop users got to watch. That ended now :)
How to turn it on
It's a preview, so it's off by default. Go to File > Options and settings > Options > Preview features, tick the New Power Query experience, and restart Power BI Desktop.

Here's what you get
- Modern Get Data. The searchable, categorized connector picker from Dataflow Gen2 is now in Desktop.
- Dark theme. Dark mode now covers the WHOLE editor, including the preview grid and the dialogs.
- Folding visibility. Step indicators show which steps fold and exactly where folding breaks, plus a query plan view.
- Diagram view. A visual map of how your queries reference and merge with each other.
- Features that used to be web-only. Rank column, cluster values, schema view and query script view are now in Desktop, along with upgrades to common transformations.
- Power Query templates. You can export a template from Desktop and import it into Dataflow Gen2 with your exact queries, steps and structure.
See video here.
2. The Design ribbon (GA)
Report styling now has its own tab. The new Design ribbon puts the tools you use to style a whole report in one place, instead of spreading them across View and the Format pane. This used to be so confusing!
From the Design ribbon you can:
- Apply a built-in theme or your organization's theme
- Set report-wide defaults in the Theme pane
- Import a theme file or download the current one
- Open Page size, Page background and Wallpaper settings for the current page
See video here.

3. Format pane headers stay visible as you scroll (GA)
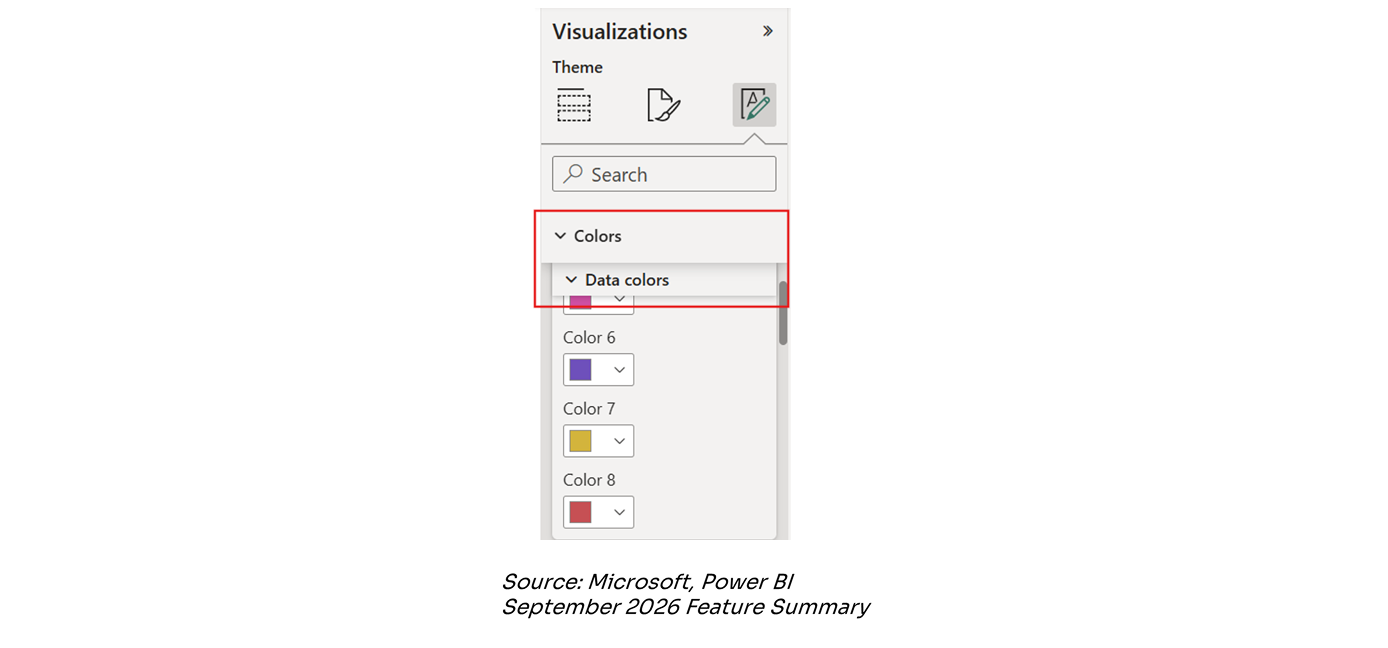
Section headers in the Format pane now stay pinned to the top while you scroll through their settings. So you always know which section you're in, even in long lists like color controls.
This may sound like a small thing but anyone who has scrolled through the colors of a matrix, lost track, and started changing the wrong thing (sic!) knows exactly what I mean.
One problem (?): this feature isn't showing up on my end yet, even though Microsoft lists it as GA. Rollouts sometimes arrive in waves, so it still might. Is it working for you? Let me know, I'm curious whether it's version-related or region-related.
4. Slider color options (GA)
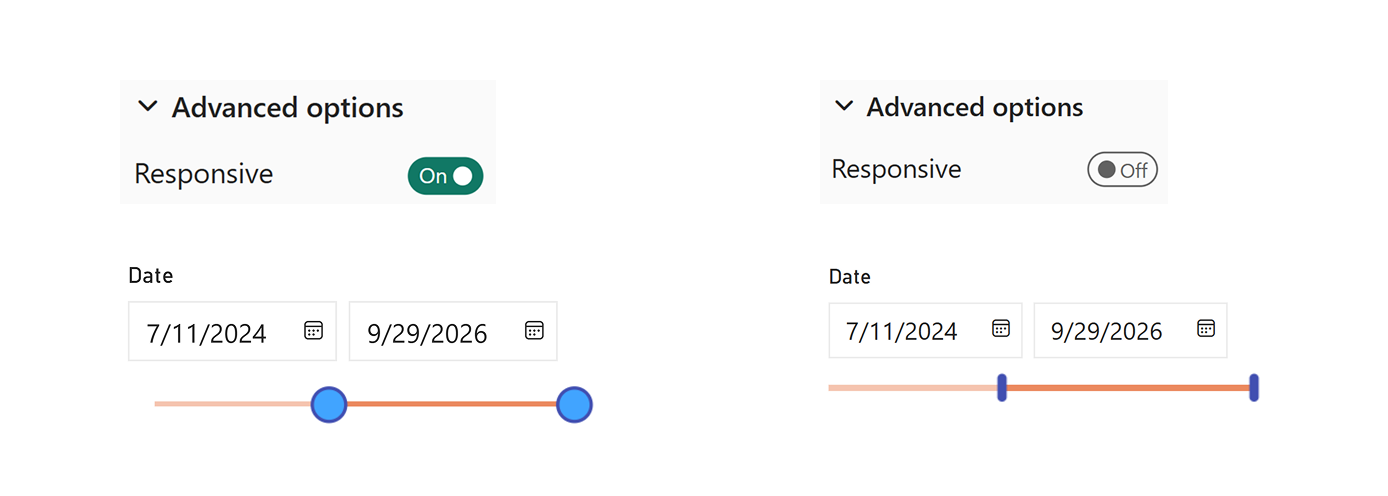
The slider on the slicer finally has its own color options in the Format pane. You can set separate colors for the handles, the range and the track. This is big! Until now the range slider was one of those visuals that always looked slightly off-brand, no matter how carefully you set up the theme.
Now it can actually match the rest of the page.
Keep in mind: The handle shape depends on your layout setting. With Responsive layout on, the handles are circles. With it off, they're rectangular bars.
5. Axis initial scroll (GA)
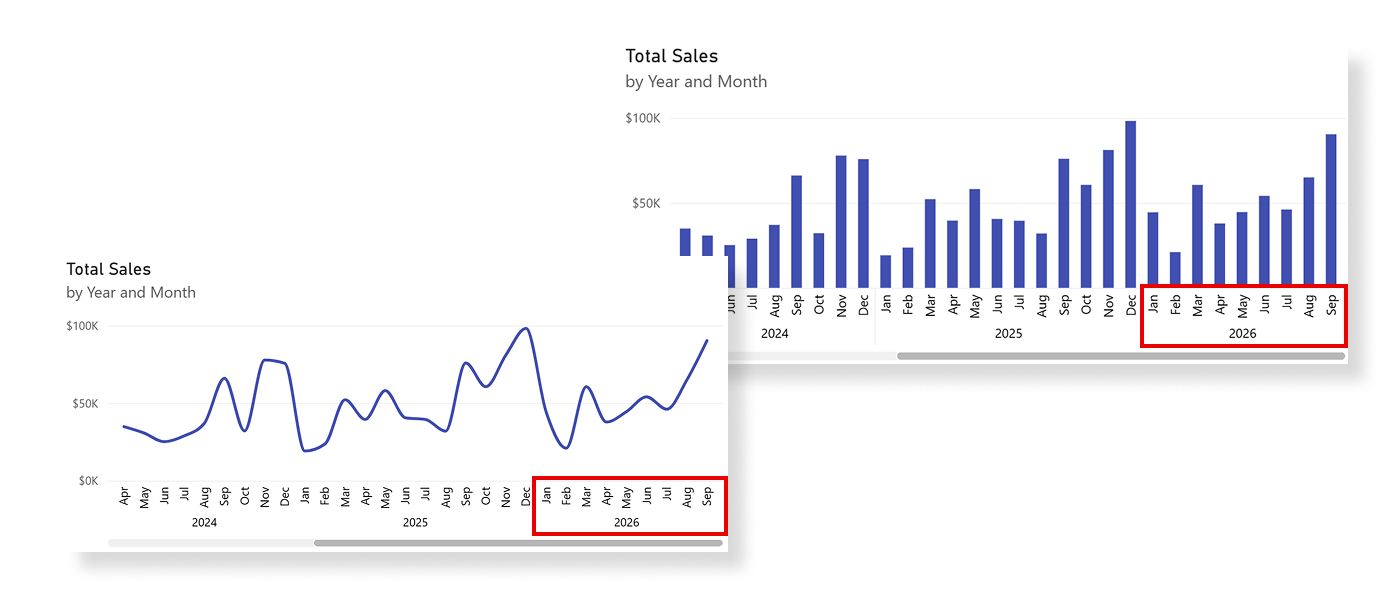
Charts with a scrollbar can now open on the most recent data instead of the oldest by default. In the axis Layout section, set Initial scroll position to End. Now the chart opens where people actually want to look.
It works on these visuals:
- Stacked, clustered and 100% stacked bar and column charts
- Line, area, stacked area and 100% stacked area charts
- Line and stacked column, and line and clustered column charts
- Ribbon and waterfall charts
- Scatter charts with a categorical X-axis
A short video here.
6. Power BI agentic development is now GA
Power BI Agentic Experiences are now Generally Available. That was quick: Agent Skills for Power BI were only announced as a preview at Microsoft Build in June!
You hand a task to an agent, review what it built, and refine it. That works for new reports and, more usefully, for the existing ones most of us spend our days fixing and extending.
What makes it work is context and tools. Skills teach the agent your team's modeling and reporting conventions, and you can use Microsoft's
skills-for-fabric or write your own.
The
powerbi-authoring plugin, the Power BI Authoring MCP server and the Desktop Bridge let the agent edit models and reports, reload its changes and check its own work. It can even validate reports in a headless browser, which is good news for Mac users.
My take: treat the agent's output like a junior developer's pull request and review every measure and relationship. To try it, save an existing report as a PBIP project and give the agent one small, clear task.
So that's my hot take on the September 2026 Power BI update.
Hope you like it!
Try these features in your own reports and let me know how they work for you. I'm curious what you think, and even more curious to see how you end up using them.