This guide shows you how to create an interactive map that filters by distance, using a selected city and a dynamic radius slider.
Step 1: Prepare Your Data
You’ll need two tables:
- Stores Table: Contains shop name, latitude, and longitude.
- Cities Table: Contains city names and their coordinates.
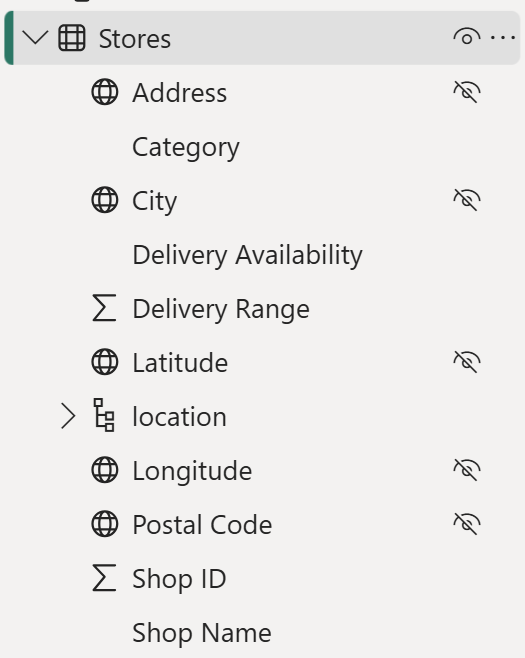
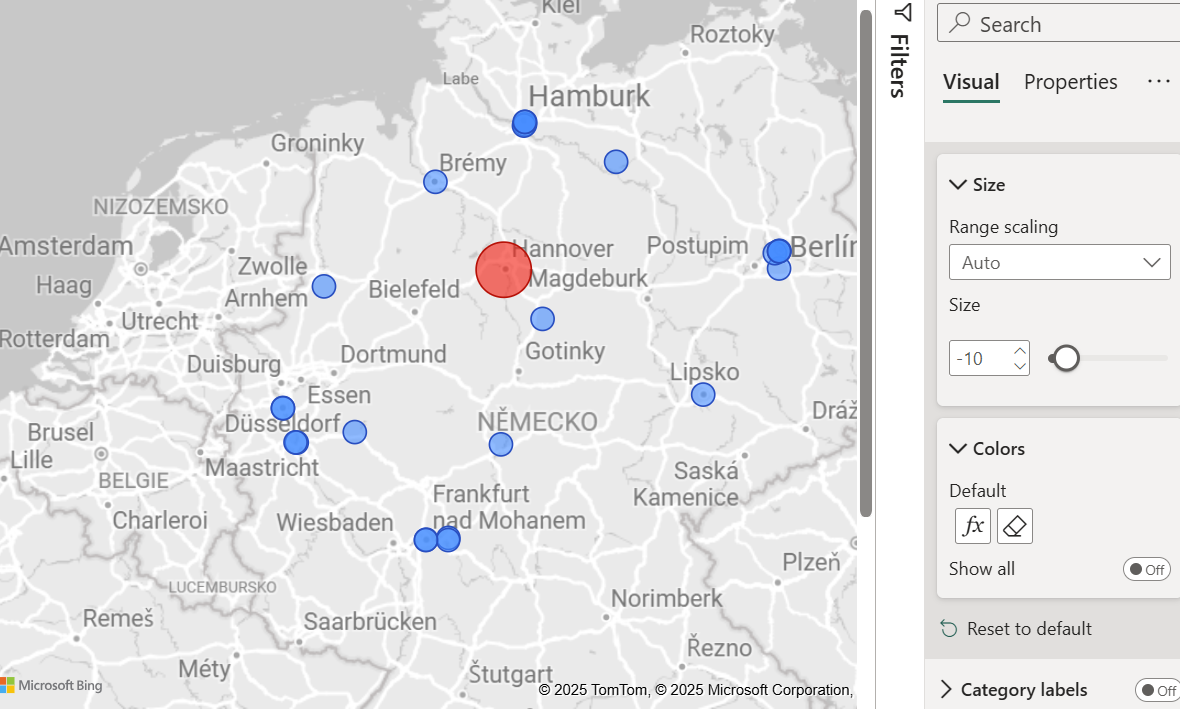
Drag Latitude and Longitude from the Stores table to a standard Power BI map. Set the style to grayscale and increase the bubble size to improve visibility.
Step 2: Show Selected City on the Map
The selected city comes from the Cities table, which is disconnected from the Stores table.
To show it on the map:
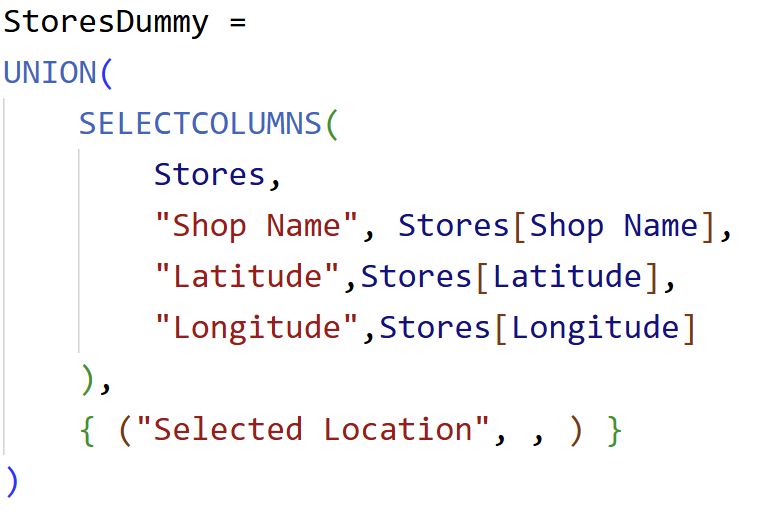
Create a new table combining the Stores table with a placeholder row: Stores Dummy
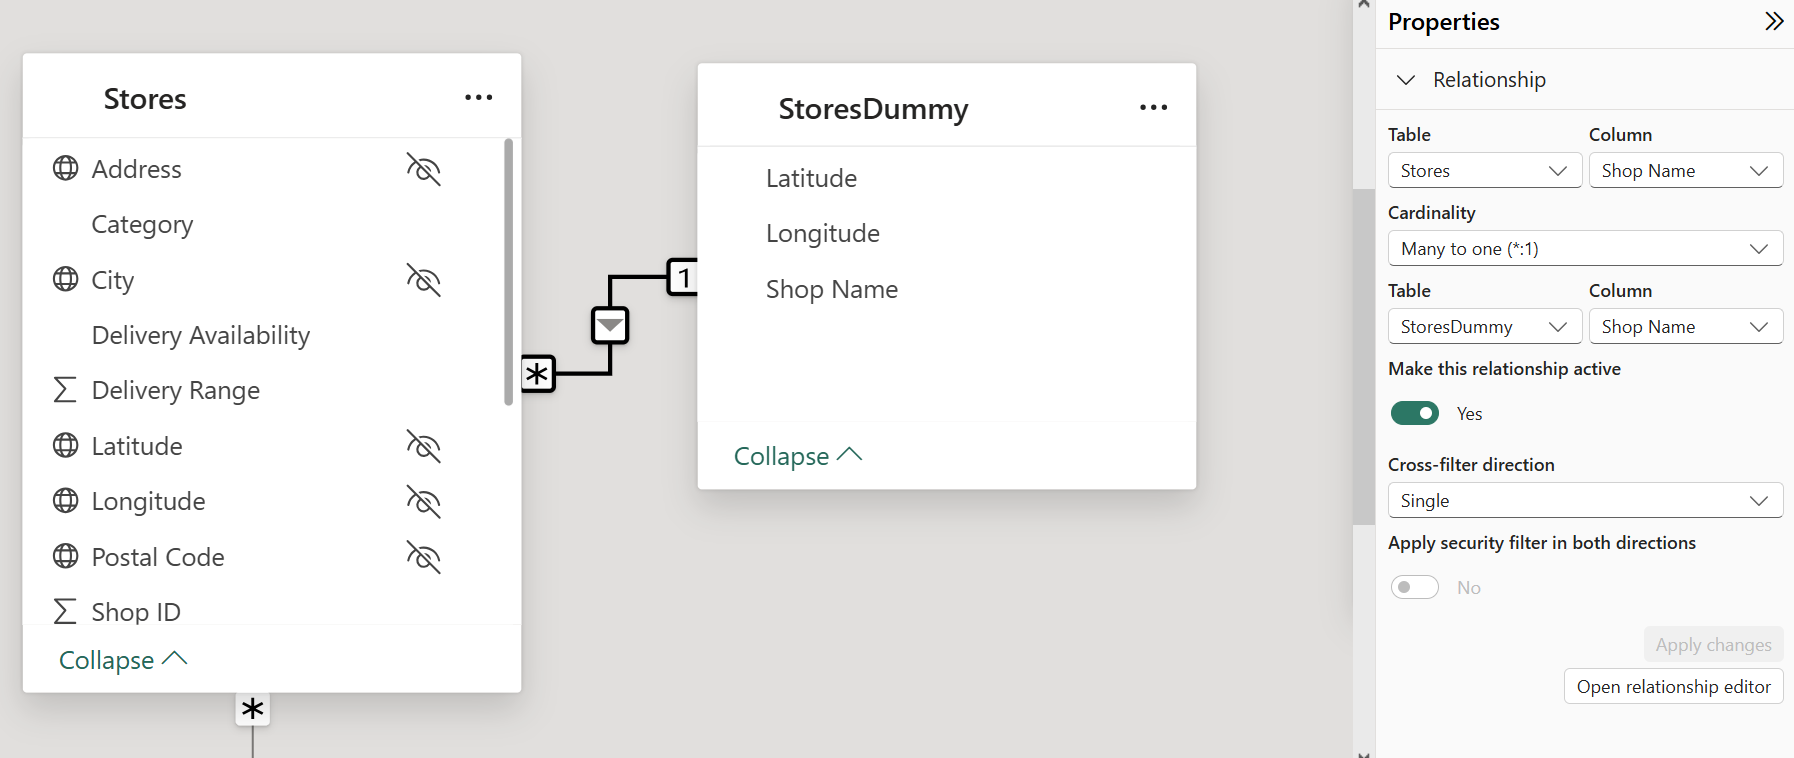
- Create a relationship:
Connect Shop Name from Stores Dummy to Stores.
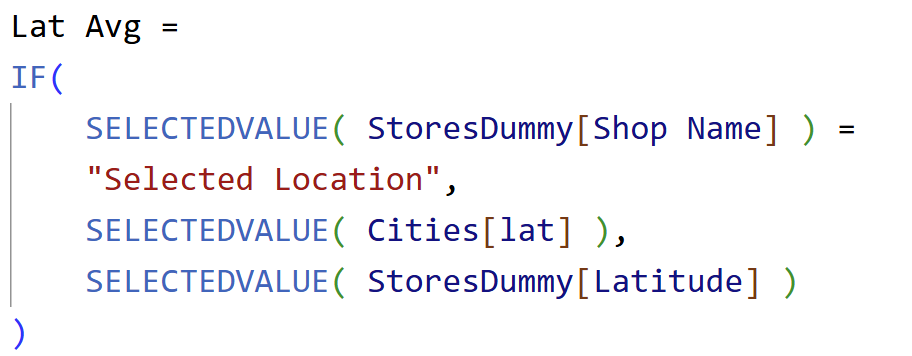
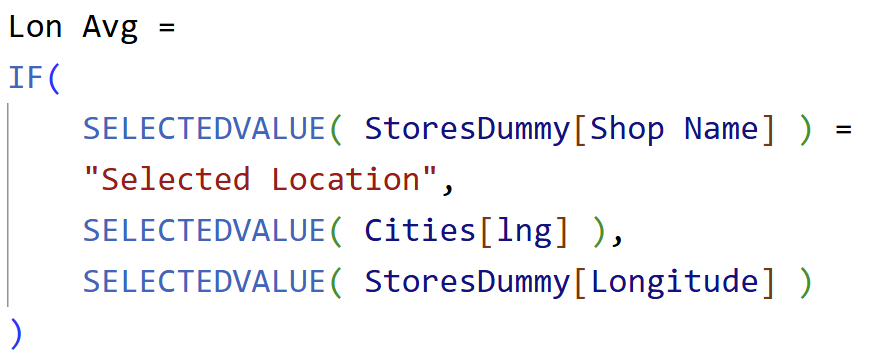
Step 3: Add Dynamic Measures for CoordinatesTo display the correct coordinates (store vs. selected city), create two measures.
Add these measures to the Latitude and Longitude fields of the map.
Plus add the Shop Name column on the map location.
Step 4: Highlight the Selected City
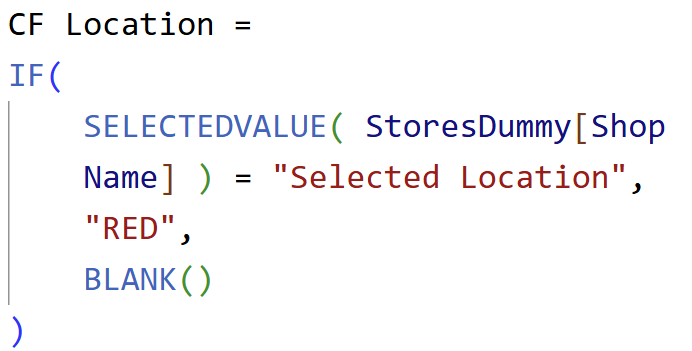
Create a measure to highlight the selected city and Apply this measure as bubble color using conditional formatting.
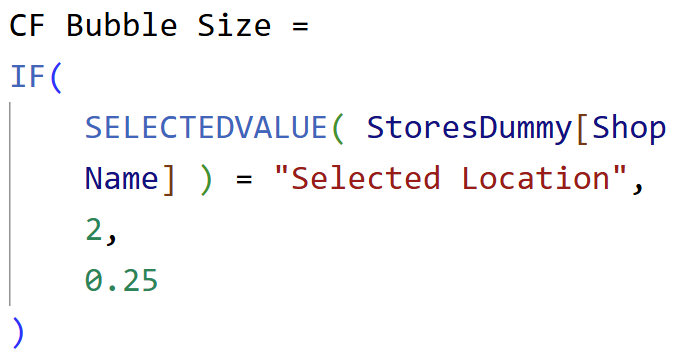
Create another measure determining the bubble size. Play around with the scaling of the bubbles.
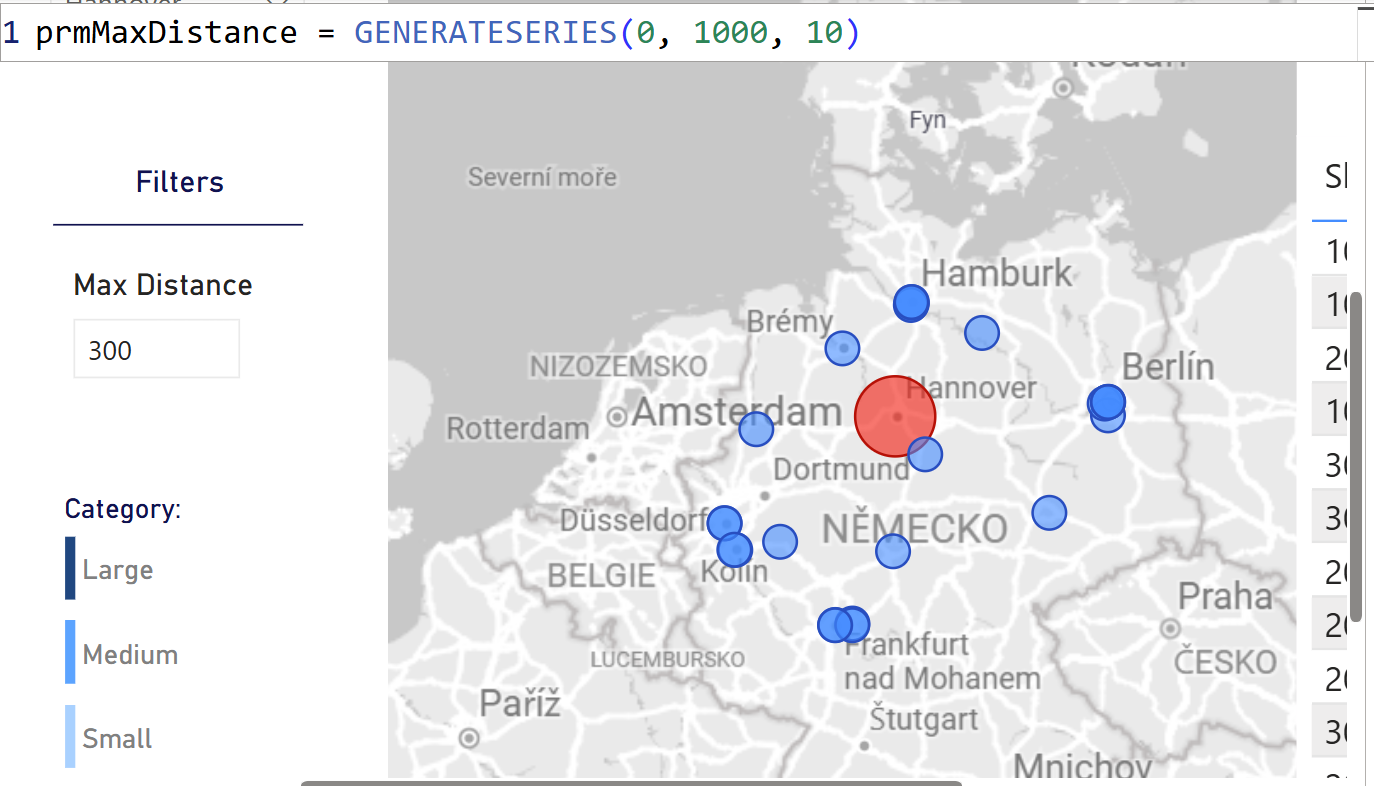
Step 5: Add a Distance Parameter
Go to
Modeling > New Parameter > Numeric Range:- Name: MaxDistance
- Min: 0, Max: 1000, Step: 10, Default: 250
Add the slicer to your page.
Step 5: Calculate Distance Between Locations
Use the
Haversine formula in DAX to compute the distance:
Distance (km) =
-- Haversine Distance
VAR _multiplier = PI()/180
VAR _radius = 6371 //Radius Earth
VAR _latSelected = SELECTEDVALUE(Cities[lat])
VAR _lonSelected = SELECTEDVALUE(Cities[lng])
VAR _latStore = SELECTEDVALUE( Stores[Latitude] )
VAR _longStore = SELECTEDVALUE (Stores[Longitude] )
VAR _latDiff = (_latStore-_latSelected) * _multiplier
VAR _lonDiff = (_longStore-_lonSelected) * _multiplier
VAR _step1 =
SIN(_latDiff/2)^2 +
COS(_latStore * _multiplier) *
COS(_latSelected * _multiplier) *
SIN(_lonDiff/2)^2
VAR _step2 = 2 * ATAN(DIVIDE(SQRT(_step1),SQRT(1-_step1)))
VAR _distance = _radius * _step2
RETURN
IF(
SELECTEDVALUE( StoresDummy[Shop Name] ) <> "Selected Location",
_distance
)
// Copy Haversine formula
here using coordinates from Cities and Stores
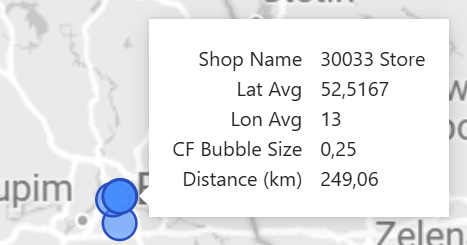
Hovering over a bubble shows the distance in the tooltip.
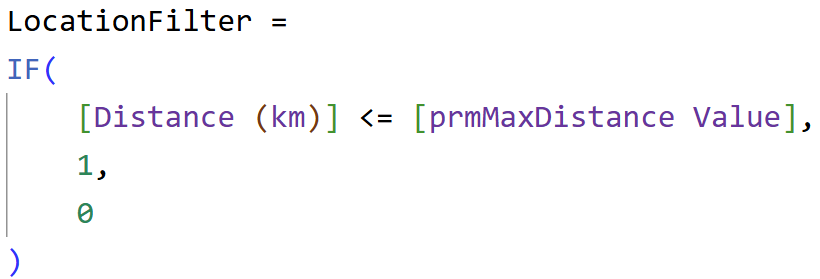
Step 7: Filter Locations Based on Distance
Create a visual-level filter:
Apply it to the map so only locations within the distance are visible.
Make sure to exclude the selected city itself by updating the measure to avoid filtering it out.
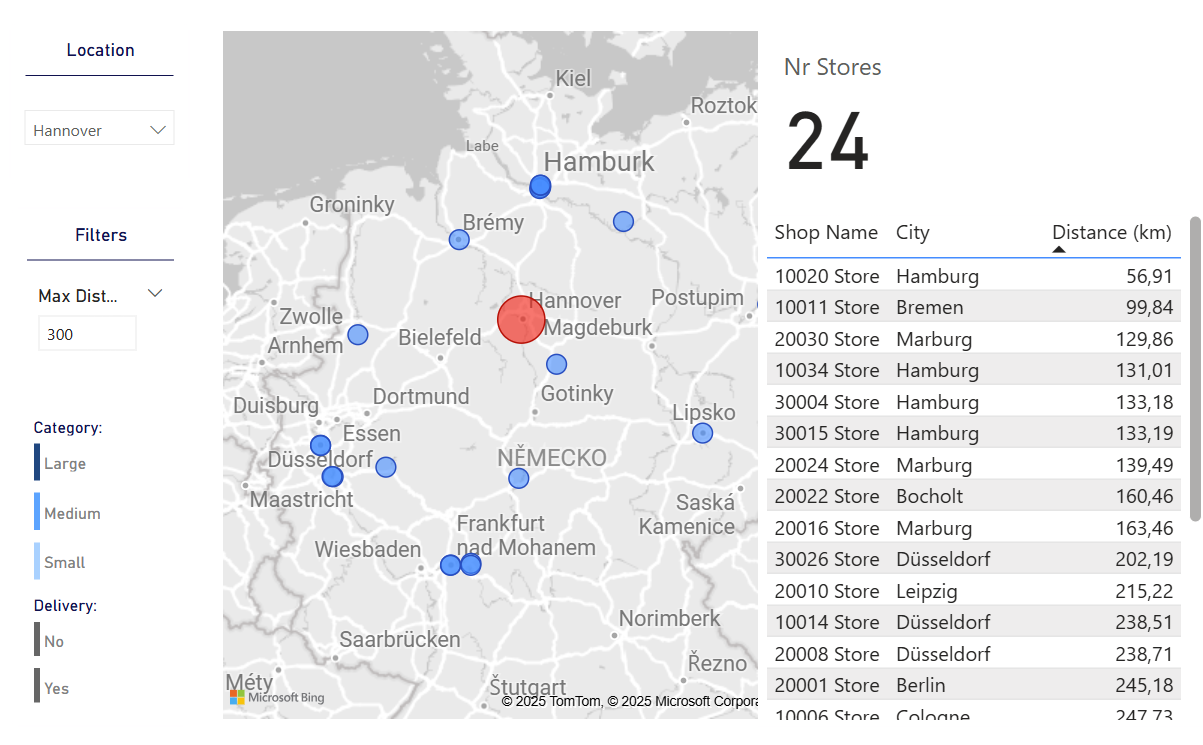
Step 8: Add Supporting Visuals (Table & Card)Add:
- A table showing visible stores, cities, and distances.
- A card that shows how many stores are within range.
Apply the same filter measure to both visuals.
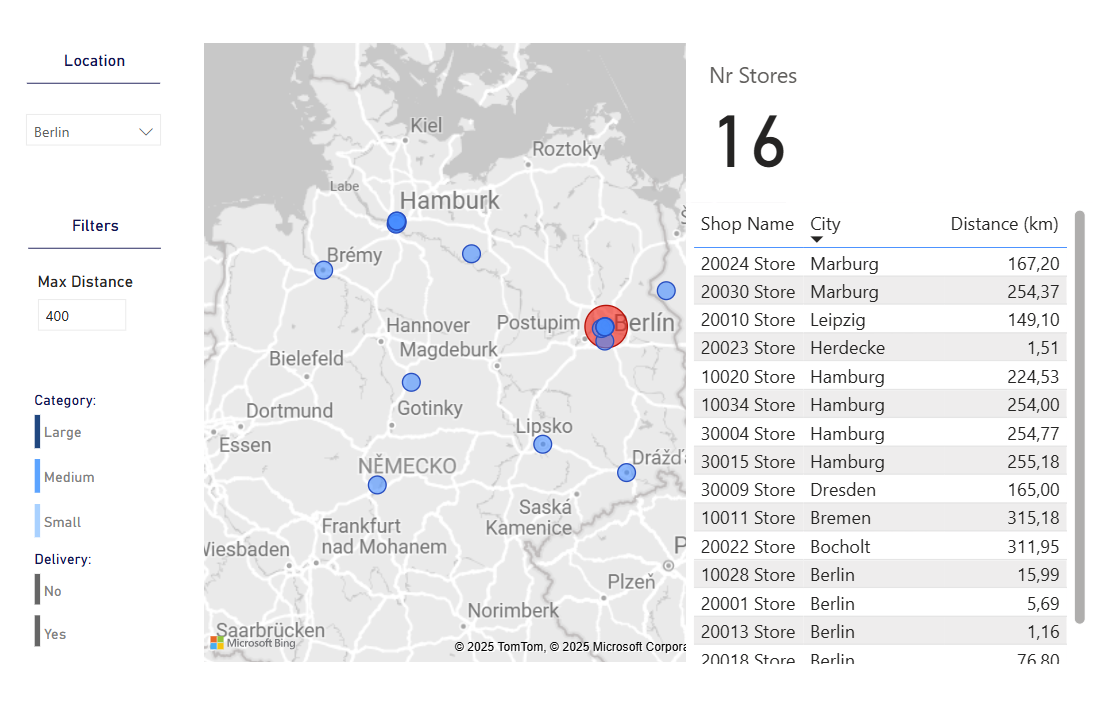
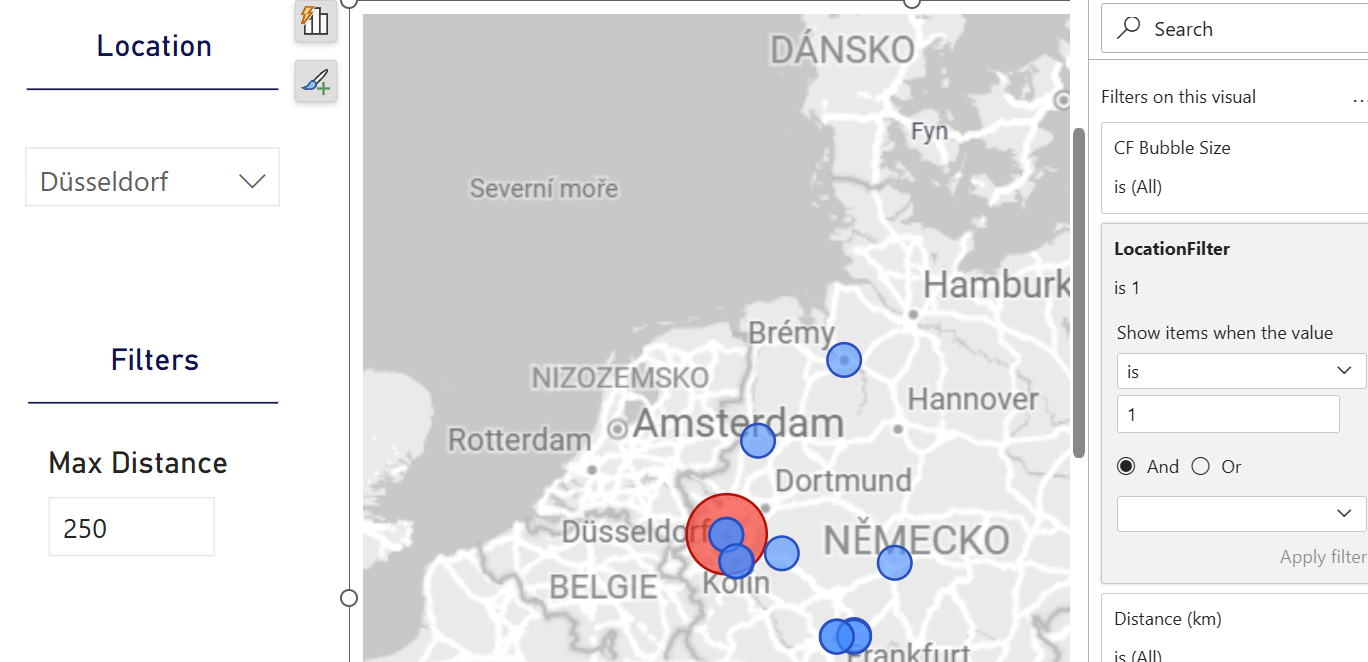
Final Result
Change the selected city or adjust the distance slider - the map updates instantly to show only the relevant locations.
Conclusion
This setup turns a static map into a fully interactive store locator or region-based analyzer. Whether you're building for logistics, retail planning, or regional performance, this is an incredibly useful technique.
Hope you like it!
Give it a try and see how it works for you! I’d love to hear what you think or see how you use this trick in your own reports.