Getting Started with the New Card VisualMake sure you're using the March 2025 version or later. You’ll need the updated
Card (new) visual to follow this tutorial.
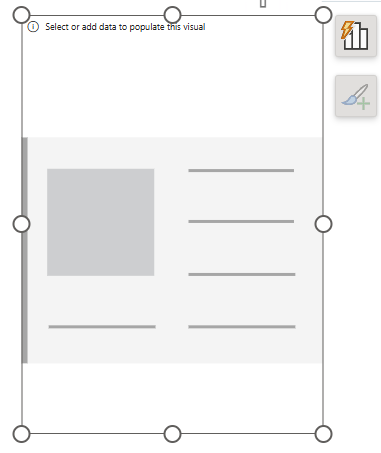
Step 1: Add the Card Visual- Start by inserting a new Card visual from the visual pane.
- Resize and place it appropriately on your report page.
Step 2: Set Up the Data Context (e.g., Patient Info)This tutorial uses patient data as an example. You can replace it with sales, product, or any entity-specific KPIs.
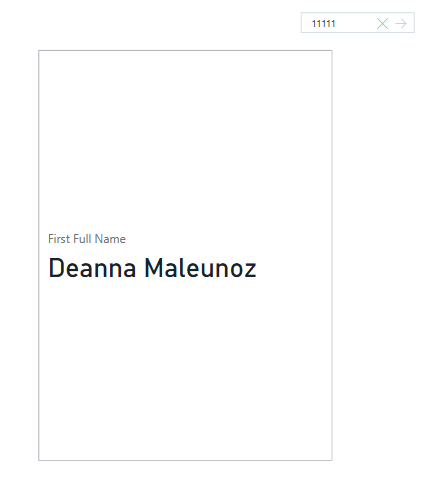
- Add a slicer to filter patient ID.
- Use the new Text Slicer (or any other slicer type).
- Bind it to the Patient ID field.
- Test by entering an ID (e.g., 11000), and verify the correct data shows in the card.
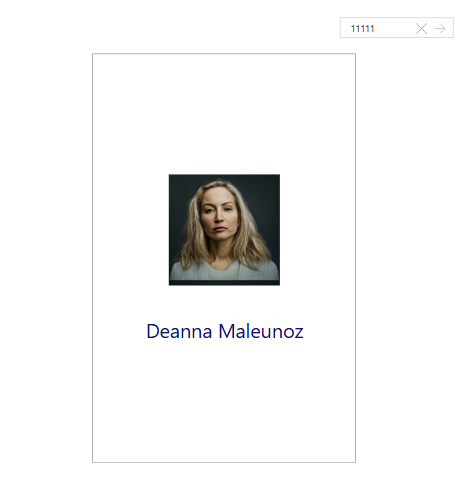
Step 3: Add an Image Dynamically- In the Images section of the card formatting pane, enable the image.
- Select Field value and bind it to a measure returning a patient-specific image URL.
- Adjust placement to appear above or below the text.
- Set image size (e.g., 150px) and center it.
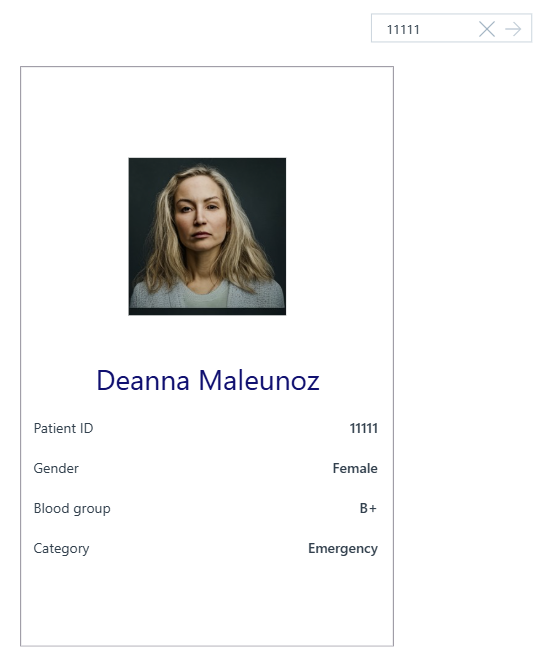
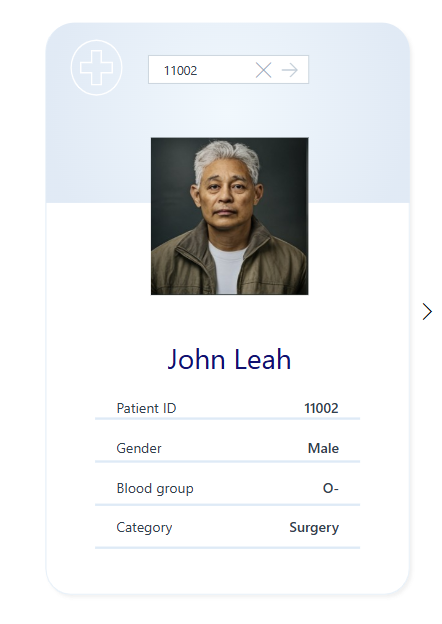
Step 4: Add Extra Patient Details Using Reference Labels1. Under Reference labels, select the same data series.
2. Add measures like:
- Patient ID
- Gender
- Blood Group
- Category
3. Style your labels:
- Change layout to “Tab” view.
- Use custom padding (e.g., 70px on left/right).
- Adjust font size, weight (e.g., Semi Bold), spacing (e.g., 20px between items).
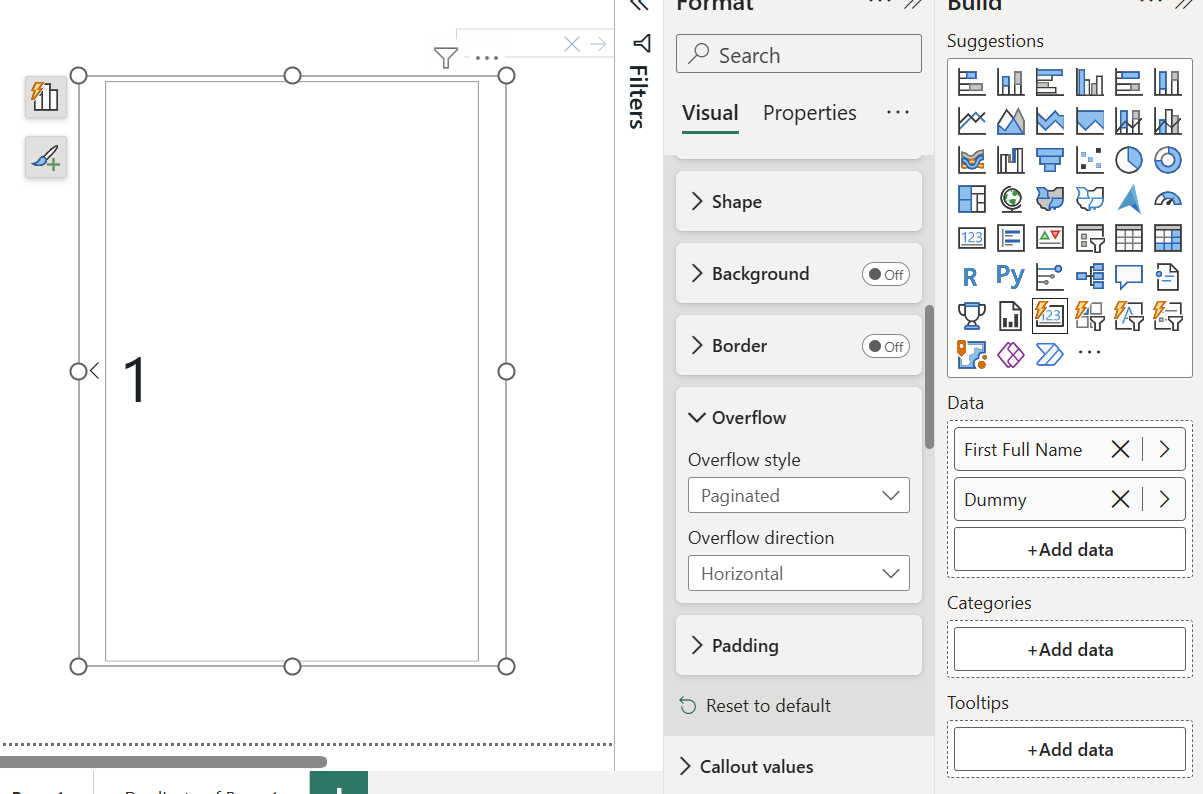
Step 5: Make It Flippable
To enable flipping:
- Add a dummy measure (e.g., one that returns 1).
- Set the card’s overflow to Paginated.
- Now, you'll see arrows that let users flip between two pages - front and back.
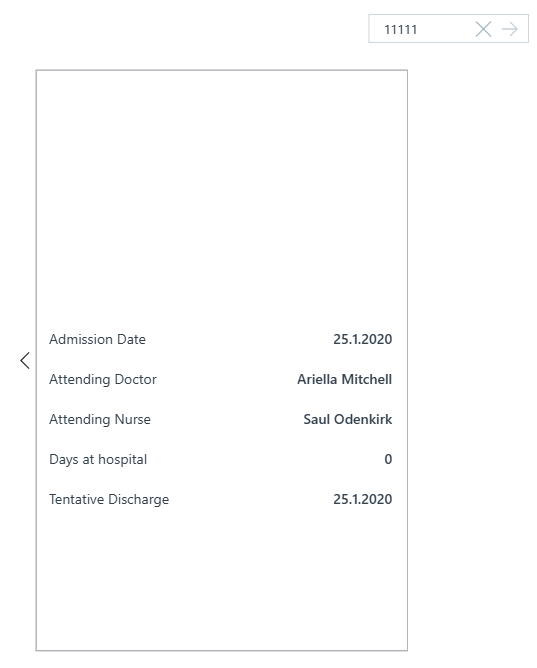
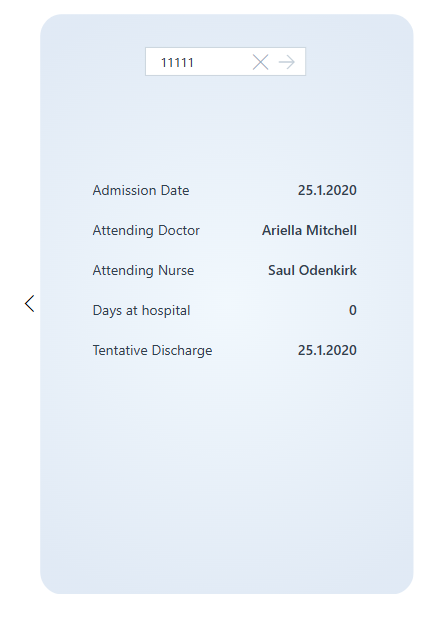
Step 6: Design the "Back" of the Card
1. Switch to the second card (bound to the dummy measure).
2. Use reference labels again to show:
- Admission date
- Attending doctor
- Days at hospital
- Tentative discharge date
Step 7: Style the Front and Back Cards
To make your cards look professional:
Create Custom Backgrounds:- Design your card background in PowerPoint using shapes/icons.
- Export as SVG for sharpness.
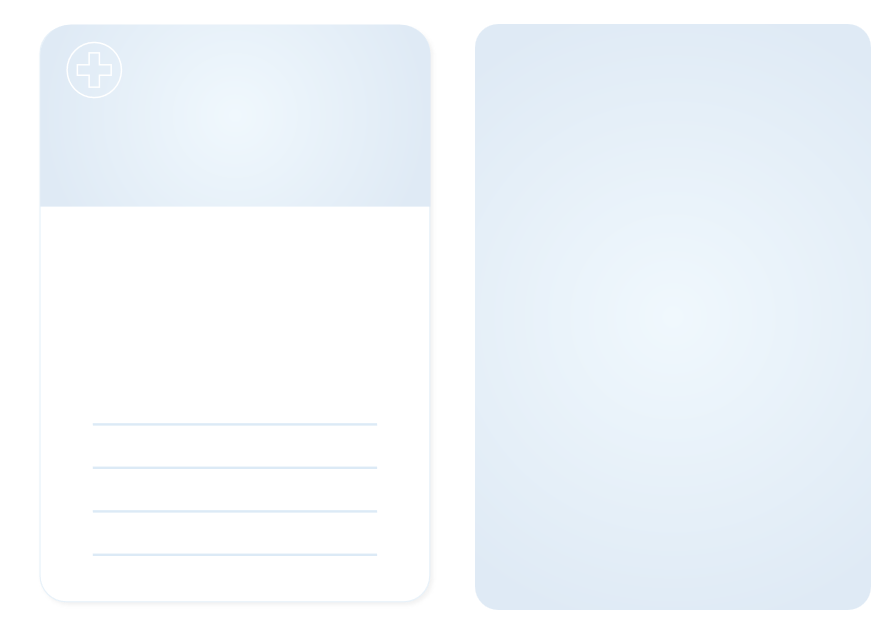
- In Power BI, go to Cards > Background image, upload your SVG, and set:
- Fit: Fit
- Transparency: 100%
Clean Up:
- Turn off borders
- Hide dummy callout values using transparency
- Adjust padding (e.g., 90px top, 40px sides)
- Align slicer with card layout for better UX
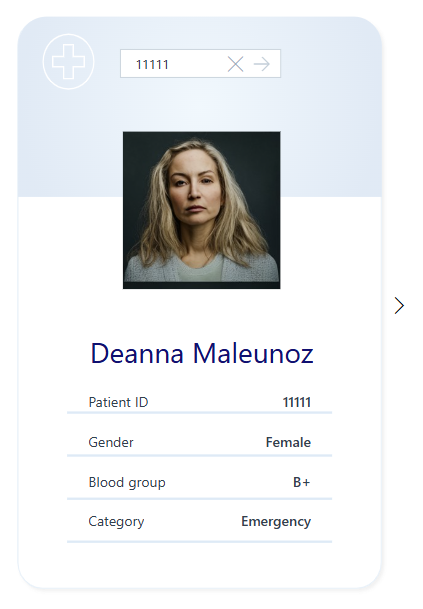
Final Result
You now have a fully working flip card! You can:
- Switch between front and back views using the arrow.
- Dynamically update the card contents via the slicer.
- Display minimal info up front, with extra detail hidden on the back.
Try It Out
Search a different patient ID like 11002 and see how the data updates instantly.
Hope you like it!
Give it a try and see how it works for you! I’d love to hear what you think or see how you use this trick in your own reports.

