
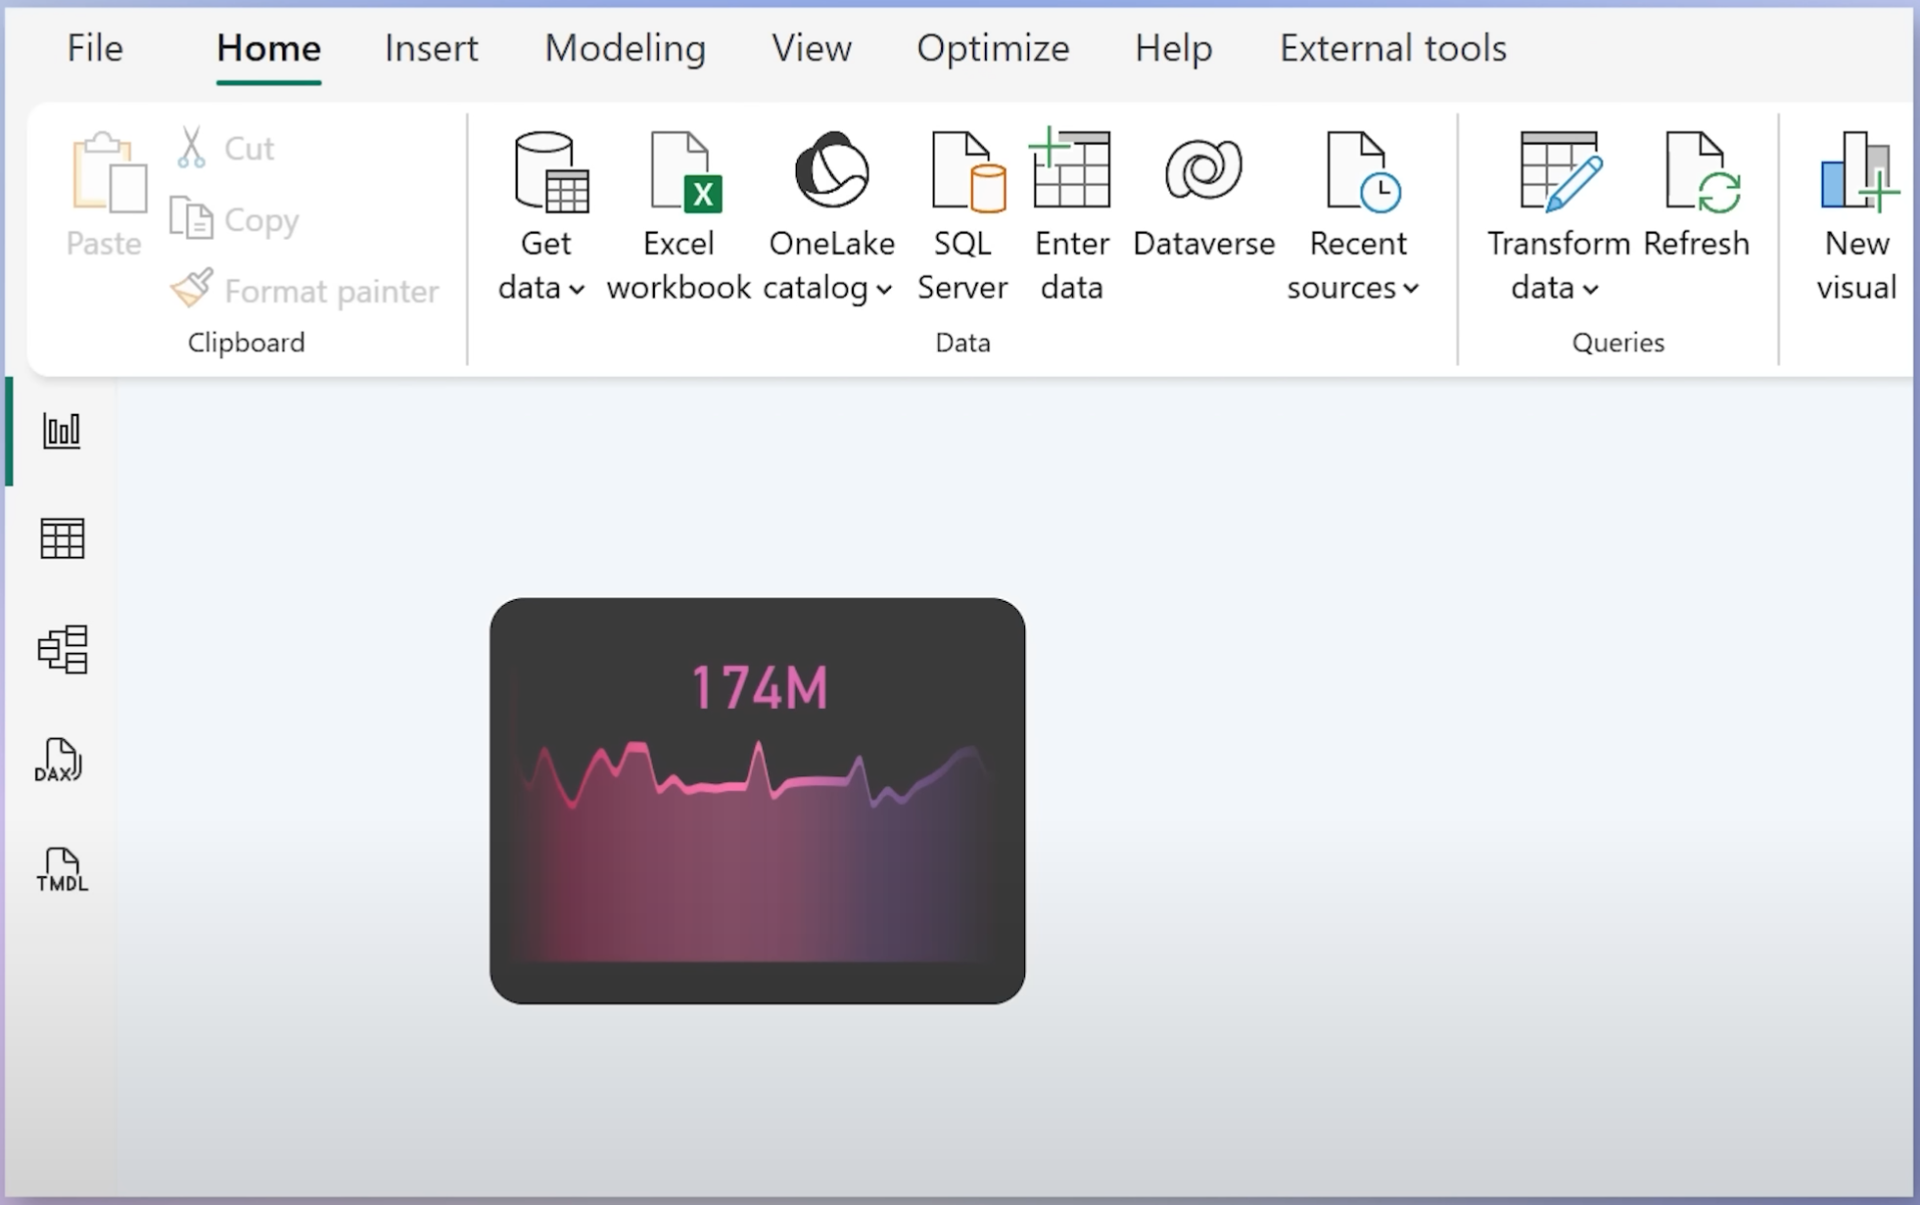
How to Create Gradient & Glow Effects in Power BI: A Creative Workaround with Native Visuals

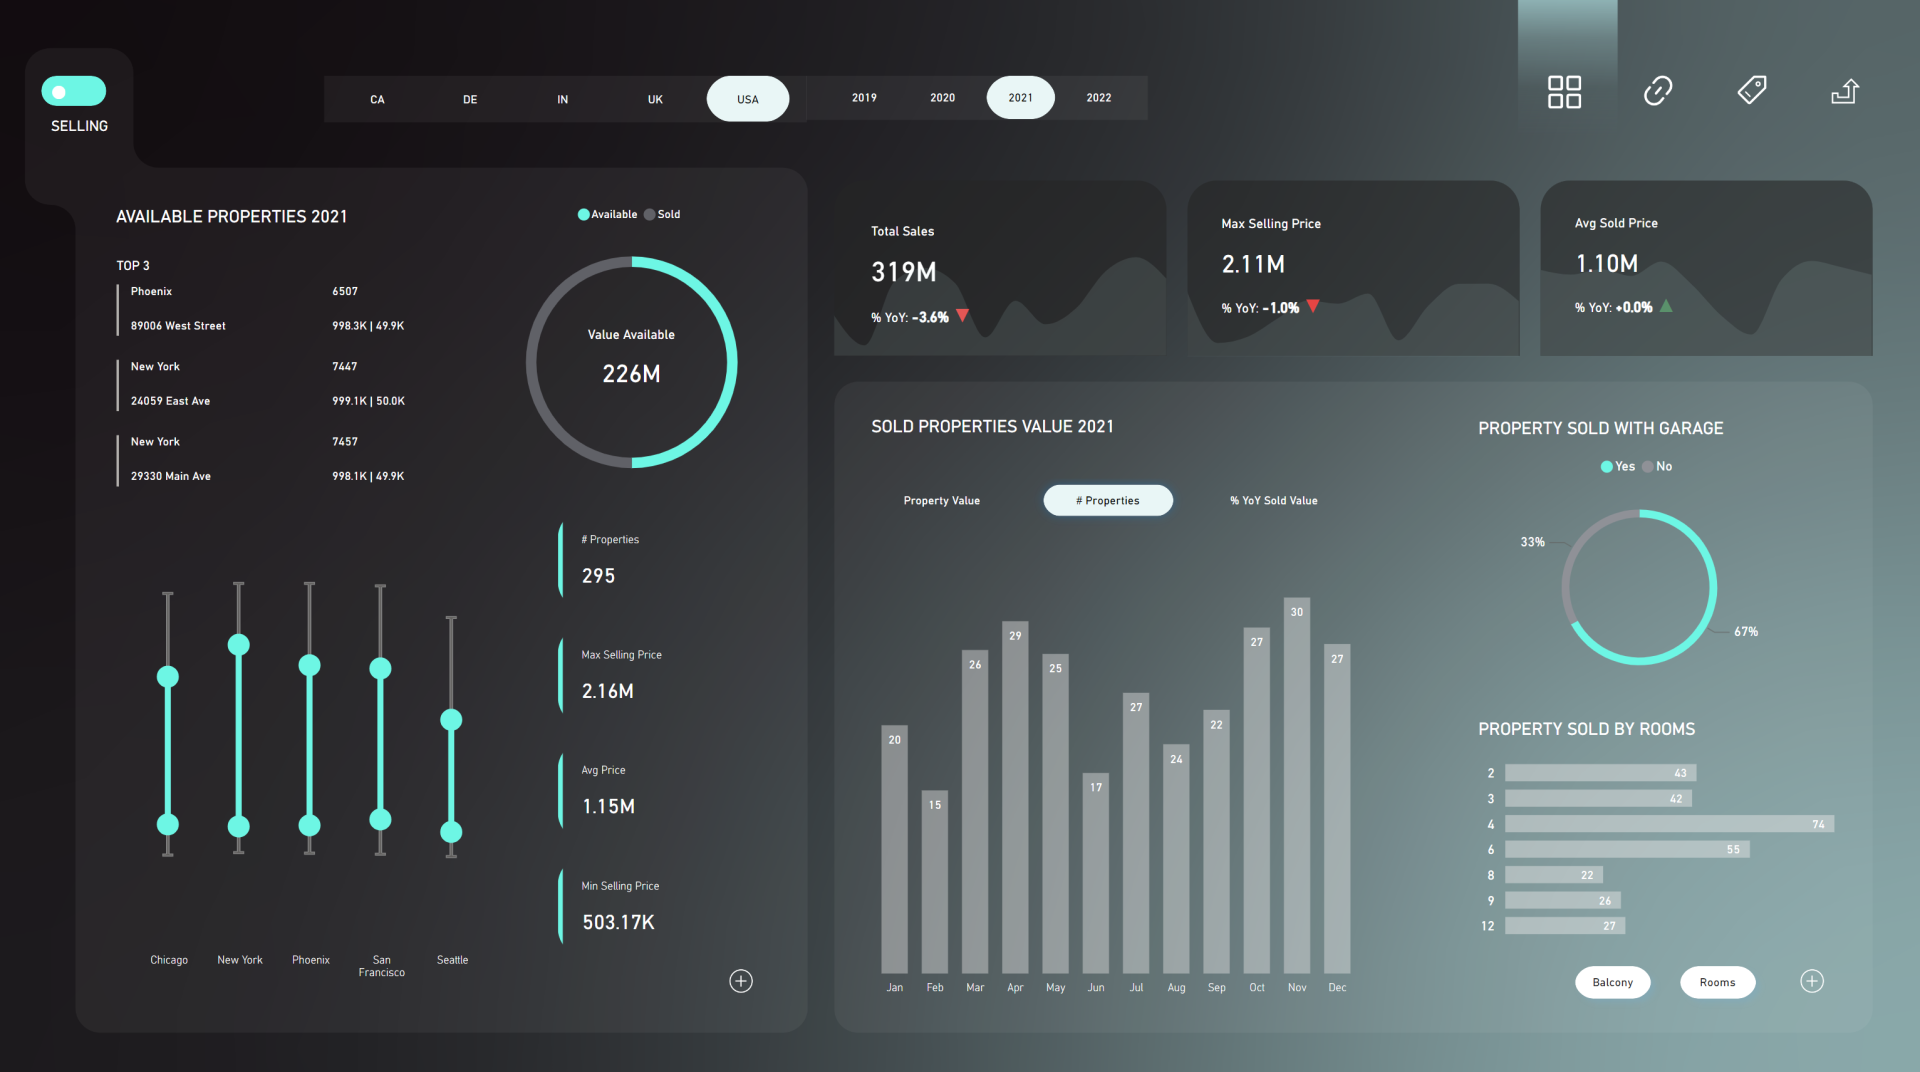
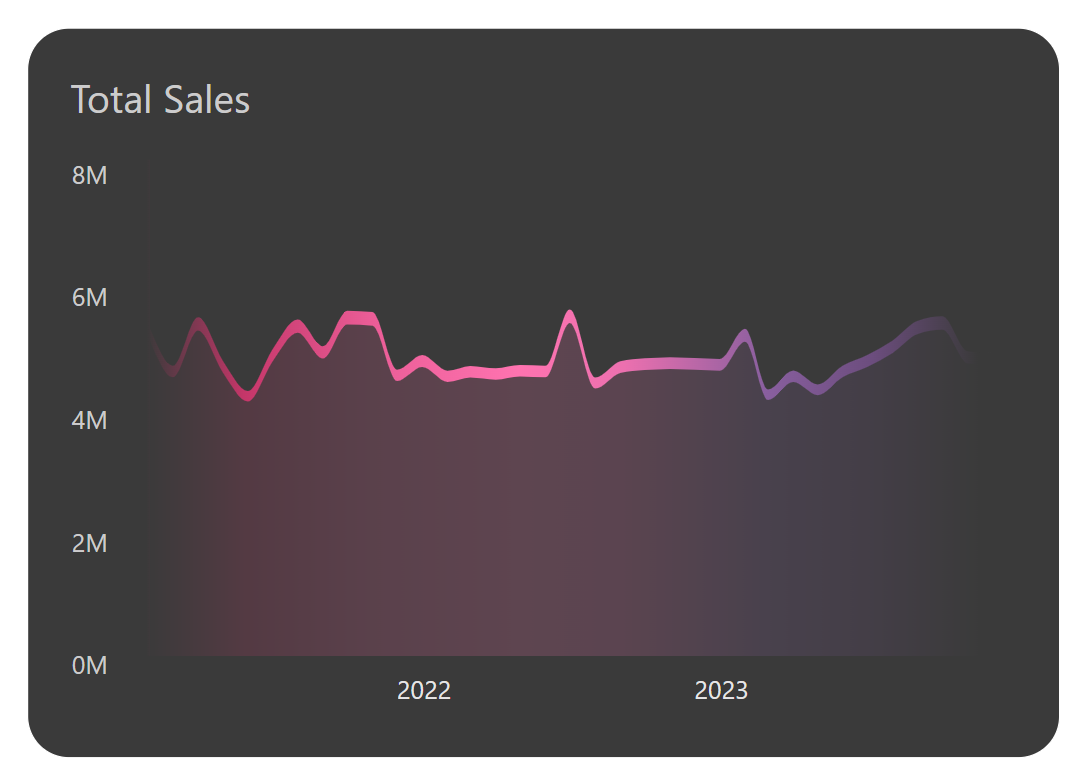
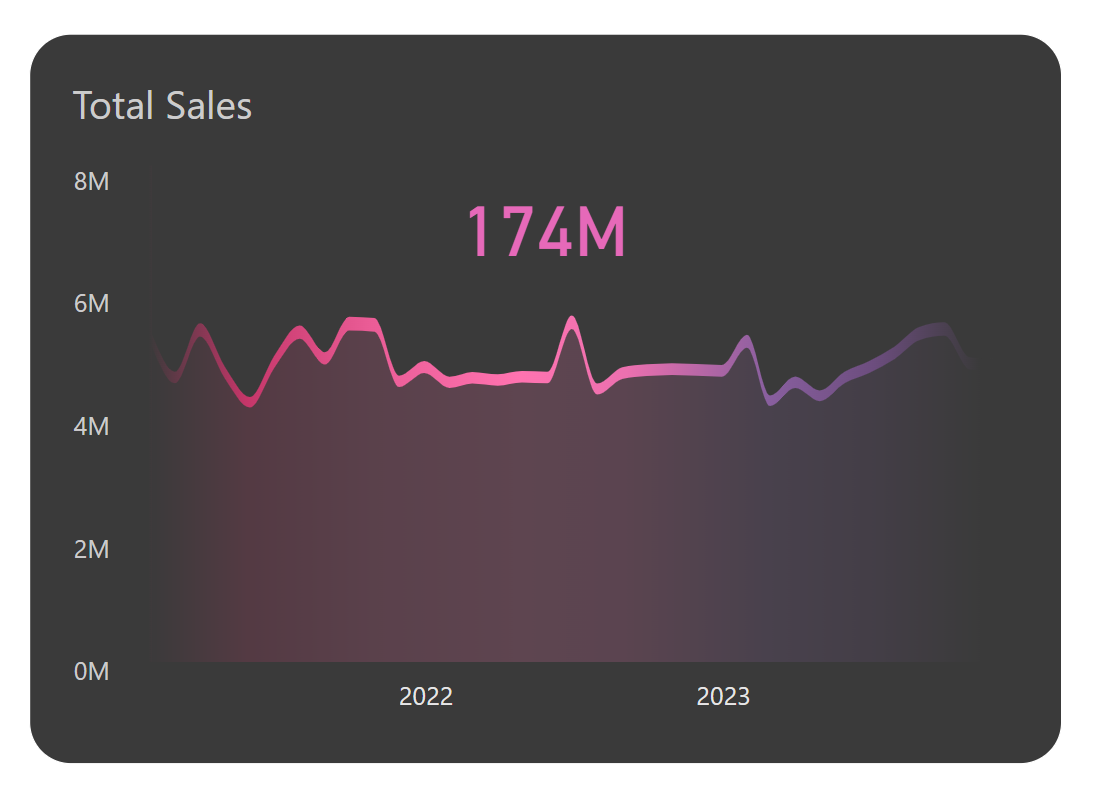
Power BI offers solid visual formatting options - but sometimes you want more. What if you could add glow, gradients, or cinematic effects to your visuals? It turns out you can - with a creative workaround using dummy measures, shaded areas, and SVG backgrounds. This tutorial walks you through every step to create stunning visuals like these.
Mar 8 / datatraining
Let's dive in.

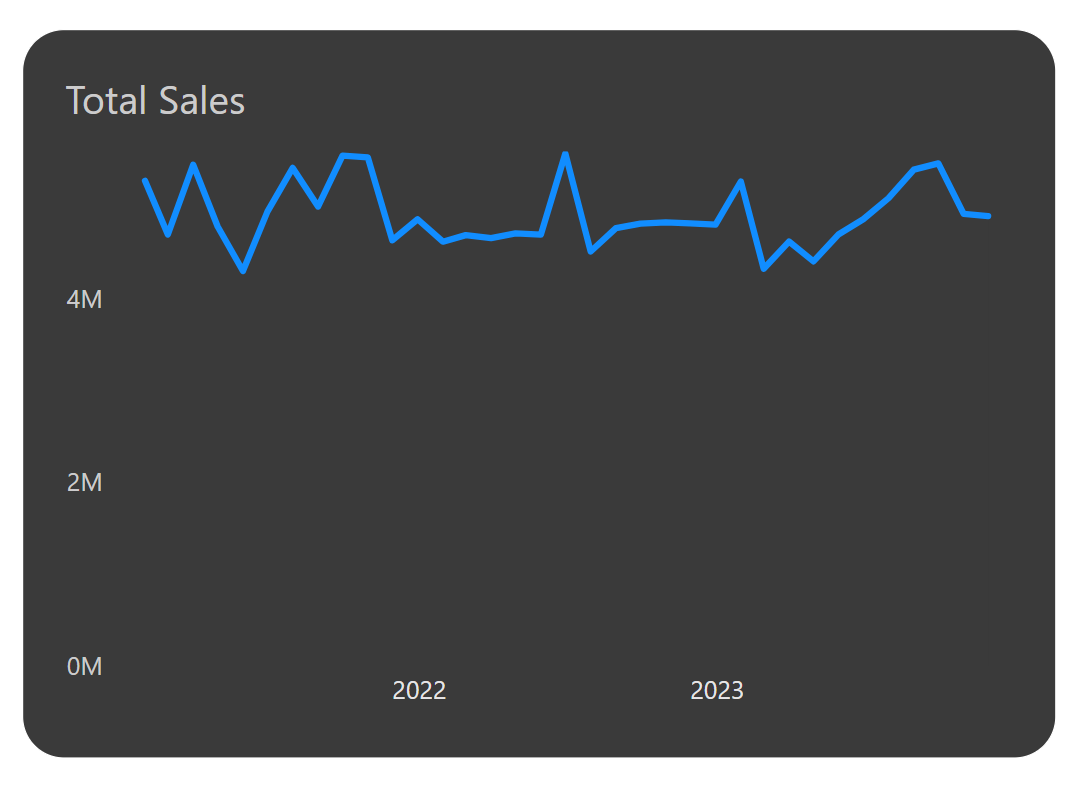
Step 1: Set Up the Base Line Chart


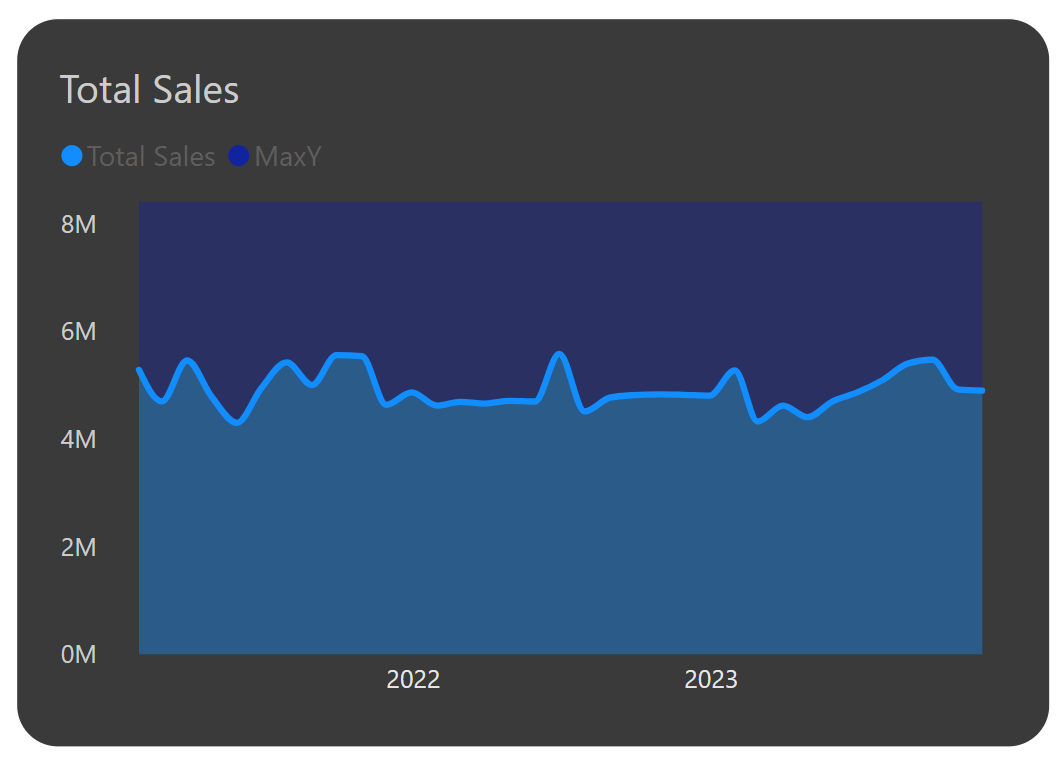
Start with a regular line chart - functional, but not impressive.
We’ll transform this into a dynamic, gradient-rich visual.

Step 2: Control Y-Axis with a Measure


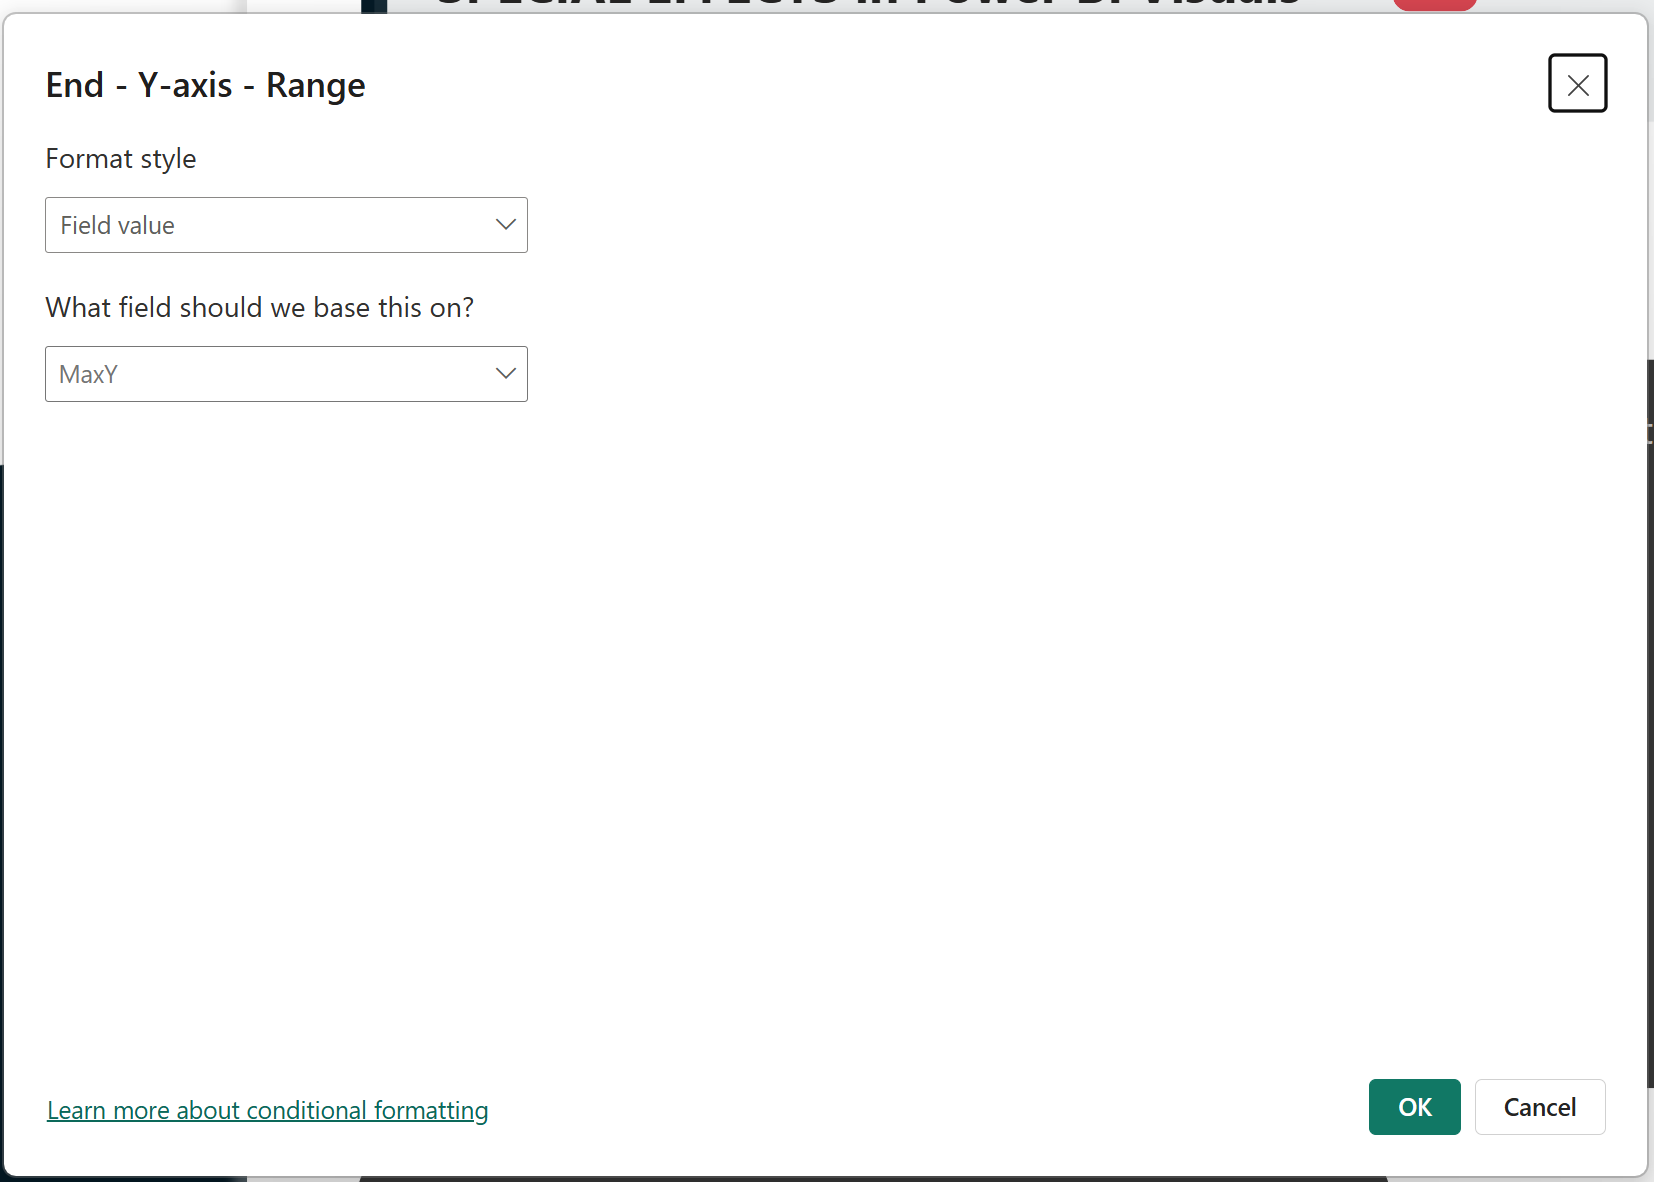
To make space above the line, control the Y-axis maximum dynamically.

Create a measure like:
Max Y =
            MAXX(
                        ALLSELECTED(dimDate[MonthYear]),
                        [Total Sales]
             ) * 1.5

Apply it to the Y-axis maximum via the fx option.
This pushes the line downward, creating space for visual effect above it.

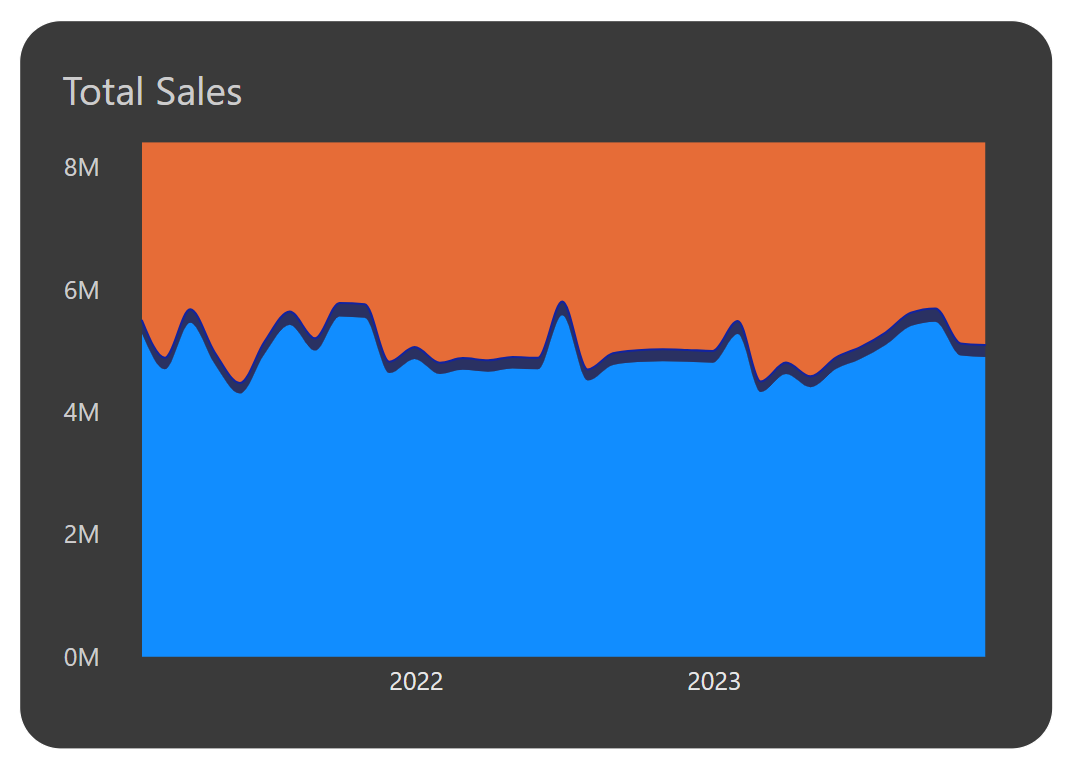
Step 3: Simulate Gradient with Stacked Area Chart


Since Power BI doesn’t support gradient lines directly, switch to a stacked area chart.
1. Add Total Sales as the first measure.
2. Add the Max Y measure as the second.

Now you have two layers: one below the line, one above it.

Step 4: Insert a Dummy Measure for Line Simulation


Create a dummy measure, e.g.:
Dummy = [Total Sales] * 0.04

Place it between the two other measures in the Y-axis field well.
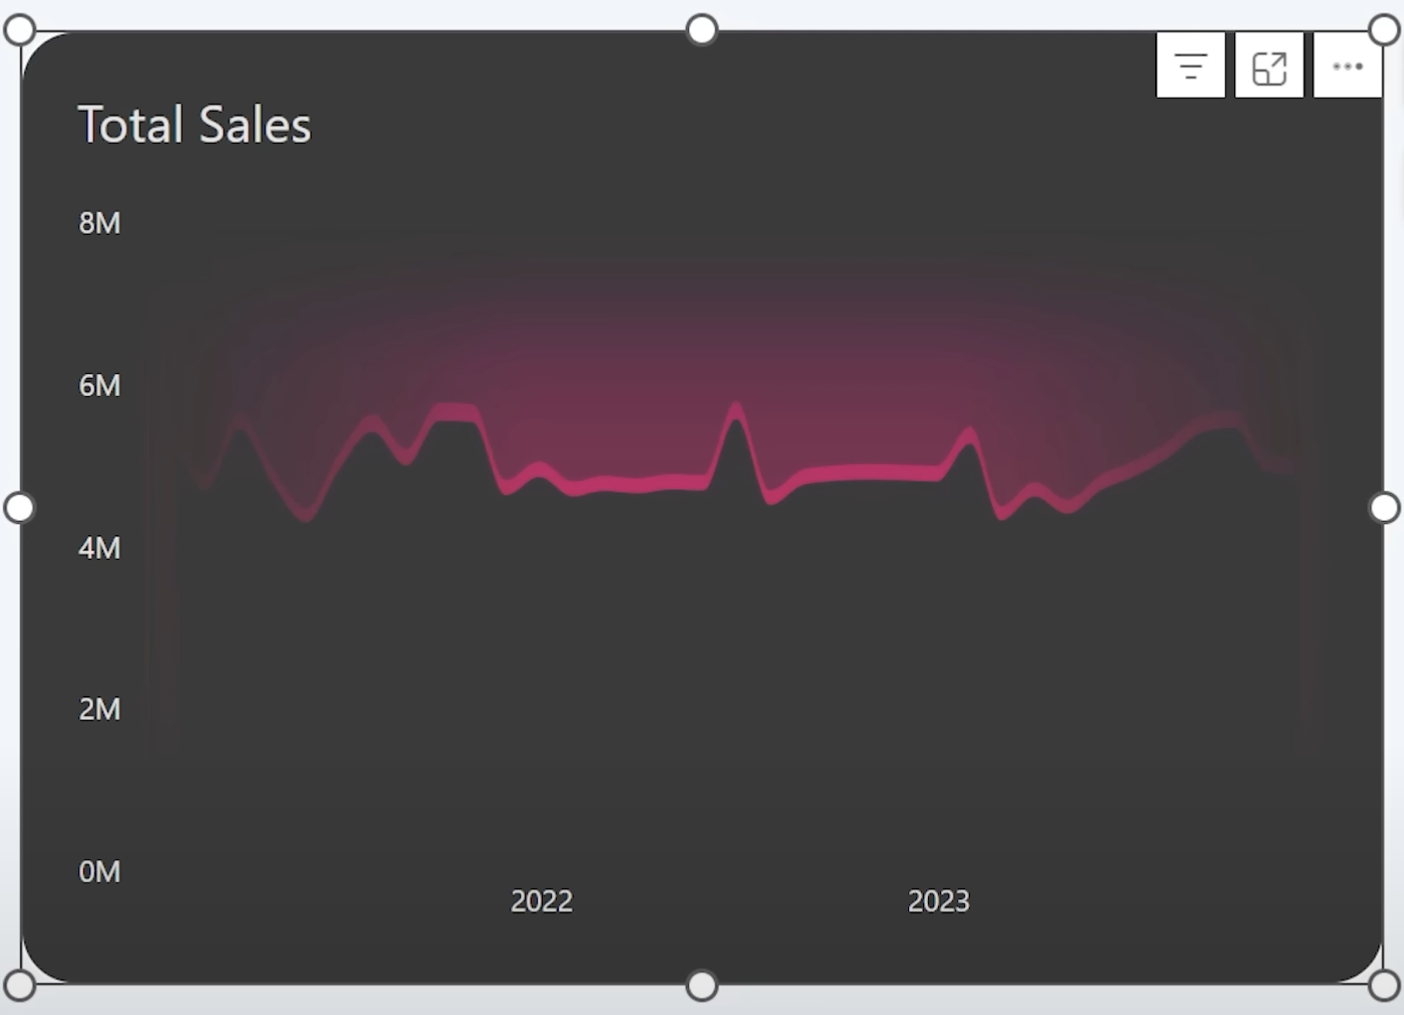
You’ll now see a “line” appear between the shaded areas. Change its color (e.g., pink) and set transparency to 0%.

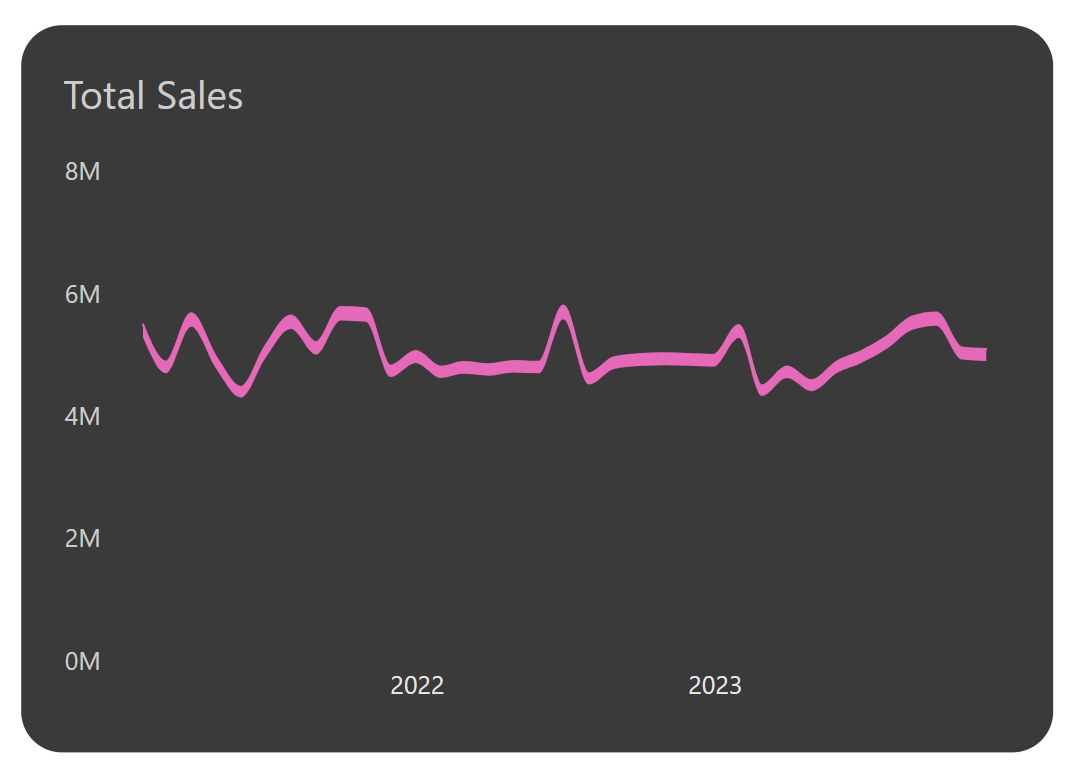
Step 5: Hide the Colored Areas

Now make both Total Sales and Max Y match the background color of your report page.
What’s left is the dummy “line,” acting like a stylized visual.

Step 6: Add a Gradient Background via SVG

To simulate a gradient glow, create a gradient SVG background in PowerPoint:
1. Create a rectangle with a gradient fill.
2. Save it as SVG via File → Save As → SVG.
Back in Power BI:

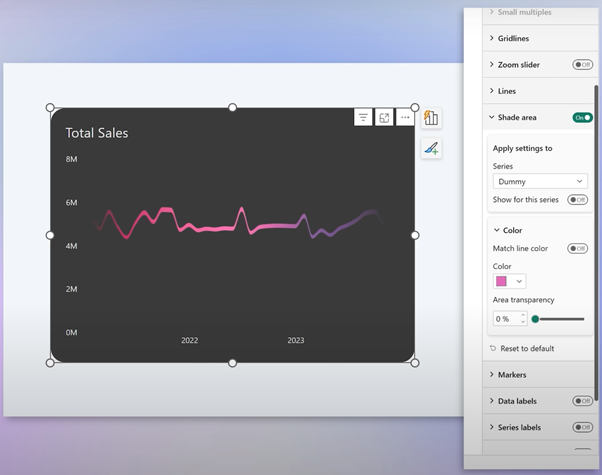
1. Go to your visual's Plot Area → Image background.
2. Upload your SVG gradient.
3. Adjust Image Fit to Fit or Fill.
4. Turn off the shade area of the Dummy measure
Now you’ll see the gradient glow shine through!

Step 7: Let the Background Shine 

To complete the effect:
1. Select the Total Sales series.
2. Set its area transparency to 18%.

Step 8: Add a KPI Value (Optional)

You can add a KPI card just above the visual:
• Add a KPI visual with total sales.
• Remove background, border, and labels.
• Use a matching font and color.

Step 9: Try Different Gradients and Layouts

Want to adjust the mood?
• Swap the SVG for a different gradient style (e.g., darker or more subtle).
• Flip the visual by hiding the bottom color instead of the top.
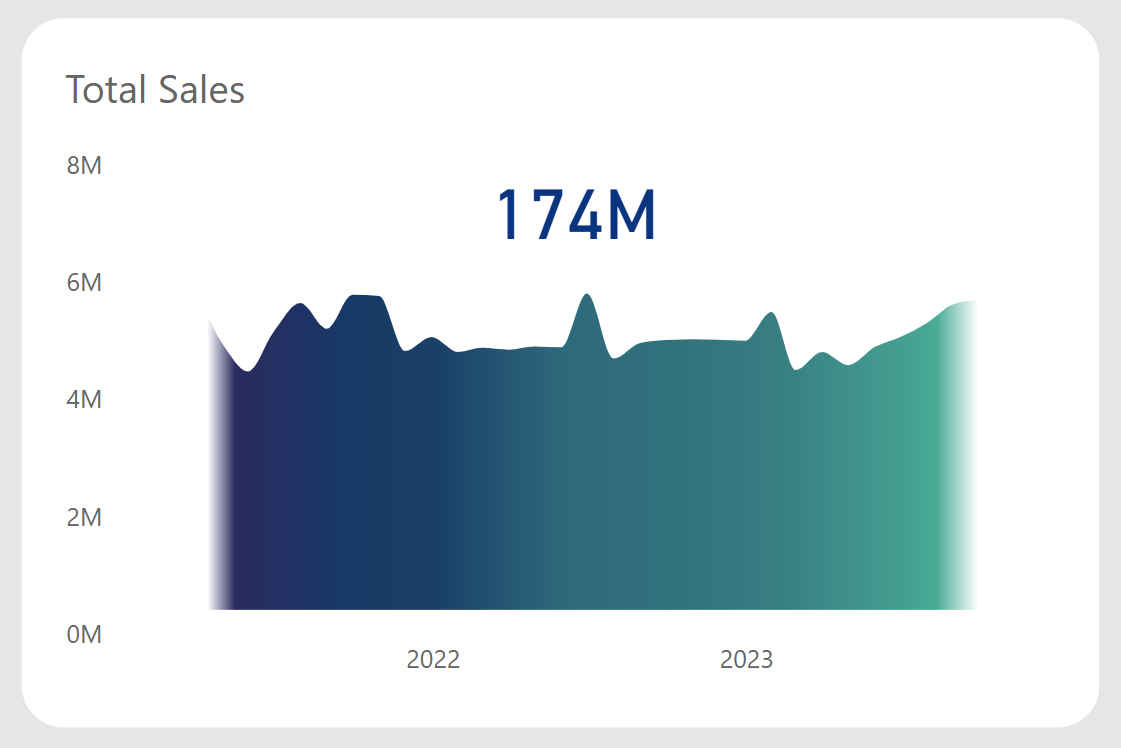
• Apply to visuals with white backgrounds for clean KPI cards.

Final Example: KPI Card with Trendline Glow

Hide X/Y axes and minimize space. You now have a beautiful, glowing trendline for your KPI.

Final Thoughts

This technique isn't officially supported - but it's incredibly powerful.

It combines:
• Power BI measures for layout control,
• SVG gradients from PowerPoint,
• Clever formatting tricks for transparency and layering.
Whether you want to impress in a demo or make your dashboard visually engaging, this is a trick worth adding to your toolkit.

Hope you like it!

Give it a try and see how it works for you! I’d love to hear what you think or see how you use this trick in your own reports.

How to Power BI

Watch it here

Launch Power BI Reports
that bring your organization
to a fully 
data-driven world.

Power BI Launch

After years of consulting we have developed a holistic solution for launching Power BI Reports in 3 months. From key metrics discovery, to report design, implementation and stakeholders' training. We know precisely how to launch Power BI reports that drive organizations' growth.

Power BI Trainings

Our technical trainings for report developers instantly upskill your teams. Alongside our unique business user trainings the improvement in overall organizational data literacy becomes immediately actionable.

Take your Skills to the Next Level

Power BI Trainings

__________