Building an Impressive Flow Chart in Power BI (No Custom Visuals Required)

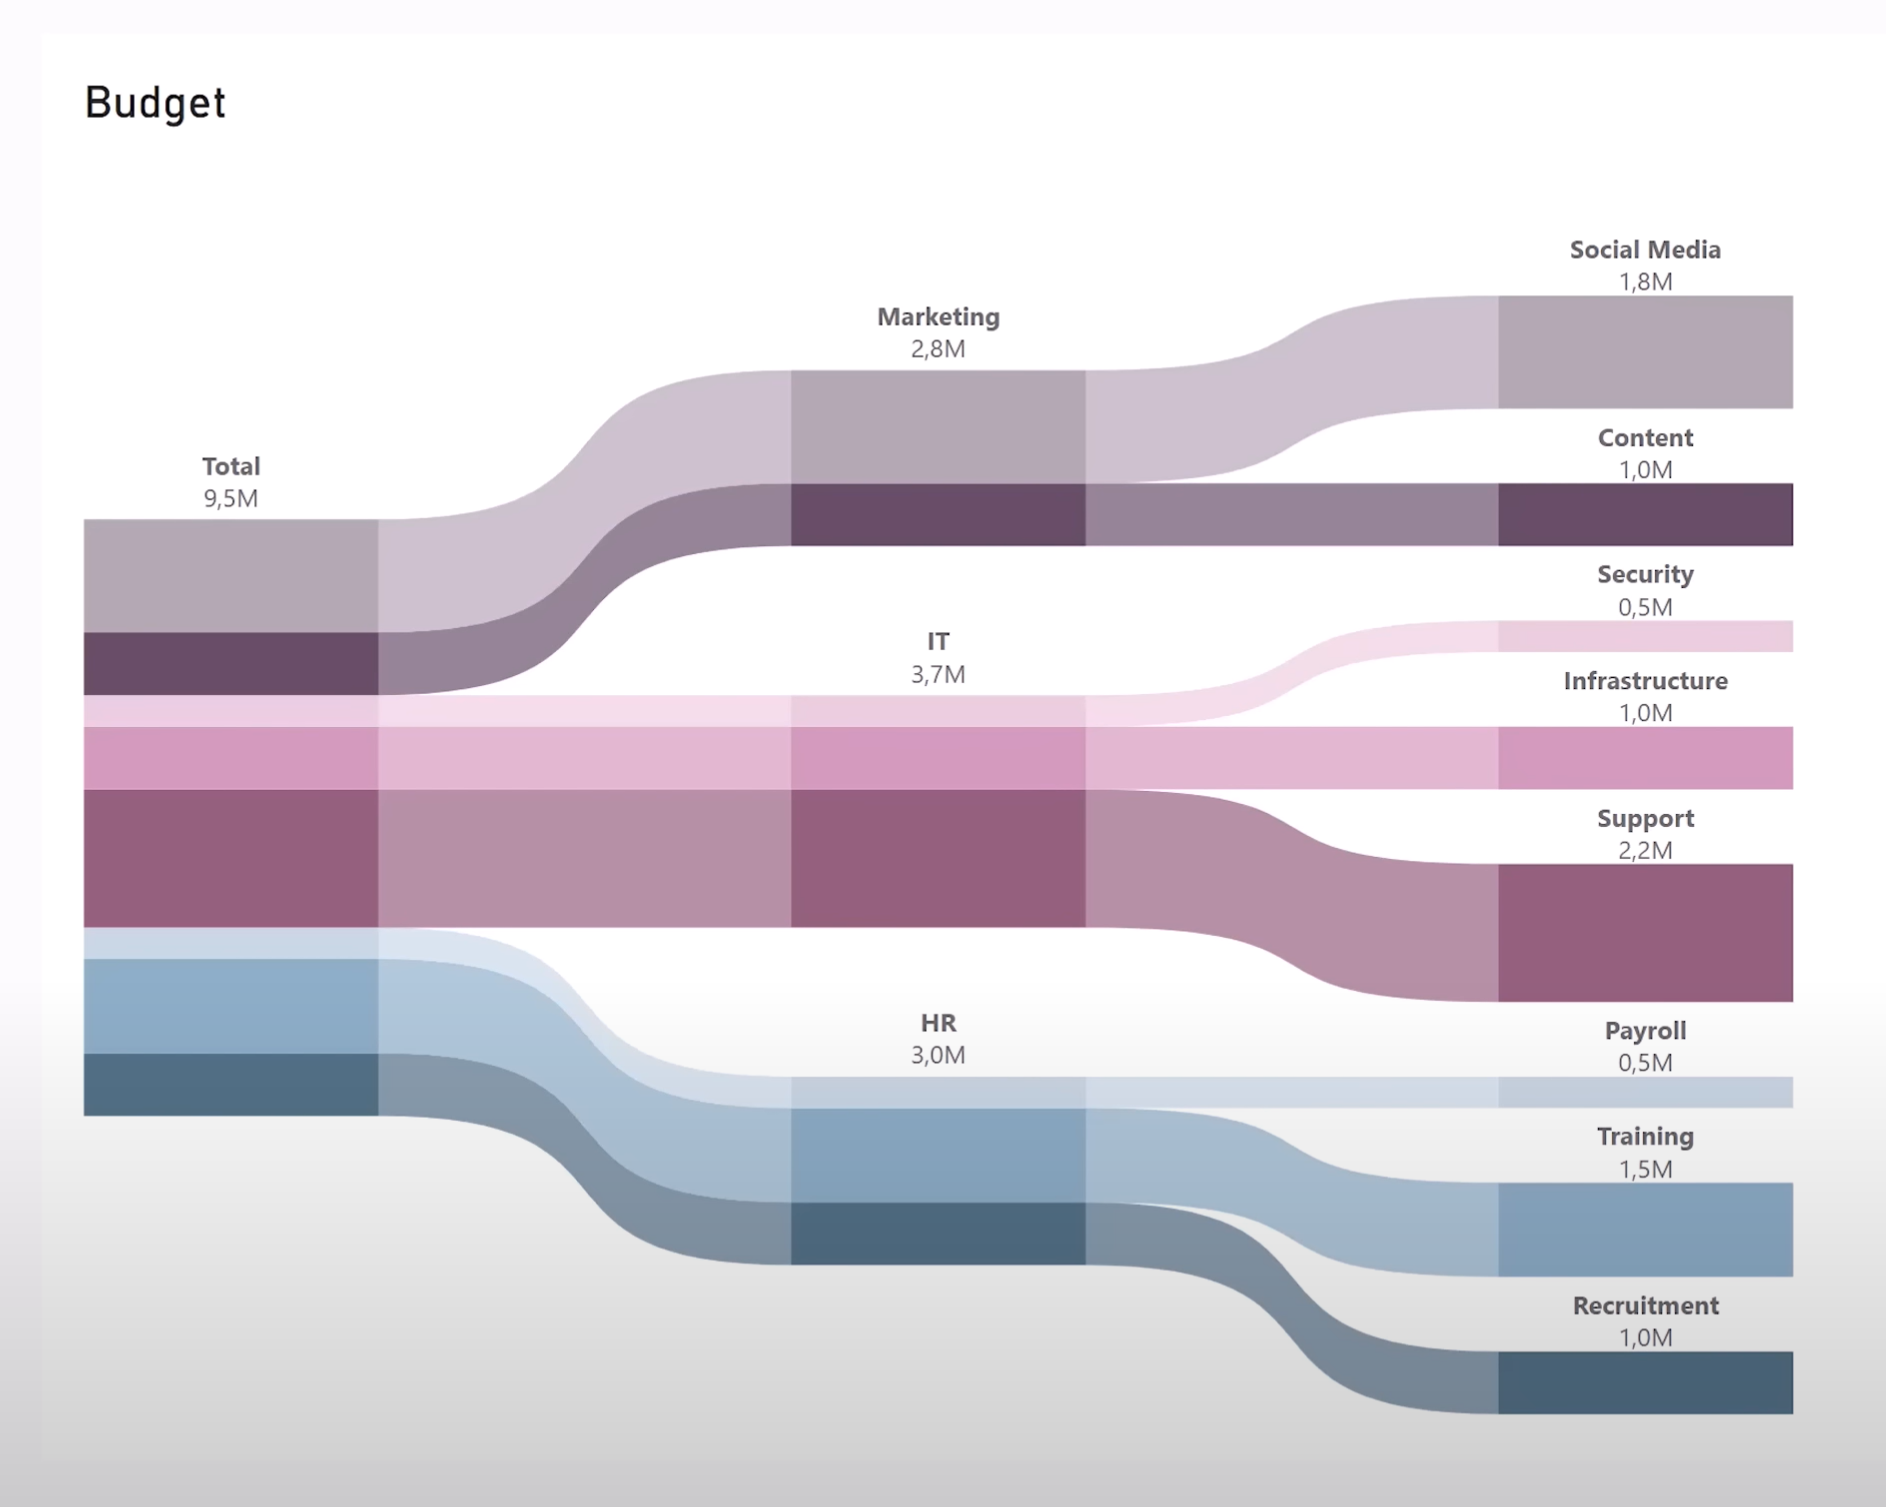
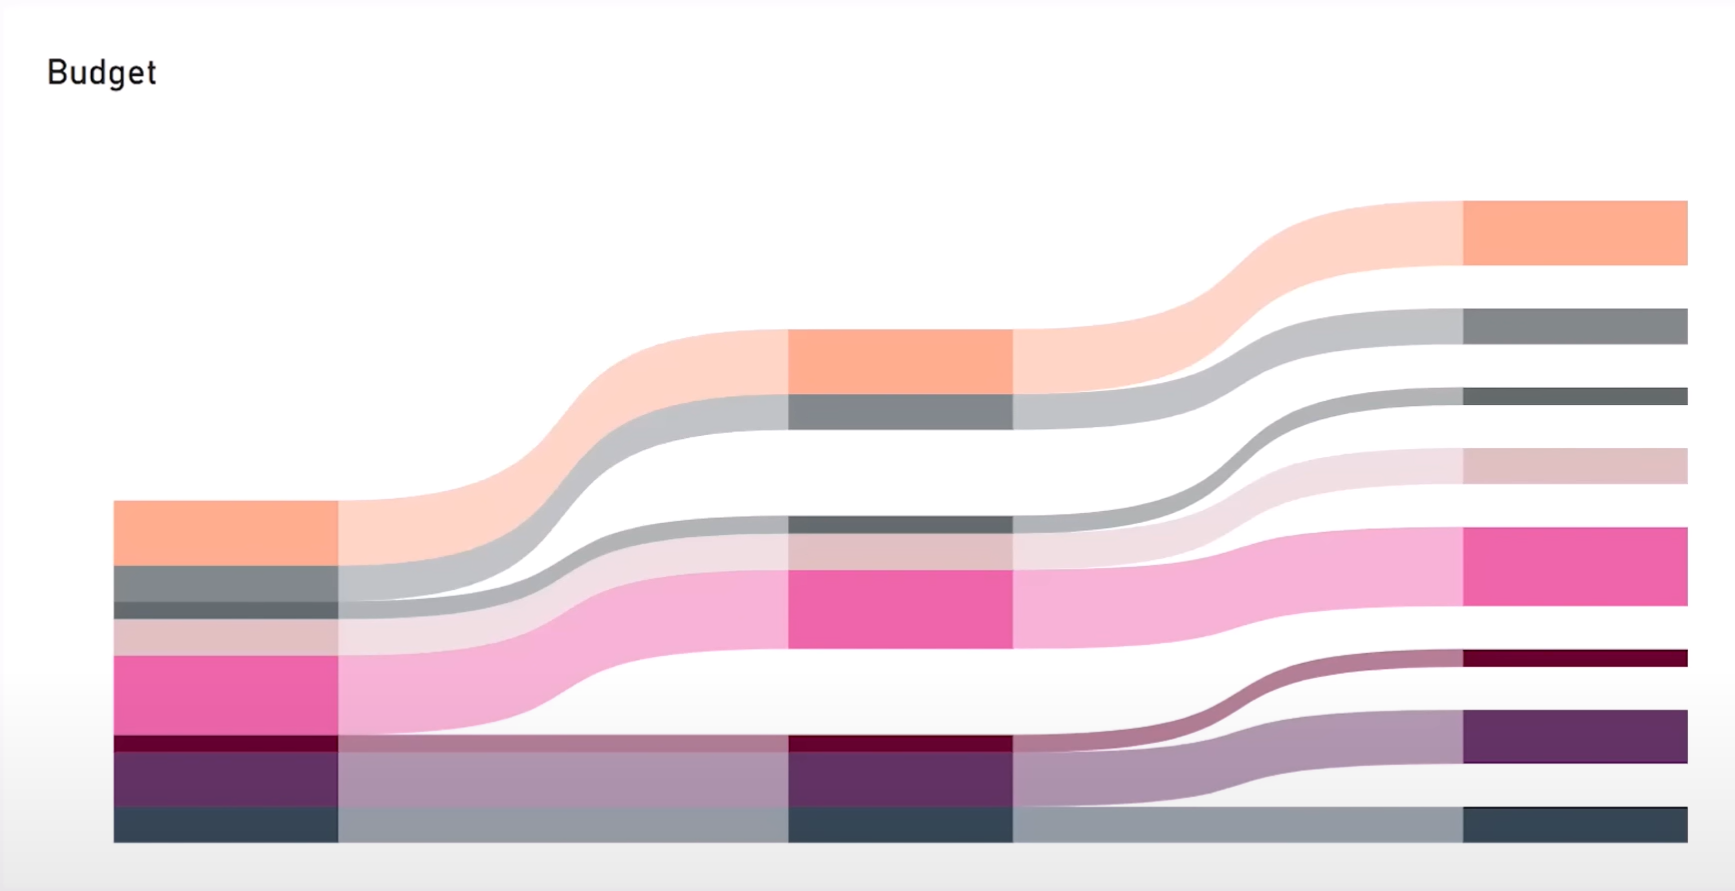
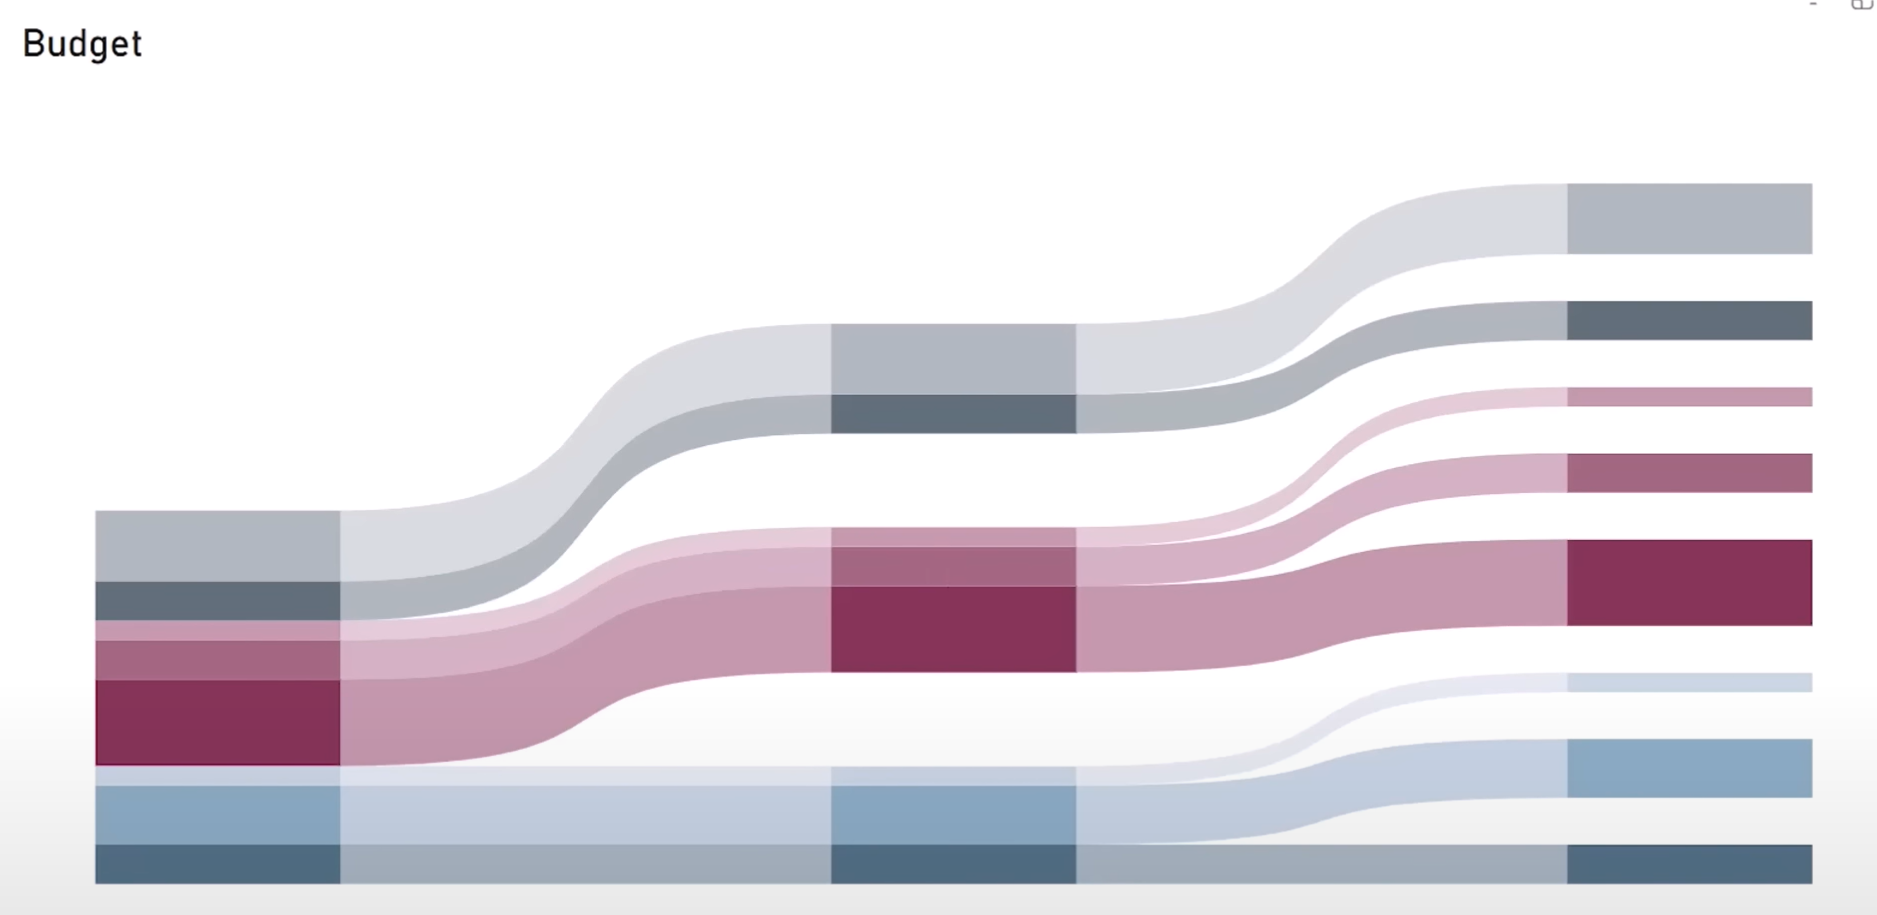
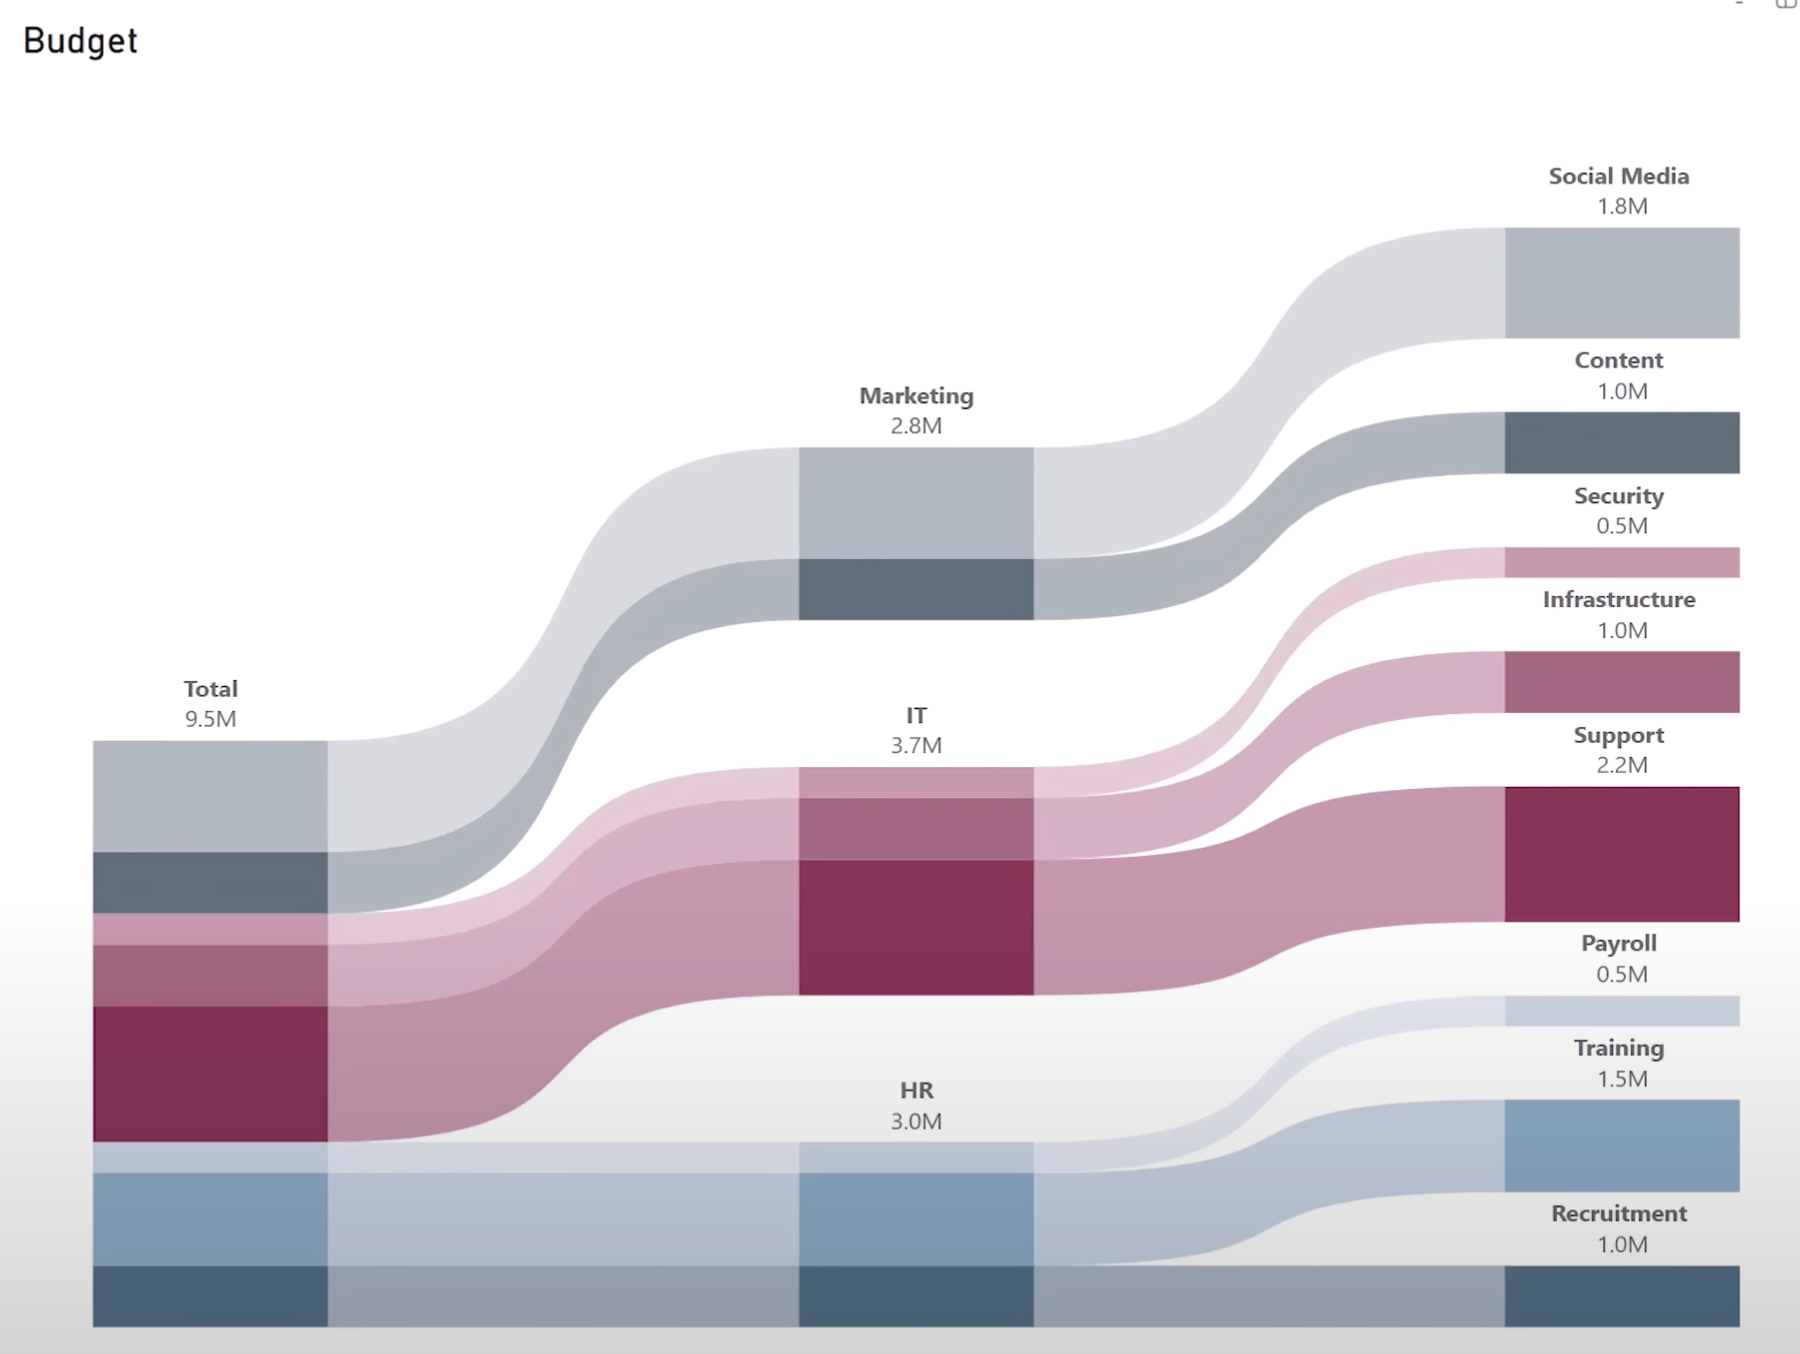
In this tutorial, we’ll create a dynamic visual in Power BI that mimics the behavior of flow charts from Google Analytics only this time, it shows how total budgets flow into departments and then into individual teams.
Jun 13 / datatraining
Why Not Just Use a Decomposition Tree?

While the decomposition tree in Power BI offers some breakdown features, it lacks clear vertical magnitude and doesn't offer much visual flexibility. We’re building a statement chart, something made for executive dashboards: bold, clear, and attention-grabbing.

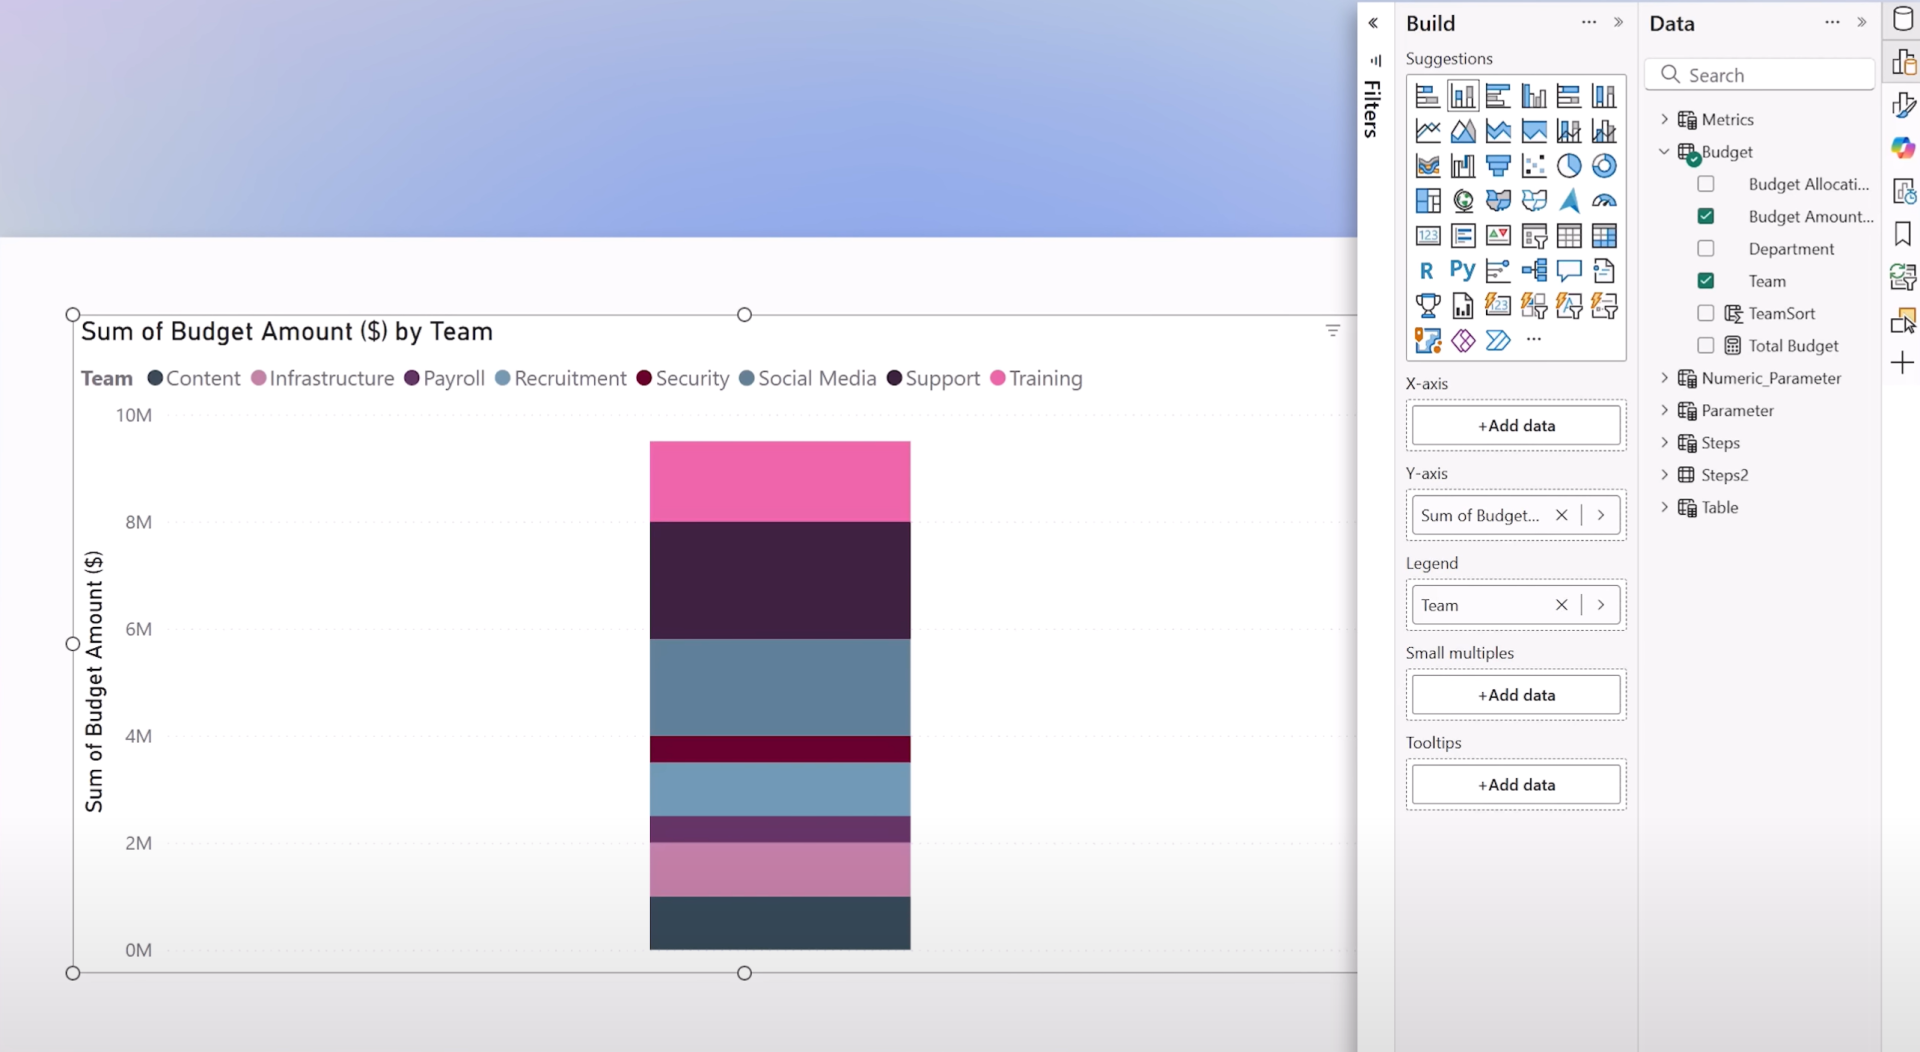
Step 1: Starting with a Stacked Column Chart


We begin with a simple stacked column chart:
• Y-axis: Budget Amount (from your budget table)
• Legend: Team
While this shows team-level data, it doesn't show departmental totals. We want three levels: Total → Department → Team.

Step 2: Creating a Helper Table


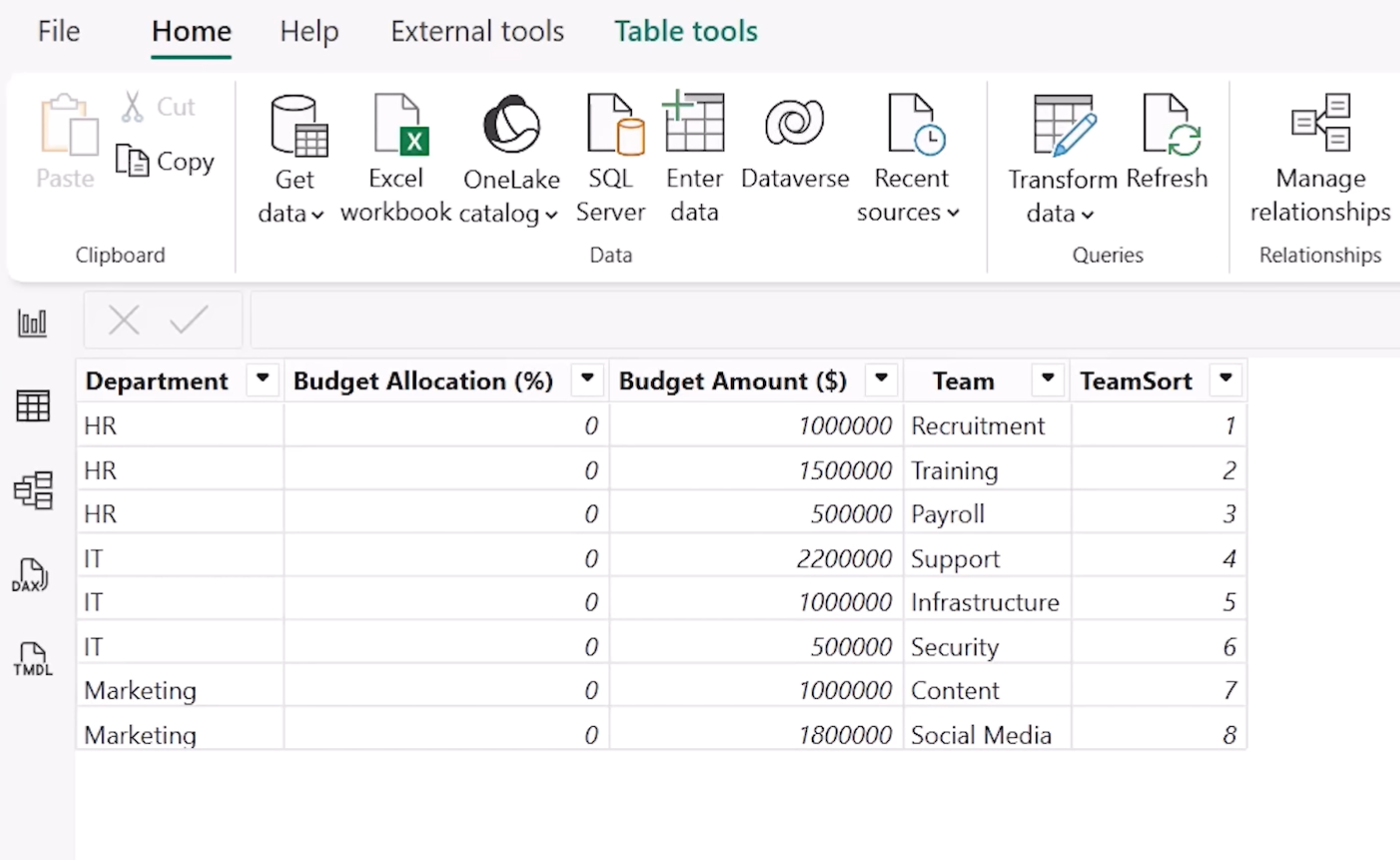
Original budget table:
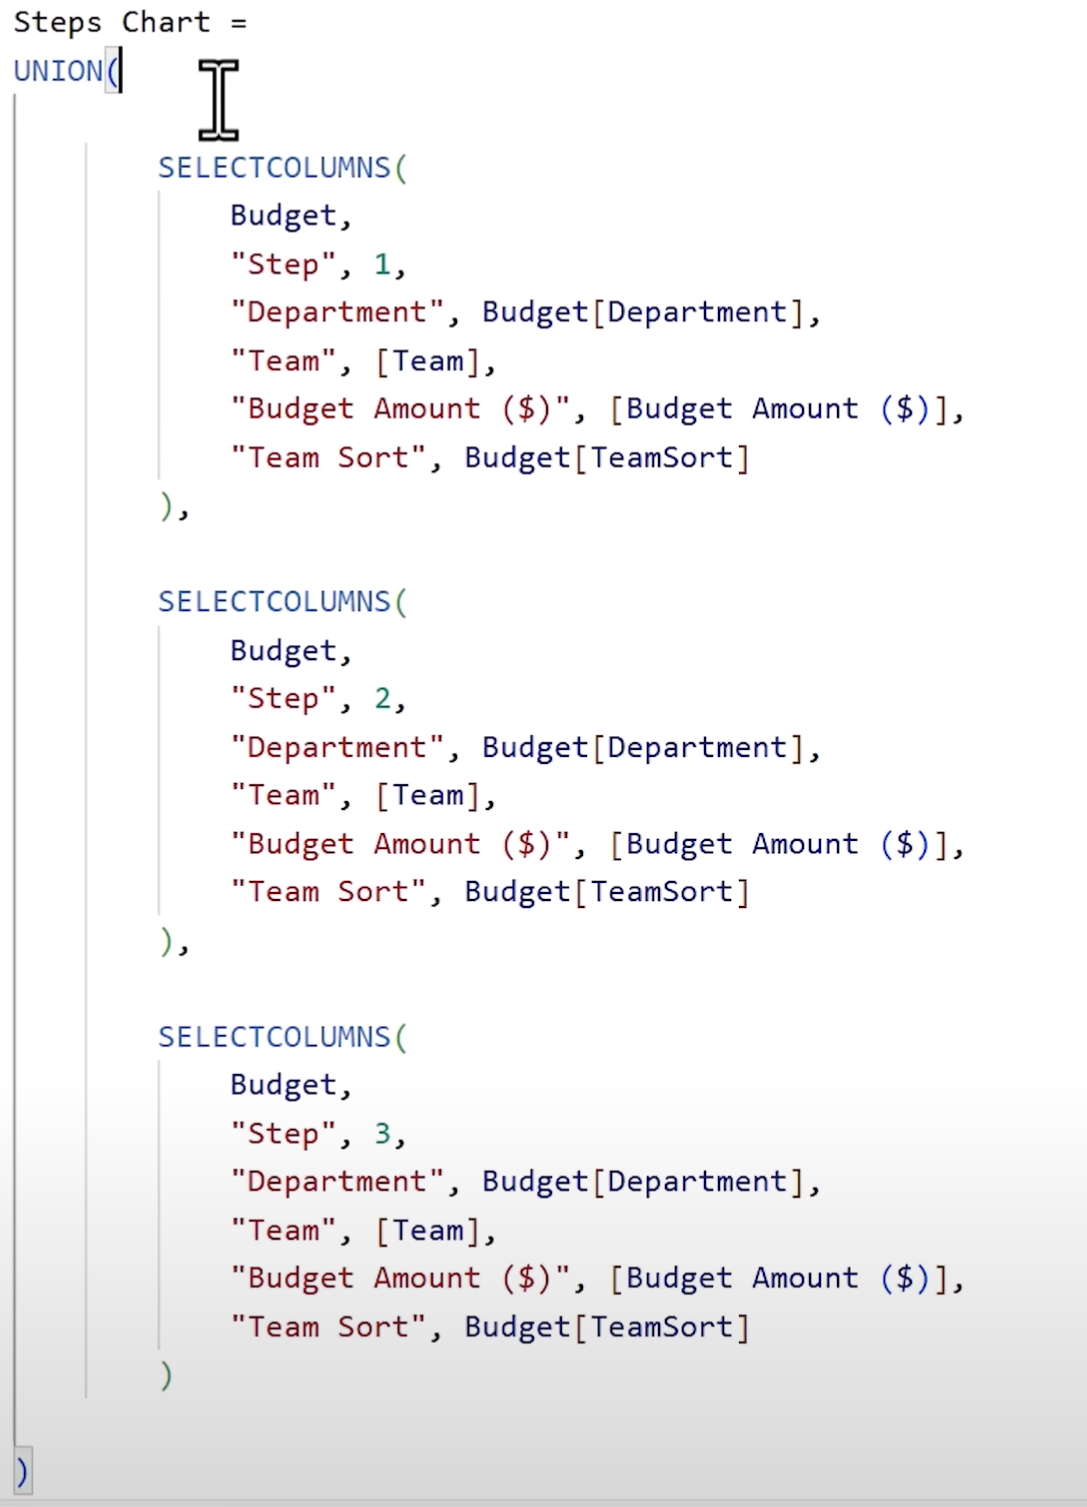
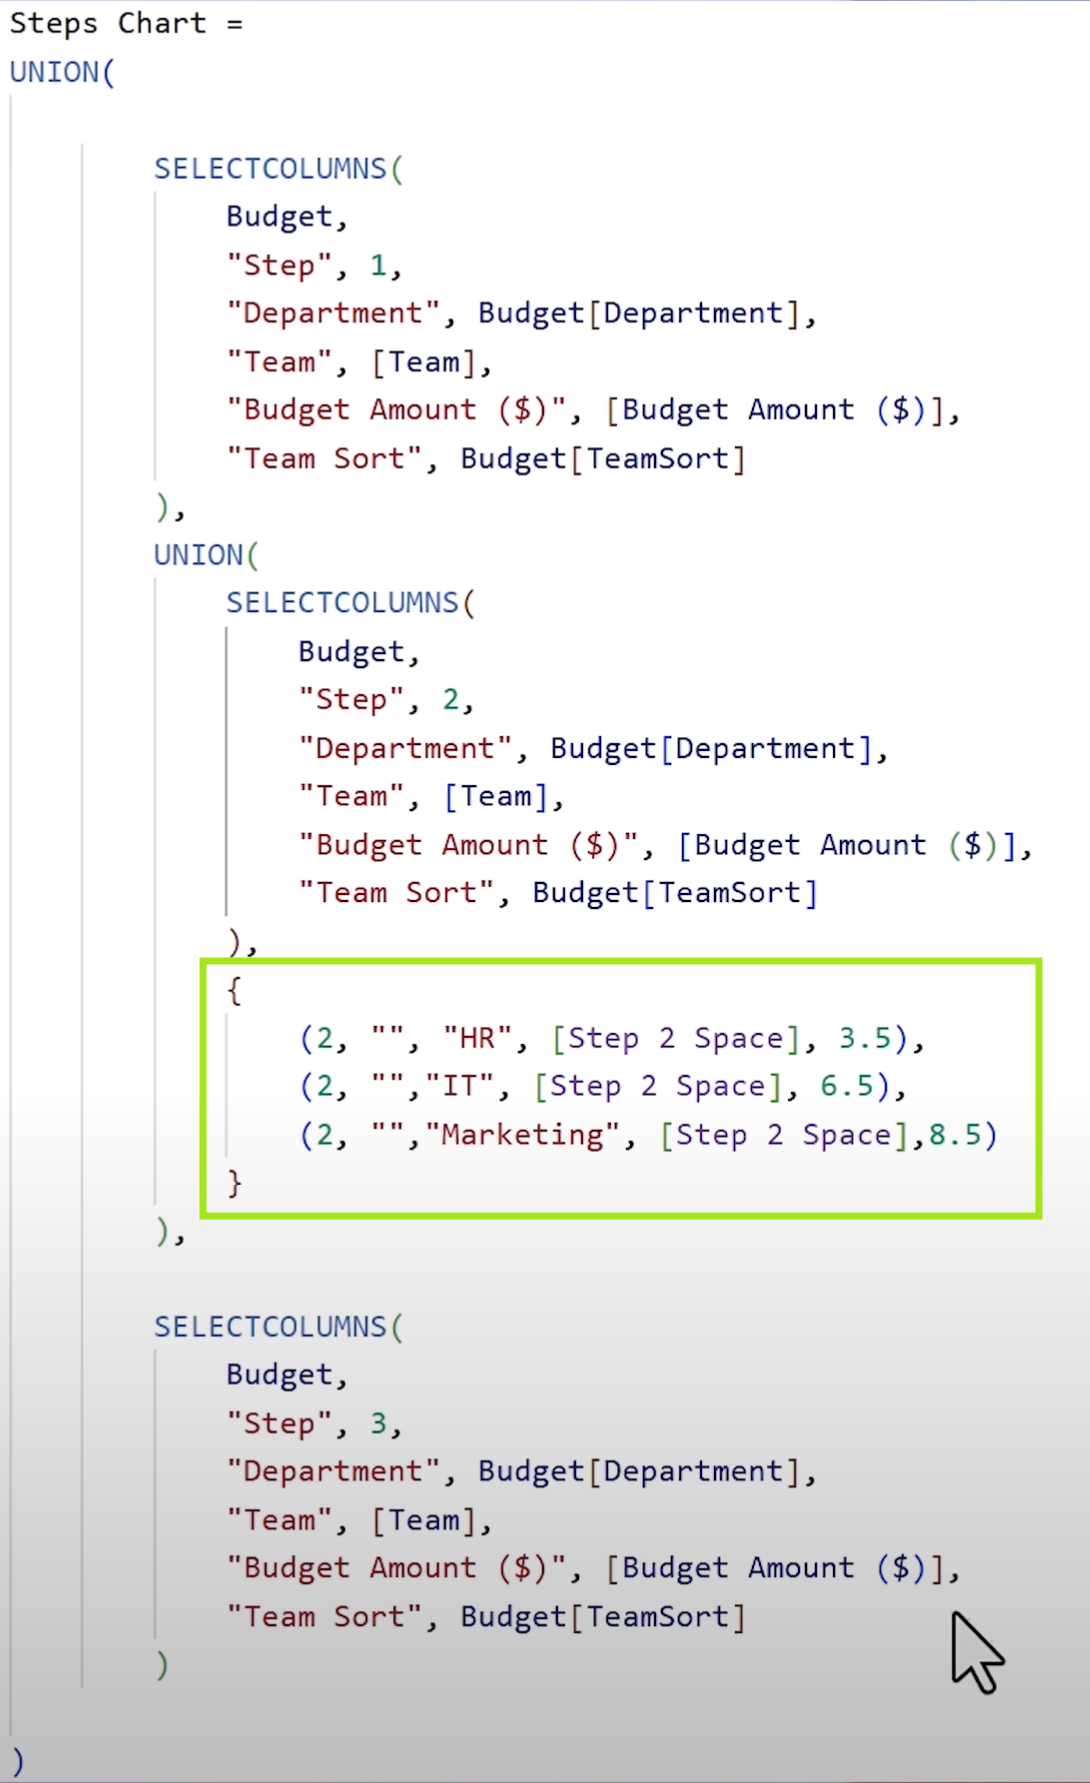
To visualize all three breakdown levels, we’ll create a new table that stacks the original 
This will give us one column for totals, one for departments, and one for teams.

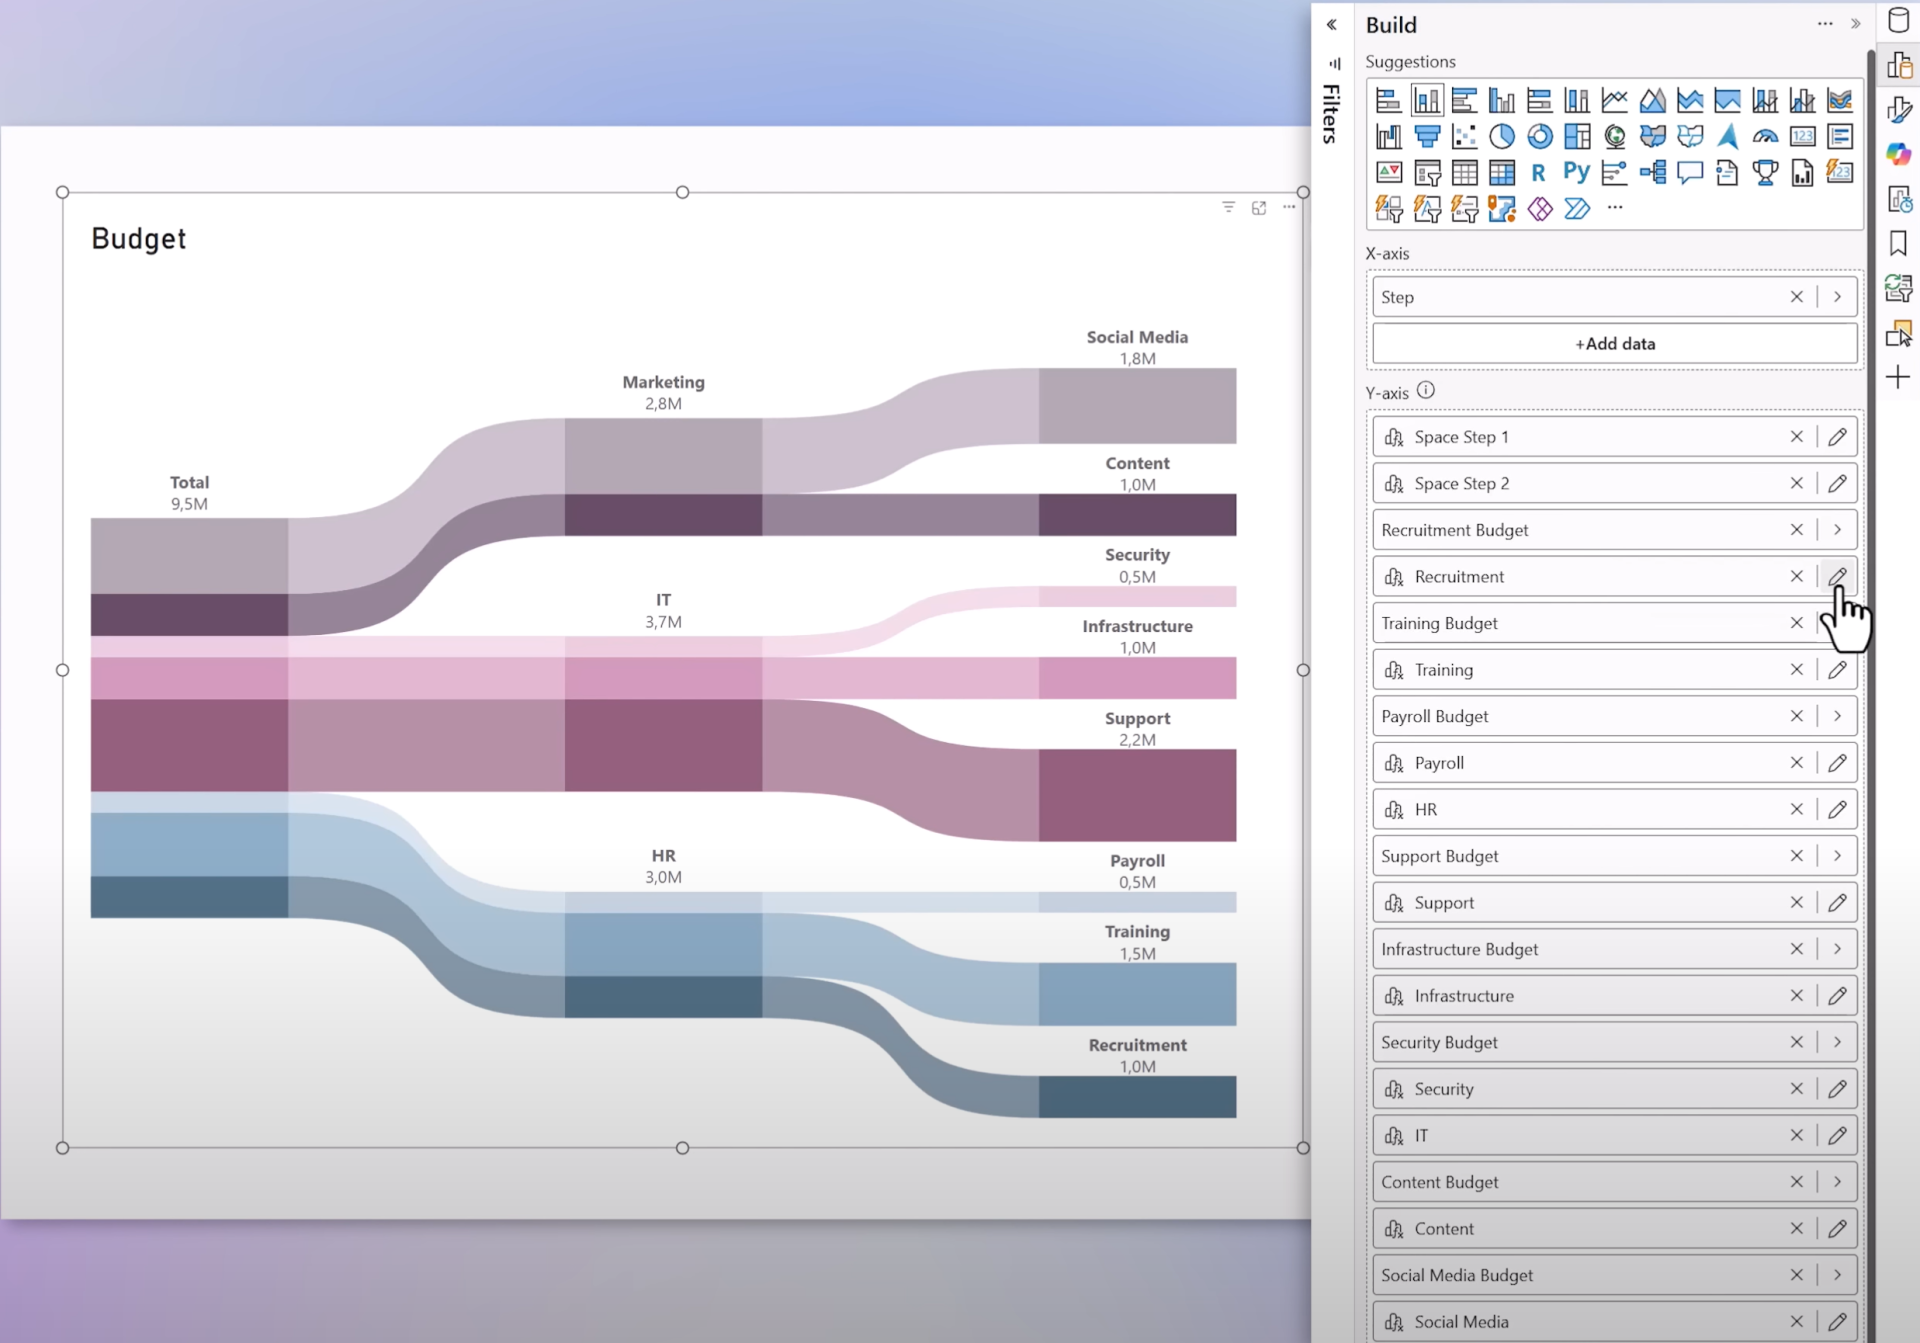
Step 3: Building the Visual with Native Power BI Elements


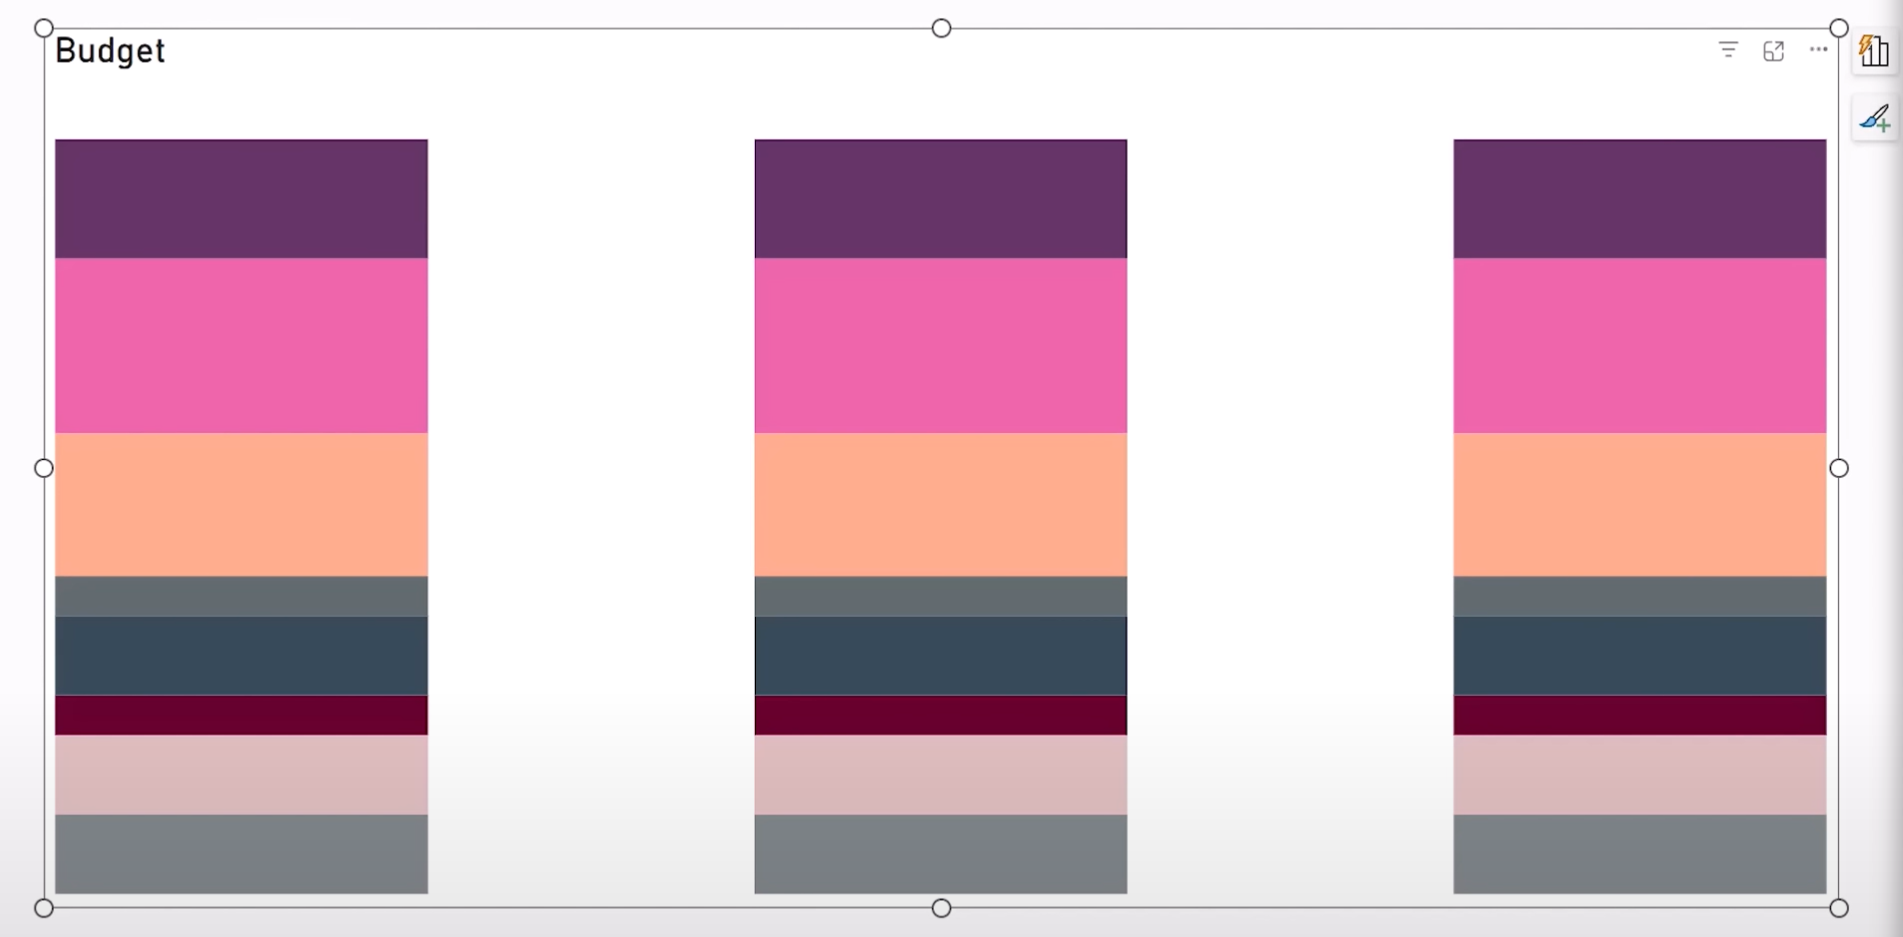
Replace the original fields in your chart with ones from the new Steps Chart:
• Y-axis: Budget Chart (a new measure summing up the helper table's amount)
  • Column series: Step
  • Legend: Team

Turn off axis labels and adjust layout formatting to create visual flow.

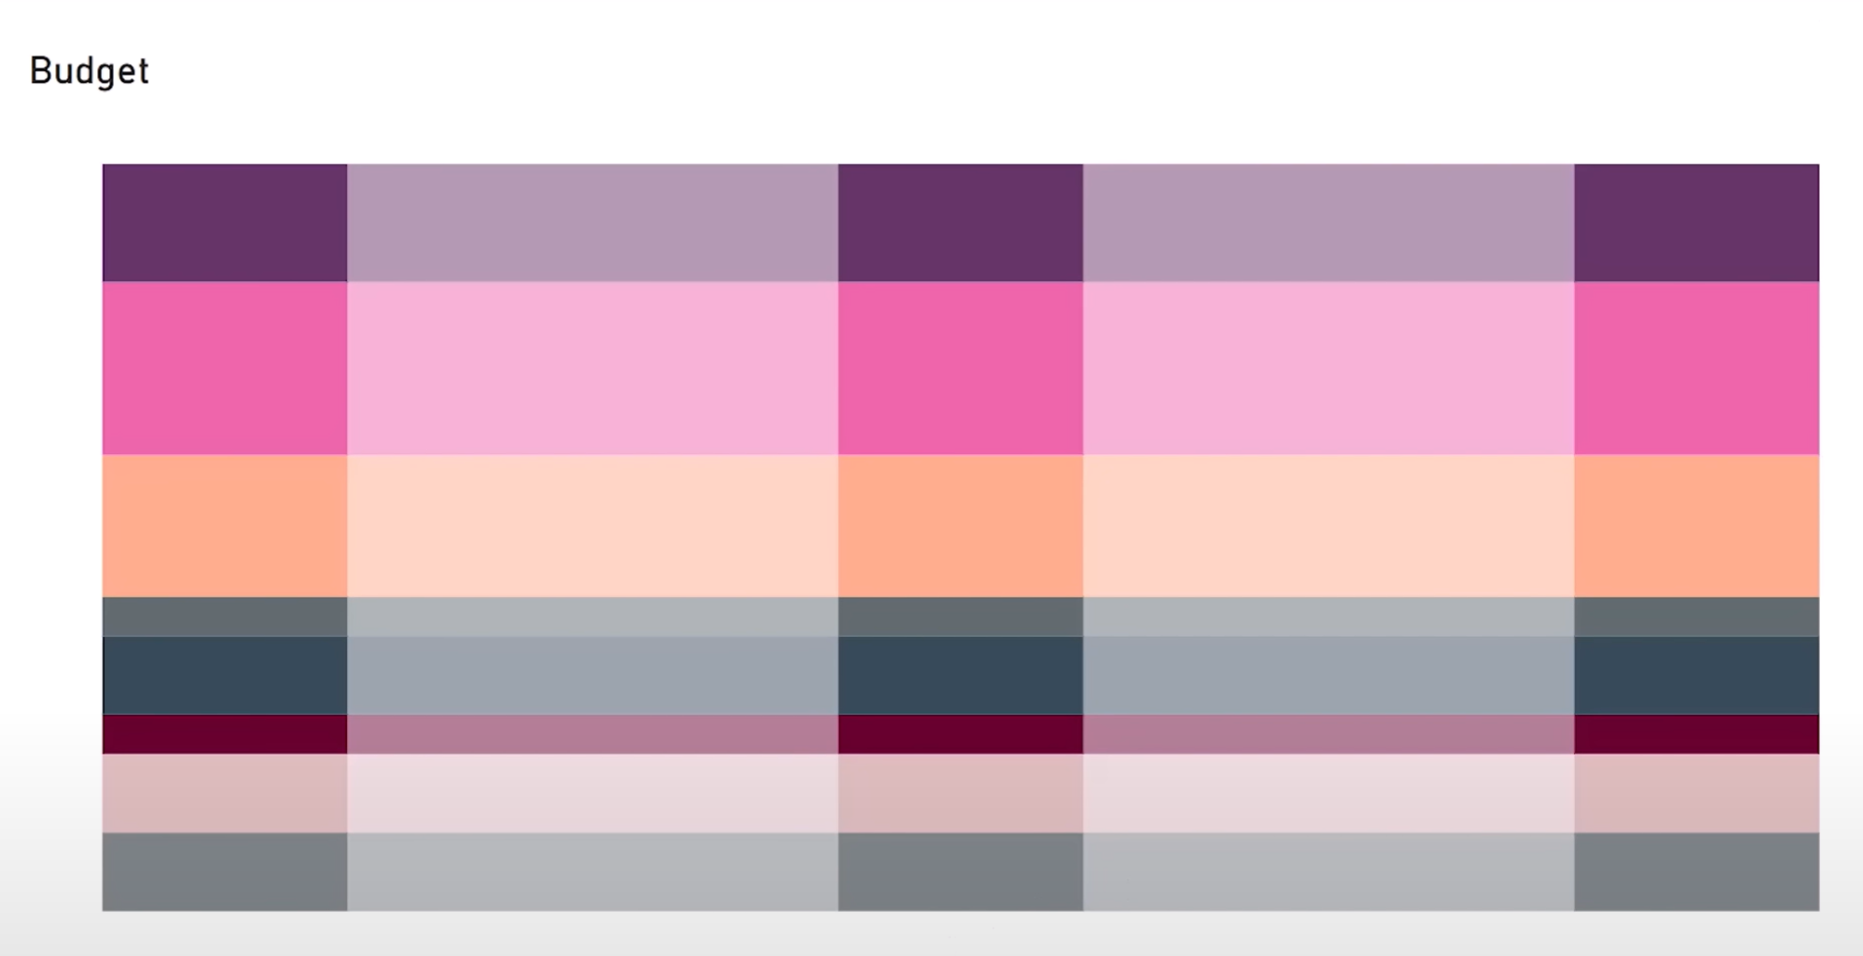
Step 4: Adding Flow with Ribbons

Enable Ribbons in the visual formatting options. Increase transparency and spacing to enhance the flow effect.

Step 5: Creating Space Between Departments


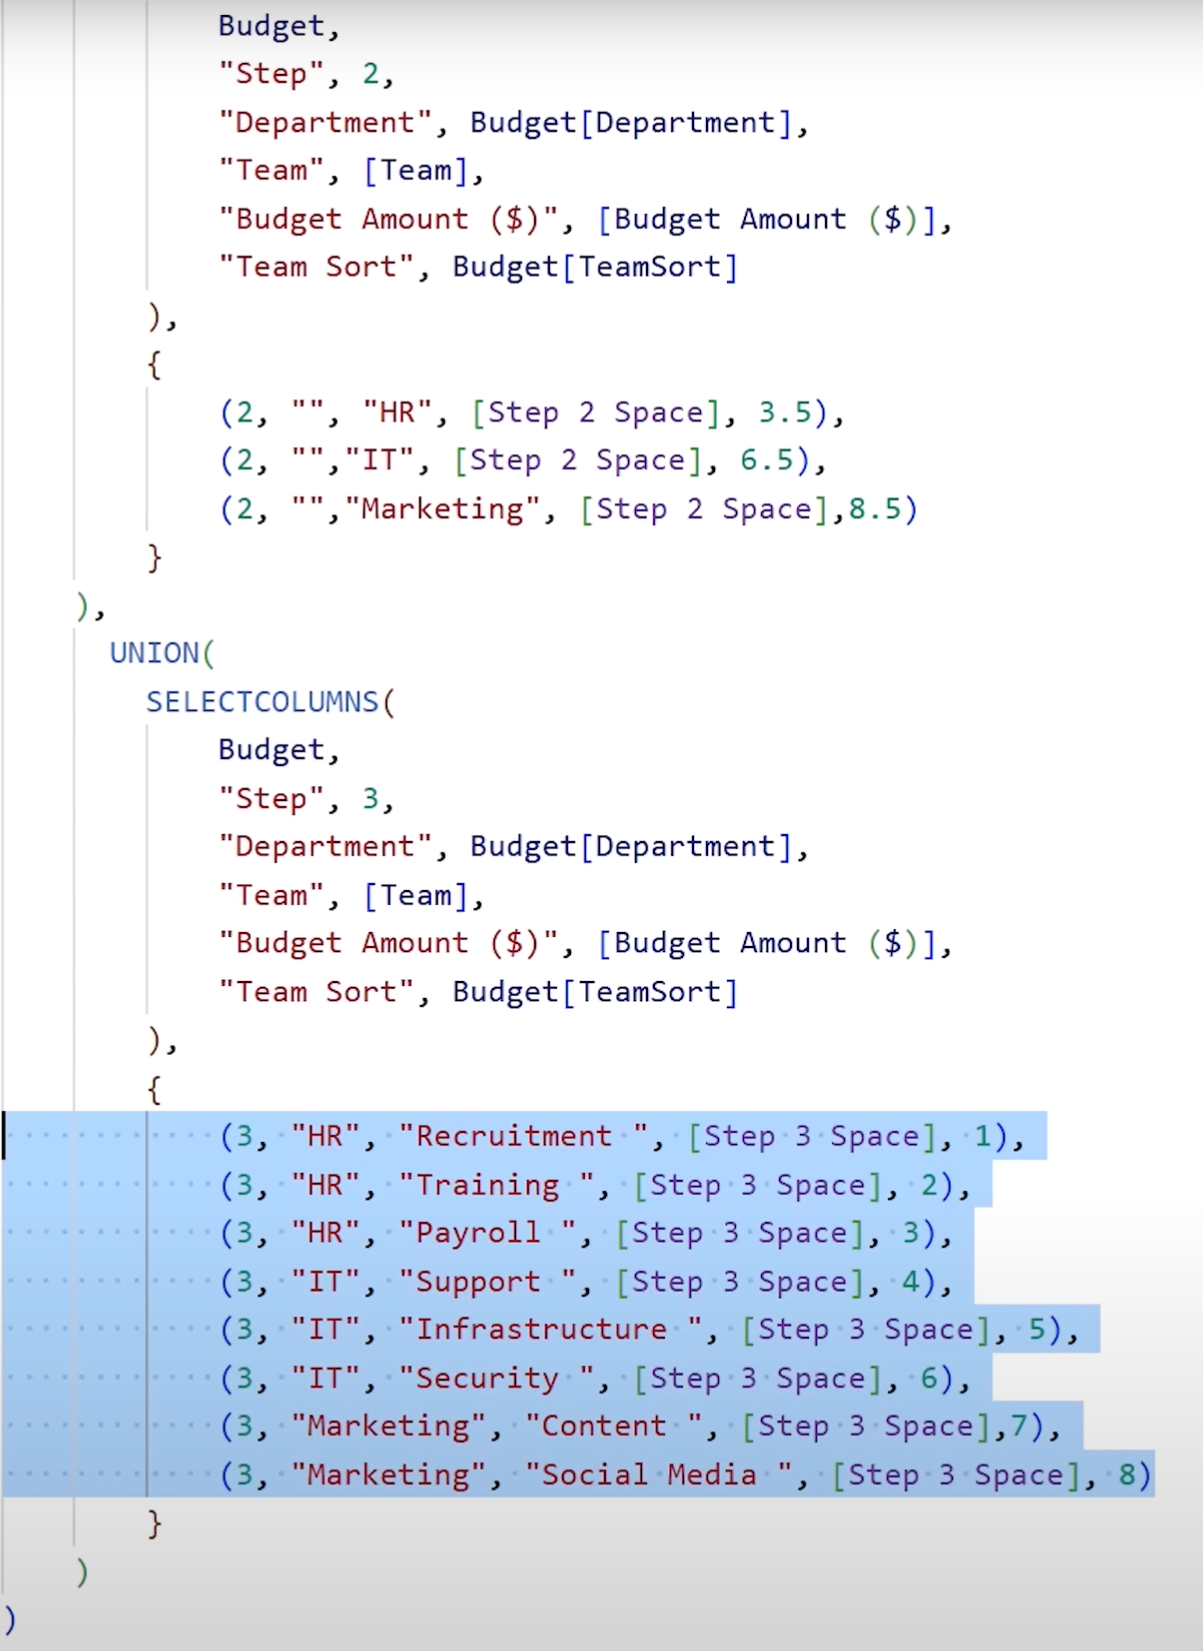
To visually group teams under departments, add “spacer rows” to the helper table using UNION with blank department names and fixed budget values (e.g. 2 million). You can make these values dynamic with measures.
Sort the Team field by a Sort ID column to ensure correct vertical order.

Step 6: Making Spacers Invisible


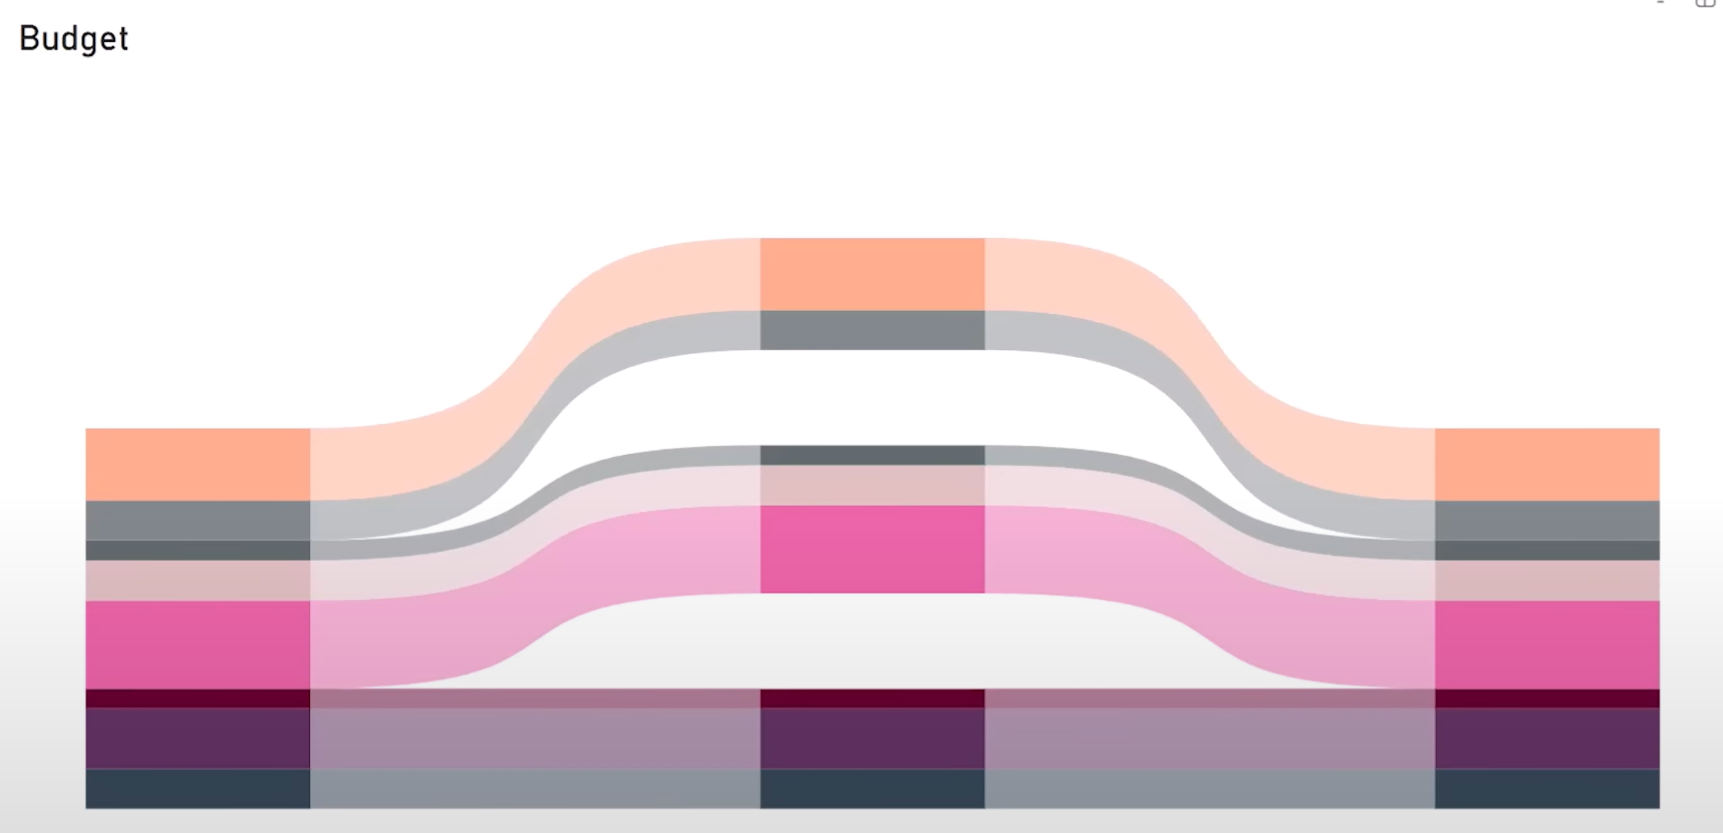
Select spacer bars and make them white in the visual formatting to create space between departmental sections.
Name spacers slightly differently (e.g., "Recruitment Space") to avoid aggregation issues.
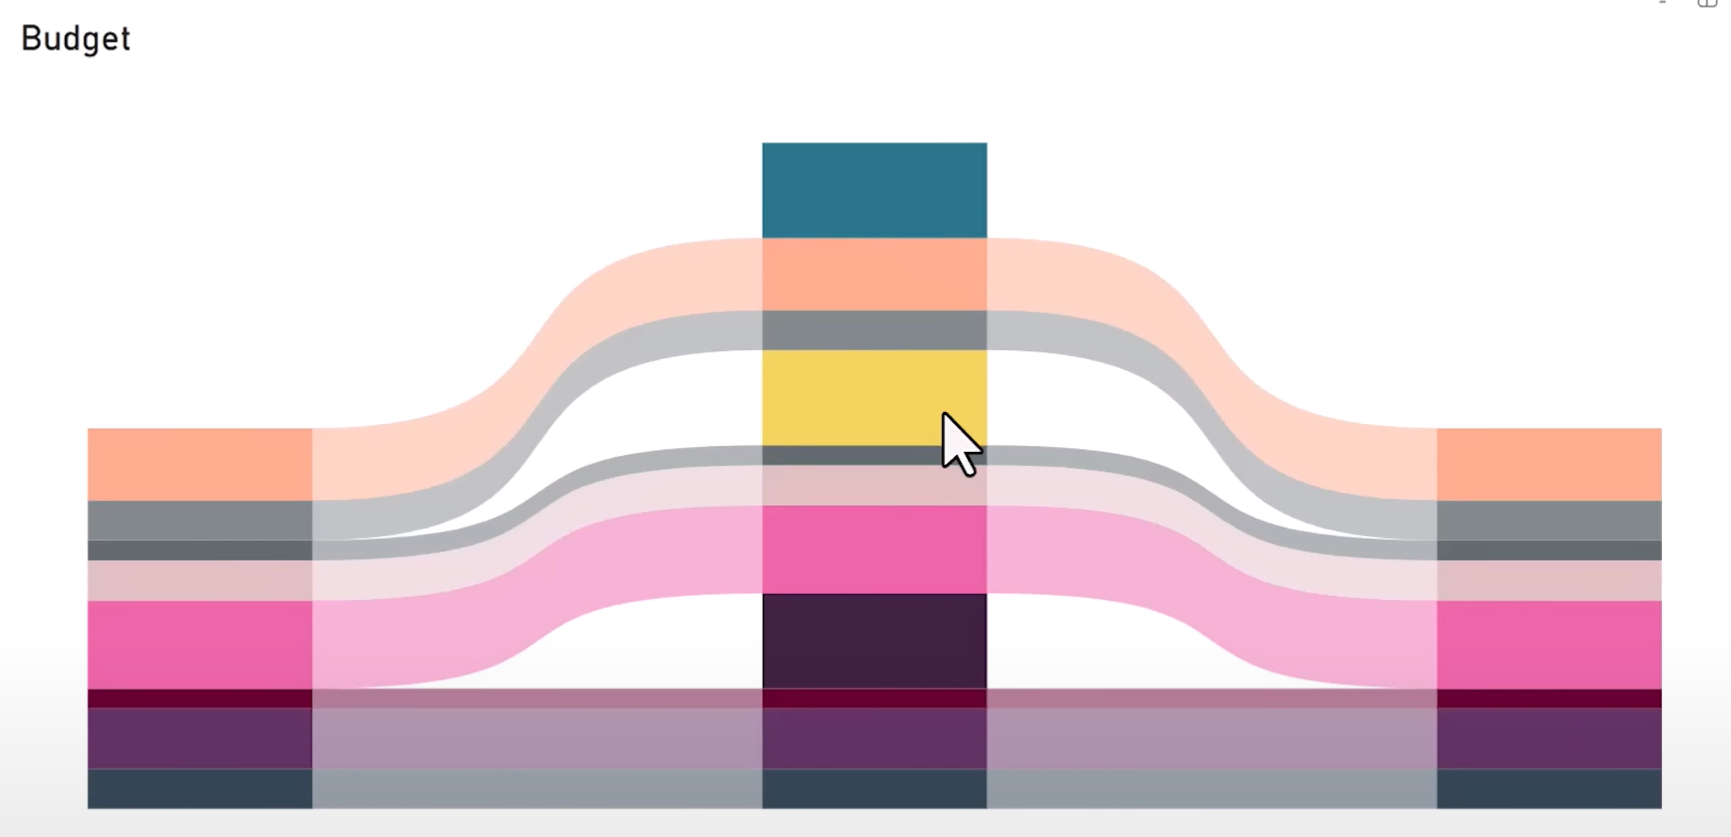
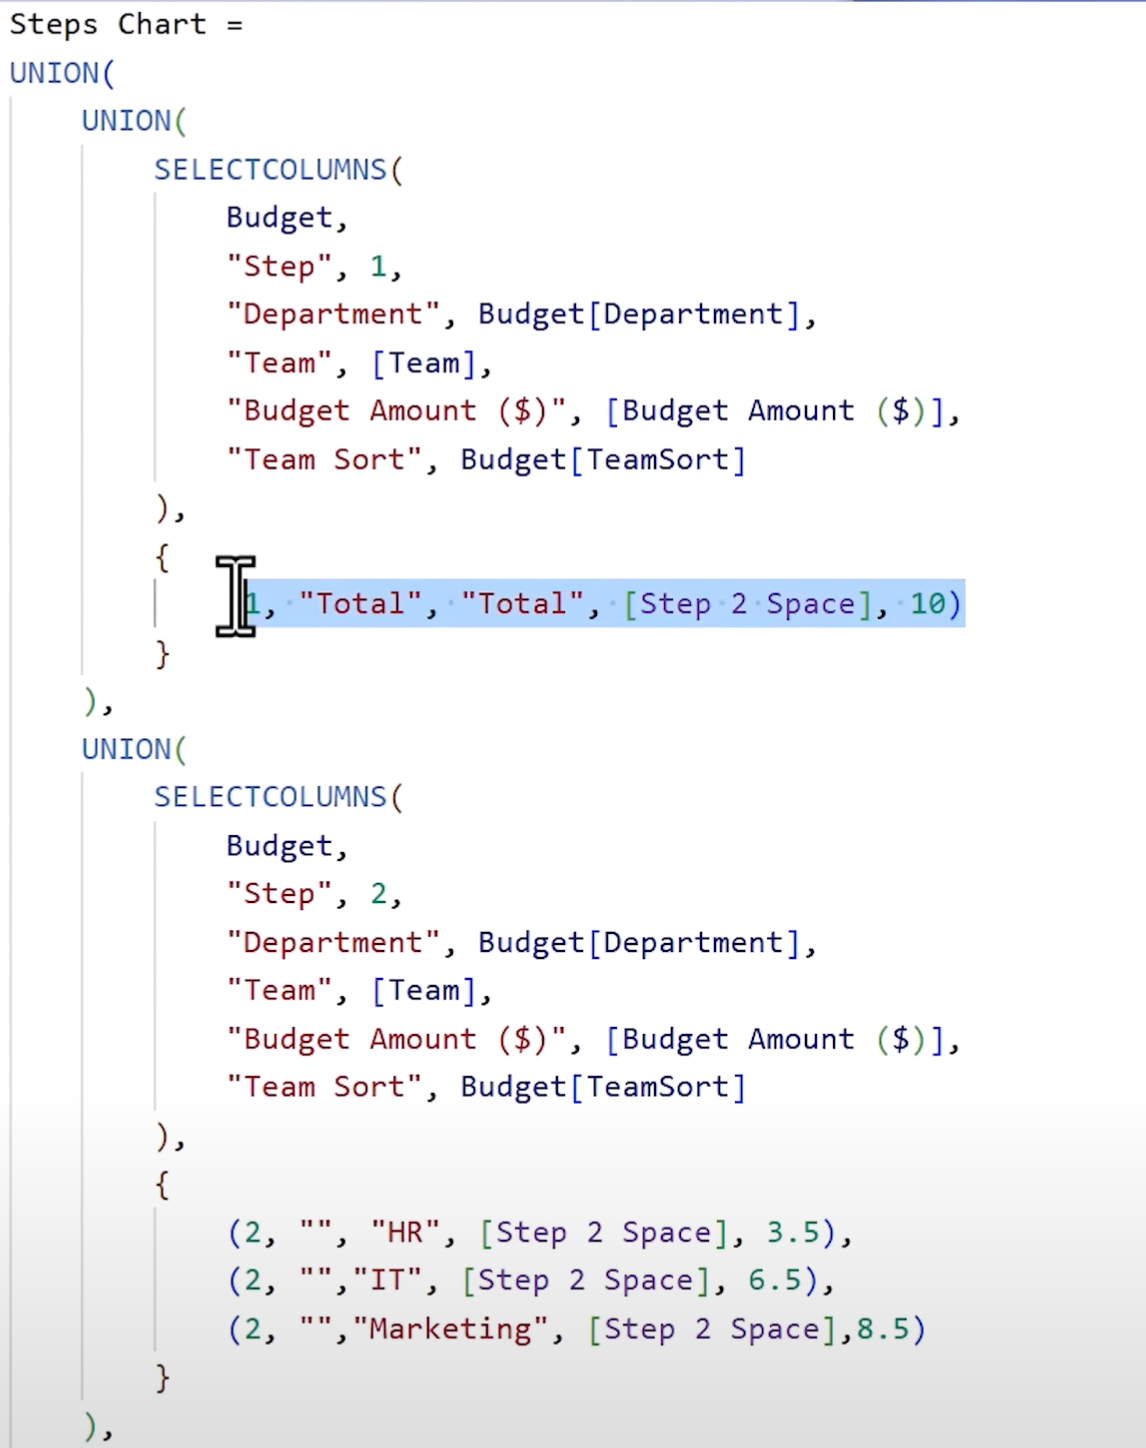
Adjust the rest of the columns by adding the „Total“ for the first column:
And by adding values for the teams to the third column:
Adjust the colors:

Step 7: Adding Department Labels with Dynamic Measures


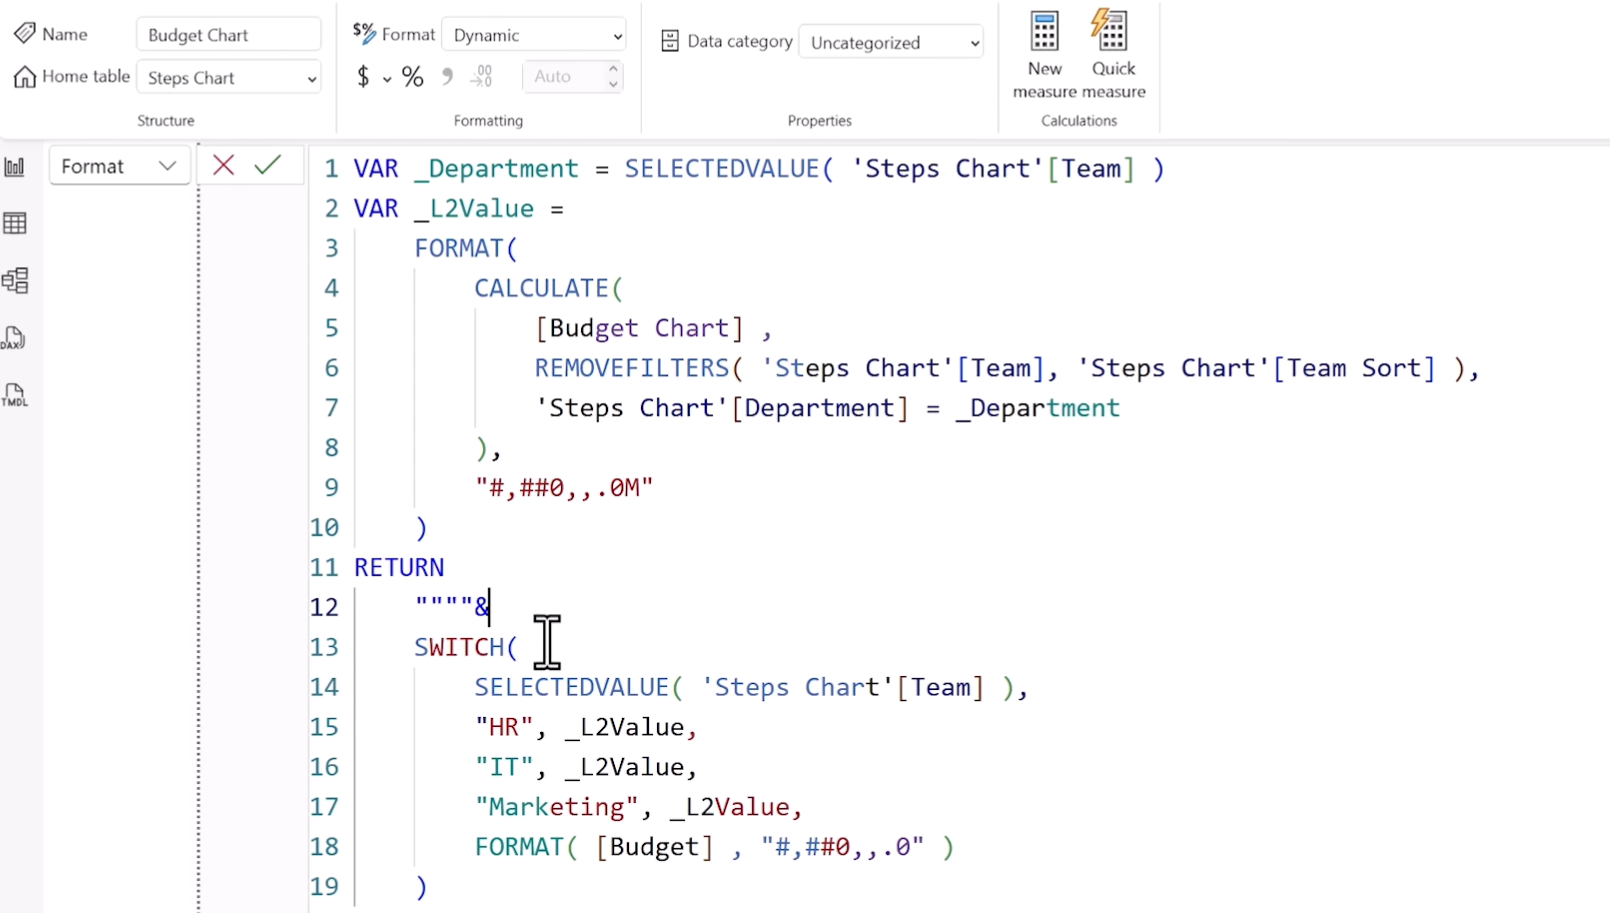
To show department-level totals above the visual, we use dynamic formatting with conditional logic.
This workaround is required because standard data label formatting is limited when using legend fields. Do the same also for the other levels.

Step 8: Alternative: Visual Calculations Instead of a Helper Table


You can build the same chart using only visual calculations and measures but it’s more complex and harder to manage.

Summary

By creatively combining stacked column charts, helper tables, spacer bars, and dynamic measures, you can build a flow-style chart in Power BI without using any custom visuals.

This technique is ideal for high-level presentations or dashboards where visual storytelling matters. Yes, it takes effort but the result speaks for itself.

Hope you like it!

Give it a try and see how it works for you! I’d love to hear what you think or see how you use this trick in your own reports.

How to Power BI

Watch it here

Launch Power BI Reports
that bring your organization
to a fully 
data-driven world.

Power BI Launch

After years of consulting we have developed a holistic solution for launching Power BI Reports in 3 months. From key metrics discovery, to report design, implementation and stakeholders' training. We know precisely how to launch Power BI reports that drive organizations' growth.

Power BI Trainings

Our technical trainings for report developers instantly upskill your teams. Alongside our unique business user trainings the improvement in overall organizational data literacy becomes immediately actionable.

Take your Skills to the Next Level

Power BI Trainings

__________