A big part of the performance comes down to your DAX measures. However, optimizing DAX at an advanced level can be time-consuming and often requires deep expertise.
The good news, Power BI now has visual calculations that are not only easier to understand and write, but also supposedly faster than normal DAX measures in many cases.
Why? Because they operate on aggregated data instead of the underlying tables.
However, I’ve not seen many people testing this for different scenarios to see if it is true and how much faster. So that’s what I did for 3 common calculations with import mode and direct query mode. And to make sure we can clearly see the differences I applied the calculations against a 211 million row table.
Why even compare?
Most of us agree visual calculations are
easier to read and write than many traditional DAX patterns - great for
visual-specific things like dynamic titles, axis scaling, or conditional
formatting. But can they also bail you out when a DAX measure is slow and you
don’t have time to rework it? Let’s test it.
Test setup
- Model: Fact table Sales (~211M
rows) linked to Product, Date, Store, and Customer dimensions.
- Measures tested (3 scenarios):
- Pareto (cumulative % of quantity
by subcategory)
- Moving average (3-year)
- Highlight max & min (visual
cues)
- Visuals: Two identical visuals per
scenario
- Left: traditional DAX measure
- Right: visual calculation(s)
- Method: Power BI Performance
Analyzer + DAX Studio (clear cache between runs to force old
cache; review DAX query timings).
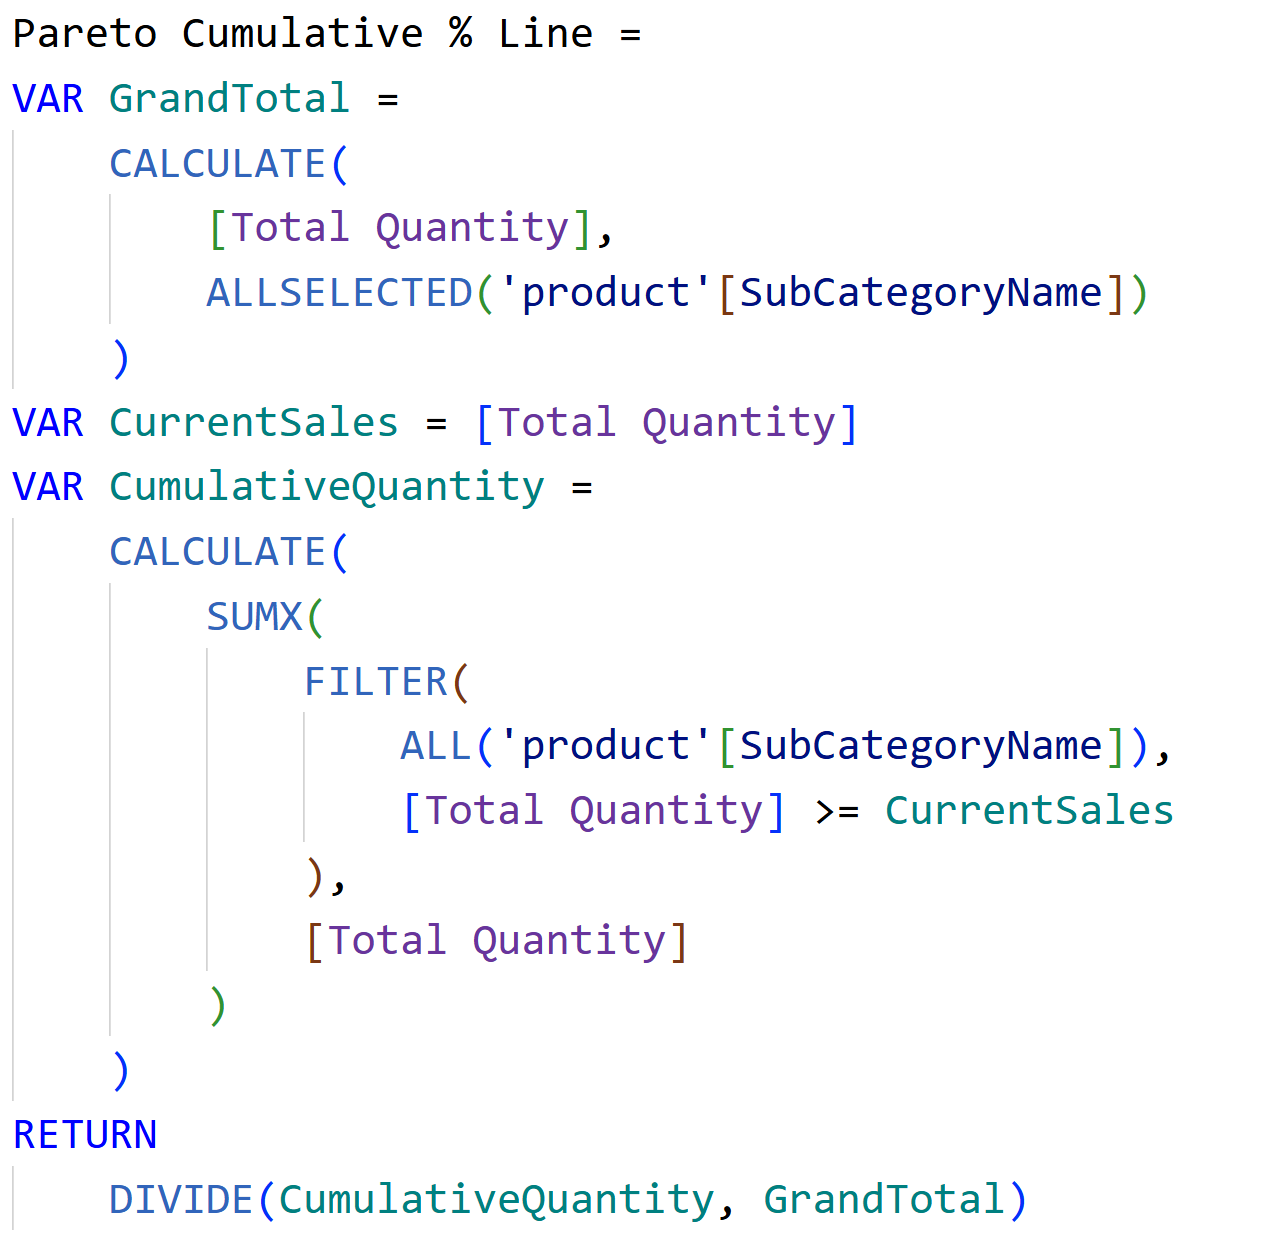
Scenario 1: Pareto (cumulative % of total)
The traditional DAX and the Visual calculation measures are written as mentioned below.

What the timings looked like:
Import mode: Visual calculation was about 2x faster in the visual refresh. In DAX Studio server timings, the DAX query for the visual calc came in around 100 ms vs 400–470 ms for the traditional measure (multiple runs, cache cleared).
Direct Query: The traditional DAX visual took 33 seconds, the visual calculation finished in < 2 seconds.
Takeaway: For Pareto on a large model, visual calculations were consistently faster, with a huge win in Direct Query.
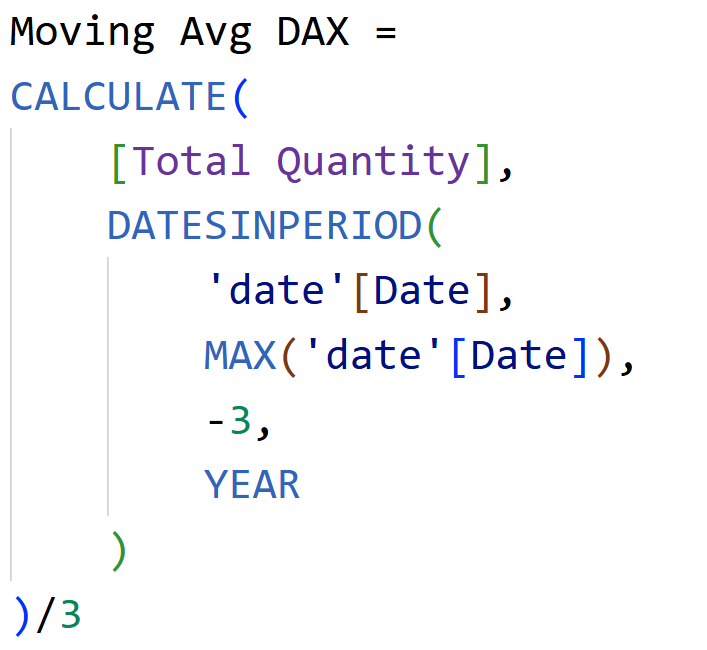
Scenario 2: 3-Year Moving Average
The traditional DAX and the Visual calculation measures are written as mentioned below.

What the timings looked like:
Direct Query: Both took time, but the visual calculation was still faster
- DAX: 4.5 s
- Visual calc: 2.9 s
Import mode (DAX query timings):
o Visual calc around 49 ms
o Traditional DAX around 238 ms
→ >4x faster for the visual calculation.
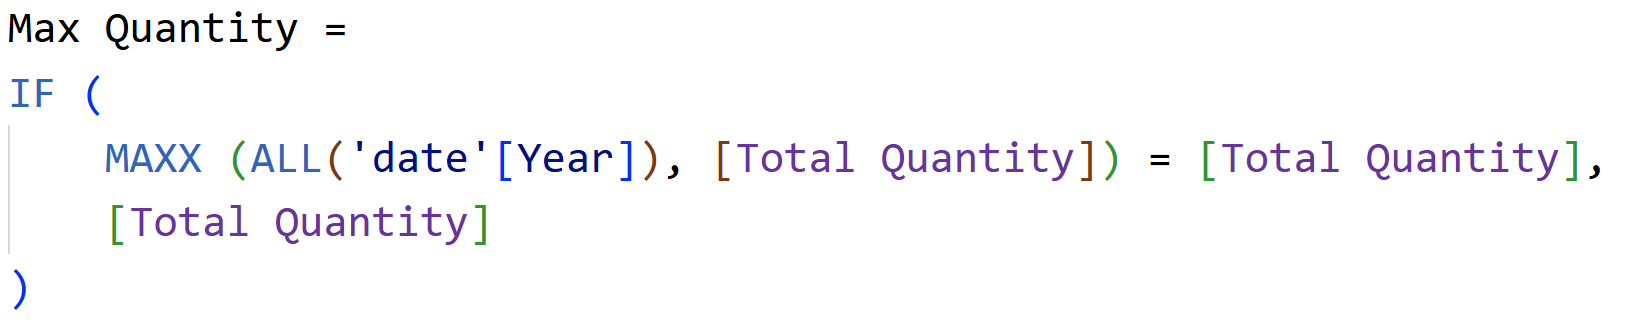
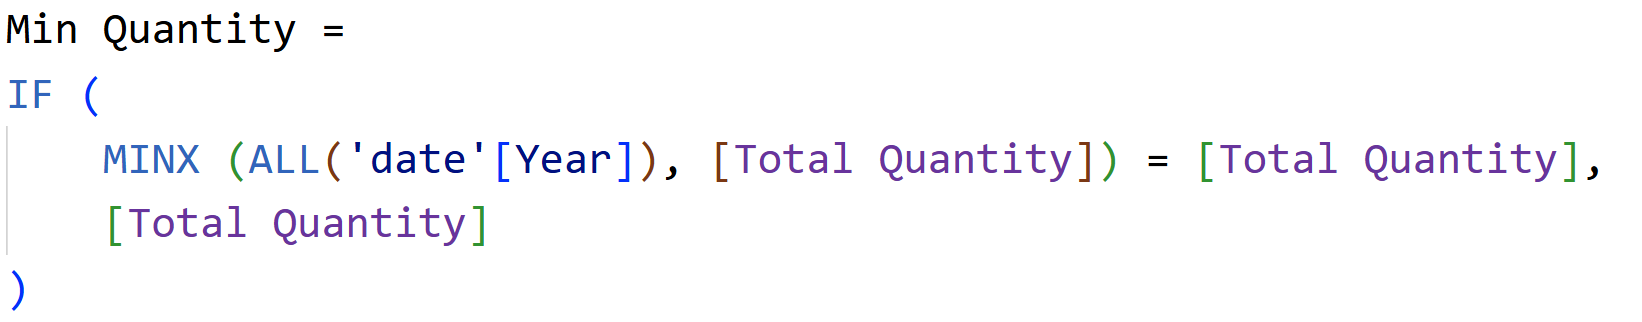
Scenario 3: Highlight Max & Min
The traditional DAX and the Visual calculation measures are written as mentioned below.


What the timings looked like:
Direct Query & Import: Visual calculations were a bit faster, but the gap was small - within tens of milliseconds in Import and modest in Direct Query. Rerunning showed minor variance; not a game-changer here.
Takeaway: The speedups depend on the pattern. For simple highlight logic, gains may be small.
So… why are visual calculations often faster?
Visual calculations operate over the visual’s result set, not the entire fact table. That “small working table” means less data to scan and aggregate.
In traces, you’ll often see:
Traditional DAX: shorter query text but multiple queries and bigger scans when filters require it.
Visual calculations: longer single query, but it prepares a compact result table and then runs the calc on that.
In practice, that smaller scope is where the performance win comes from - especially visible in Direct Query.
When to use visual calculations (and
when not to)
Great for:
- Quick wins when a DAX measure is slow and you don’t have time
to optimize.
- Visual-specific logic (dynamic titles, axes, conditional
formatting).
- Heavy Direct Query scenarios where table scans are painful.
- Patterns like Pareto and moving averages where
running sums/windows over the visual’s rows are a natural fit.
Watch-outs:
- Not reusable: They’re scoped to a
specific visual. If you need the logic across multiple visuals/pages, a
measure might be better.
- Feature maturity: Visual
calculations are still in Preview.
- Complex enterprise models:
Governance and reuse may favor central DAX measures.
Practical workflow you can follow
1. Baseline the visual with your existing DAX measure. Log times in Performance Analyzer.
2. Recreate with a visual calculation (keep the same fields, sort, and filters).
3. Clear cache (DAX Studio) and rerun both - twice. Note both visual timings and DAX query timings.
4. Decide per visual: If the visual calc is clearly faster and you don’t need reuse, keep it. Otherwise, stick to DAX or refactor the measure.
Use visual calculations tactically - they’re visual-scoped and not a replacement for DAX measures.
Hope you like it!
Give it a try and see how it works for you! I’d love to hear what you think or see how you use this trick in your own reports.