
Exploring the Semantic Model in Power BI
Since the October 2023 update, Power BI Desktop now allows you to directly explore the semantic model - no need for external tools like Tabular Editor. With just a few clicks, you can see and interact with things like calculation groups, perspectives, cultures, roles, hierarchies, and even set up incremental refresh partitions.
Oct 20
/
datatraining
This blog walks you through all these features with real examples, including how to:
- Create and use calculation groups
- Set up translations (cultures) for multilingual reports
- Use perspectives with personalized visuals
- Implement security roles
- Configure incremental refresh
- Explore hierarchies and relationships in depth
Let’s dive in.
Prerequisites
To access the semantic model:
1. Make sure you're using Power BI Desktop October 2023 or later
2. Go to Options > Preview Features and enable:
- Model Explorer
- Calculation Group Authoring
3. Then open the Modeling view, where you’ll find a new toggle to switch between "Tables" and "Model".
1. Calculation Groups – Time Intelligence
Without Repetition
Calculation groups let you define one set of time-based calculations (like YTD, YOY, YOY%) and reuse them across multiple measures.
Example:
You want all of these to support the same time calculations, without writing a dozen measures manually.
Here’s how to create a group:
Last Year example:
LY = CALCULATE(
SELECTEDMEASURE(),
DATEADD( dimDate[Date], -1, YEAR)
)
Once all calculation items are defined, rename:
Calculation groups let you define one set of time-based calculations (like YTD, YOY, YOY%) and reuse them across multiple measures.
Example:
- RefActuals
- RefForecast
You want all of these to support the same time calculations, without writing a dozen measures manually.
Here’s how to create a group:
- Go to Calculation Groups > + New Calculation Group
- Confirm the warning about implicit measures
- Add items like "Current Year", "Last Year", "YOY", "YOY %", "YTD"
Last Year example:
LY = CALCULATE(
SELECTEDMEASURE(),
DATEADD( dimDate[Date], -1, YEAR)
)
Once all calculation items are defined, rename:
- The calculation group → Time Intelligence
- The column with item names → Date Calculations
You can test calculation groups using a matrix visual by placing a measure - in my case, Rev Actuals - in the values area, and adding the calculation group we created to the columns.
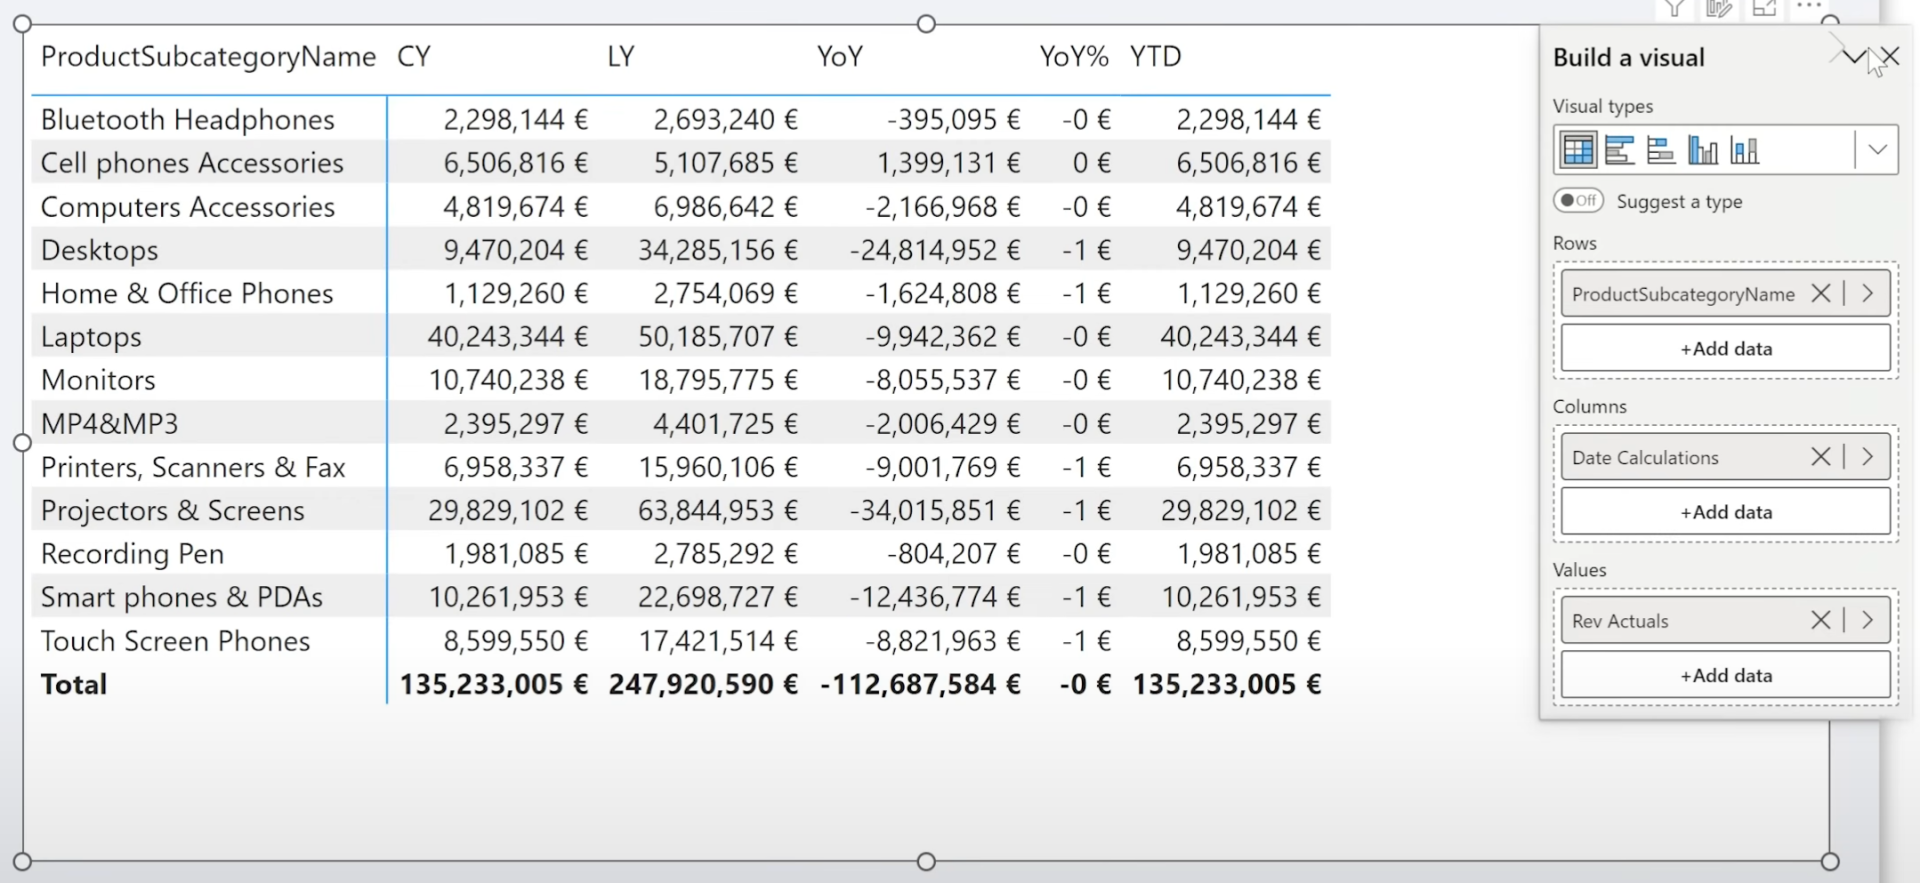
In Data View, you’ll see this appears as a regular table with two columns:
• Date Calculations (items like YTD, YOY, etc.)
• Ordinal (for sort order)
You might notice that some outputs (especially YOY %) don’t look right. To fix this, we can use dynamic format strings directly in the semantic model.
Steps:
1. Go to the Modeling view
2. Select a calculation item (e.g., YOY %)
3. Enable Dynamic formatting
4. Choose Format string definition
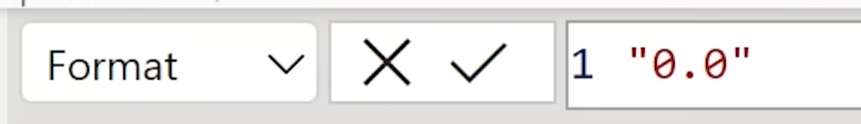
Define dynamic format strings for each item to control formatting:
• "YOY %" → 0.0%
• "CY" and other measures which you want to format in millions → #,##0,,.0M
These show up as columns when used in a visual, or you can use a slicer instead.
2. Cultures – Multilingual Reports
In the Model view, you can now see the active culture (e.g., en-GB). This is set when the report is created and controls language-dependent behavior, like string comparisons.
To add translations (e.g., for Dutch), you’ll need Tabular Editor 2 (free).
Steps:
1. Open model in Tabular Editor
2. Right-click → New Translation → Choose language (e.g., nl-NL)
3. Go to a table, select a column
4. Set Translated Names (e.g., Sales Amount → Omzet)
Once published, users who change their display language in Power BI Service will see the translated field names.
3. Perspectives – Focused Views for Users
Perspectives let you define custom views of your model—a subset of fields/tables for personalized visuals.
Enable personalized visuals:
• Settings > Report settings > Personalize visuals = ON
• Also turn it on in Format pane per visual
1. Right-click Perspectives → New → e.g., Subset
2. Choose only specific columns/tables to include
In Power BI Service, users with personalized visuals enabled will only see fields in that perspective when customizing a visual.
Note: Perspectives are not security features. They just improve user experience.
Once you've created a perspective and enabled personalized visuals, publish your report to Power BI Service.
In the Service:
• Hover over a visual
• Click the “Personalize this visual” icon (assuming the developer has allowed it)
Now you can:
• Change chart type (e.g., switch bar chart to matrix)
• Add or remove fields on the axes
• Customize visuals to your preferences
Example:
You want to see data as a matrix instead of a chart? Just switch visual type.
You want to add columns? Only the fields included in the perspective are shown.
"Add column" panel showing limited fields from the Subset perspective
From DimStore, you might see all fields; from DimChannel, maybe only one (Channel Name) - depending on how the perspective was defined in Tabular Editor.
Important: A perspective is not a security feature. It doesn’t restrict access, only controls what is visible in UI for personalization.
So by combining perspectives and personalized visuals, you offer business users a more focused, user-friendly experience tailored to their needs.
4. Roles – Row-Level Security (RLS)
You can create security roles directly in Power BI:
• Go to Modeling > Manage roles
• Create a role like:
'DimProduct'[ProductCategory] = "Computers"
After publishing, assign users/groups to this role in Power BI Service (Dataset > More options > Security).
Assign the role to people:
5. Hierarchies – Drag & Drop Made Simple
You can now view and edit hierarchies directly in the semantic model.
To create one:
• Right-click on a column (e.g., Year) → Create hierarchy
• Add other fields (e.g., Quarter, Month) via drag & drop
6. Incremental Refresh – Now with Partition Visibility
You can now see and manage partitions visually with the semantic model (after publishing to a Premium workspace).
Steps:
1. In Power Query:
-- Create parameters: RangeStart, RangeEnd
-- Filter your DateTime column using these
2. In Power BI:
- Model view > Incremental Refresh
- Set up archival and incremental ranges
3. Publish to Premium workspace
4. Trigger a dataset refresh
5. Use Tabular Editor to connect to XMLA and inspect partitions
Final Thoughts
The semantic model in Power BI Desktop has become a powerful, integrated space for managing your data model - from calculations to cultures to refresh optimization.
What you used to need external tools for, you can now do mostly within Power BI itself.
And if you still need Tabular Editor for certain tasks, it complements the new interface well.
Hope you like it!
Give it a try and see how it works for you! I’d love to hear what you think or see how you use this trick in your own reports.
How to Power BI
Watch it here

COMPANY
Write your awesome label here.
Embedding Power BI in Power Point
Intro Session