What Are Dynamic Format Strings in Power BI?Dynamic Format Strings allow you to change how numbers are displayed
based on logic, like showing different currency symbols for different countries, or switching between thousands/millions depending on user selection.
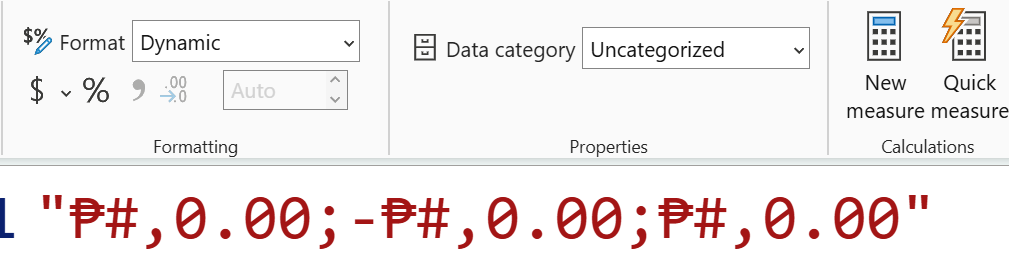
How It WorksEach format string is made up of
three parts separated by semicolons:
Positive Format ; Negative Format ; Zero Format
For example:
"$#,0.00;($#,0.00);$0.00"
- 0 (zero) is a mandatory placeholder - if there’s no digit, a 0 is shown.
- # (hash) is an optional placeholder - nothing is shown if there's no digit.
- You can add thousand separators using commas ,.
- Currency symbols or suffixes can be placed anywhere in the string
Let’s explore several use cases and how to implement them step-by-step.
1. Displaying Different Currencies with One Measure
Suppose you have a measure like total sales, but you want to show it in different currency symbols depending on the country.
Option 1: Using a Hardcoded Switch Expression
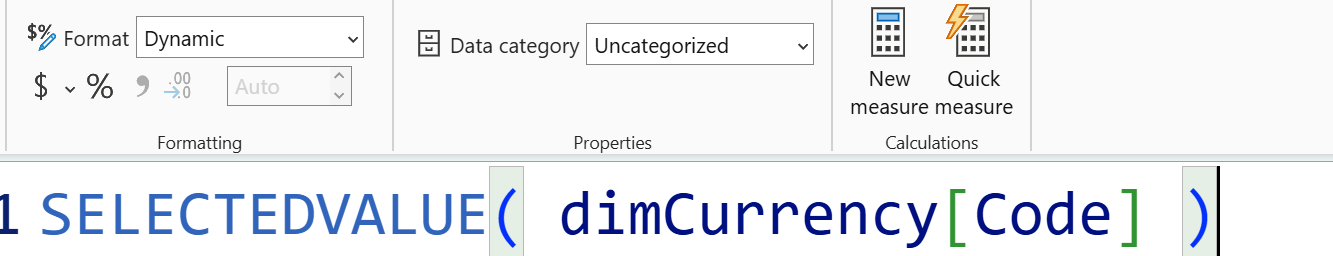
Start by selecting your measure → Format → Format string expression → Dynamic.
You’ll use a SWITCH(TRUE(), ...) structure with SELECTEDVALUE() to identify the country and apply the correct format string.
SWITCH(
TRUE(),
SELECTEDVALUE('Food Prices'[Country]) = "Philippines", "₱#,0.0",
SELECTEDVALUE('Food Prices'[Country]) = "Armenia", "֏#,0.0",
"#,0.0"
)
This works well, but gets hard to manage as more countries are added.
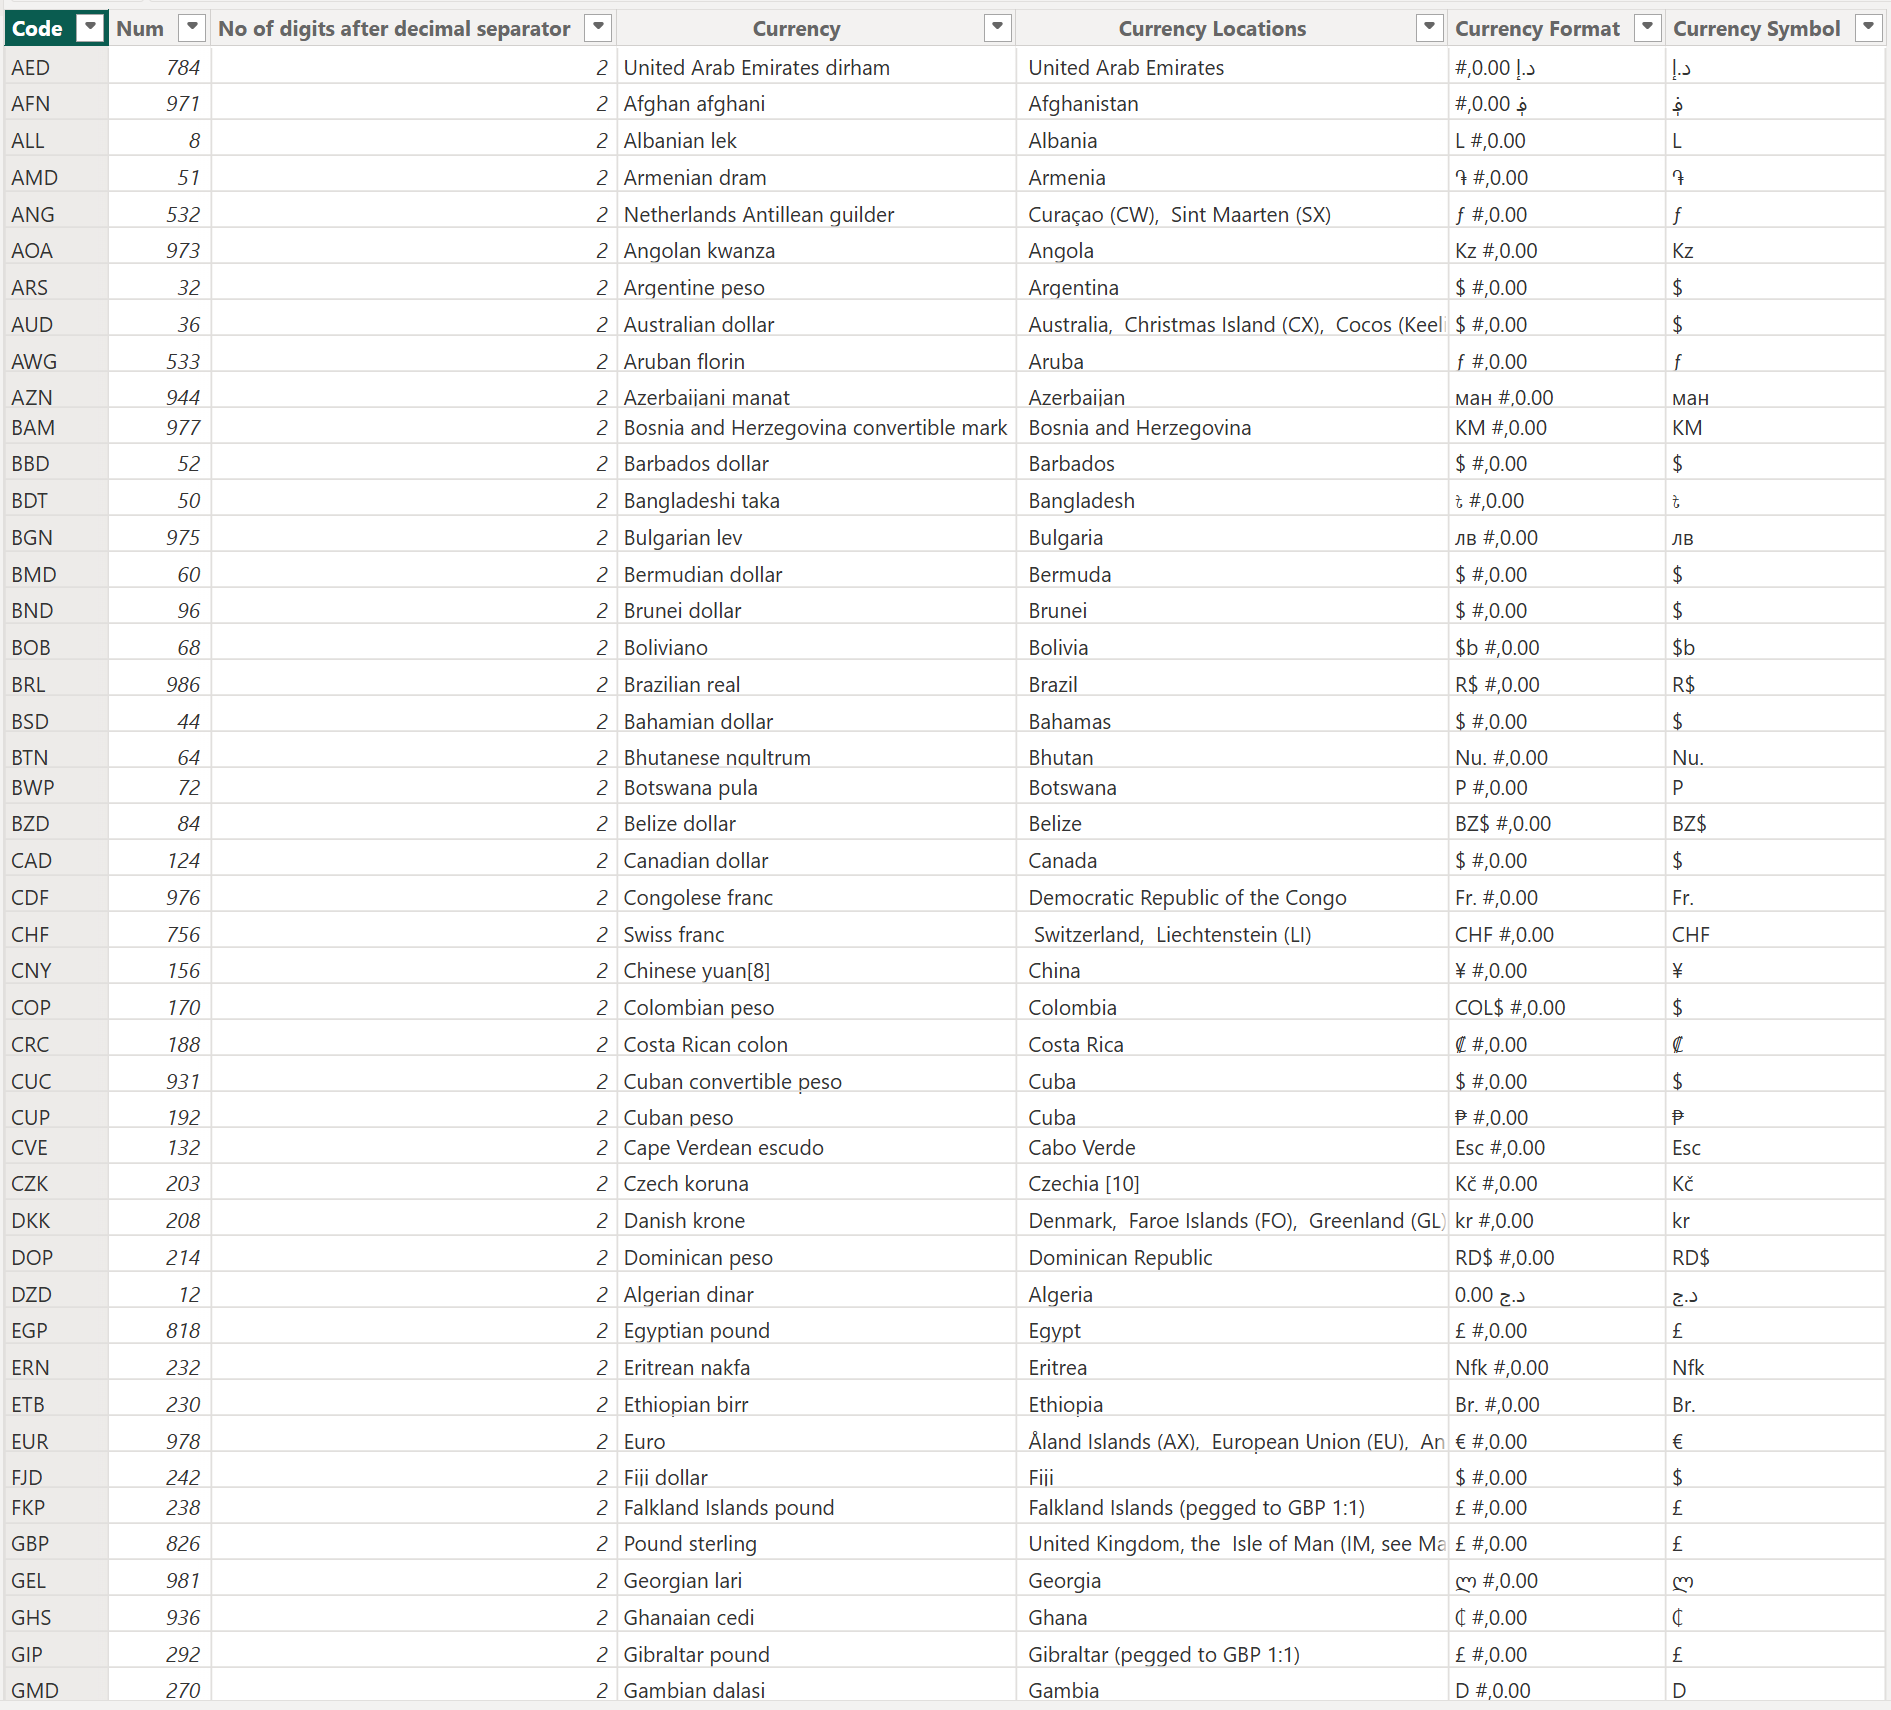
Option 2: Using a Currency Table (Recommended)
Create a Currency Table with:
- Currency Code
- Currency Format String
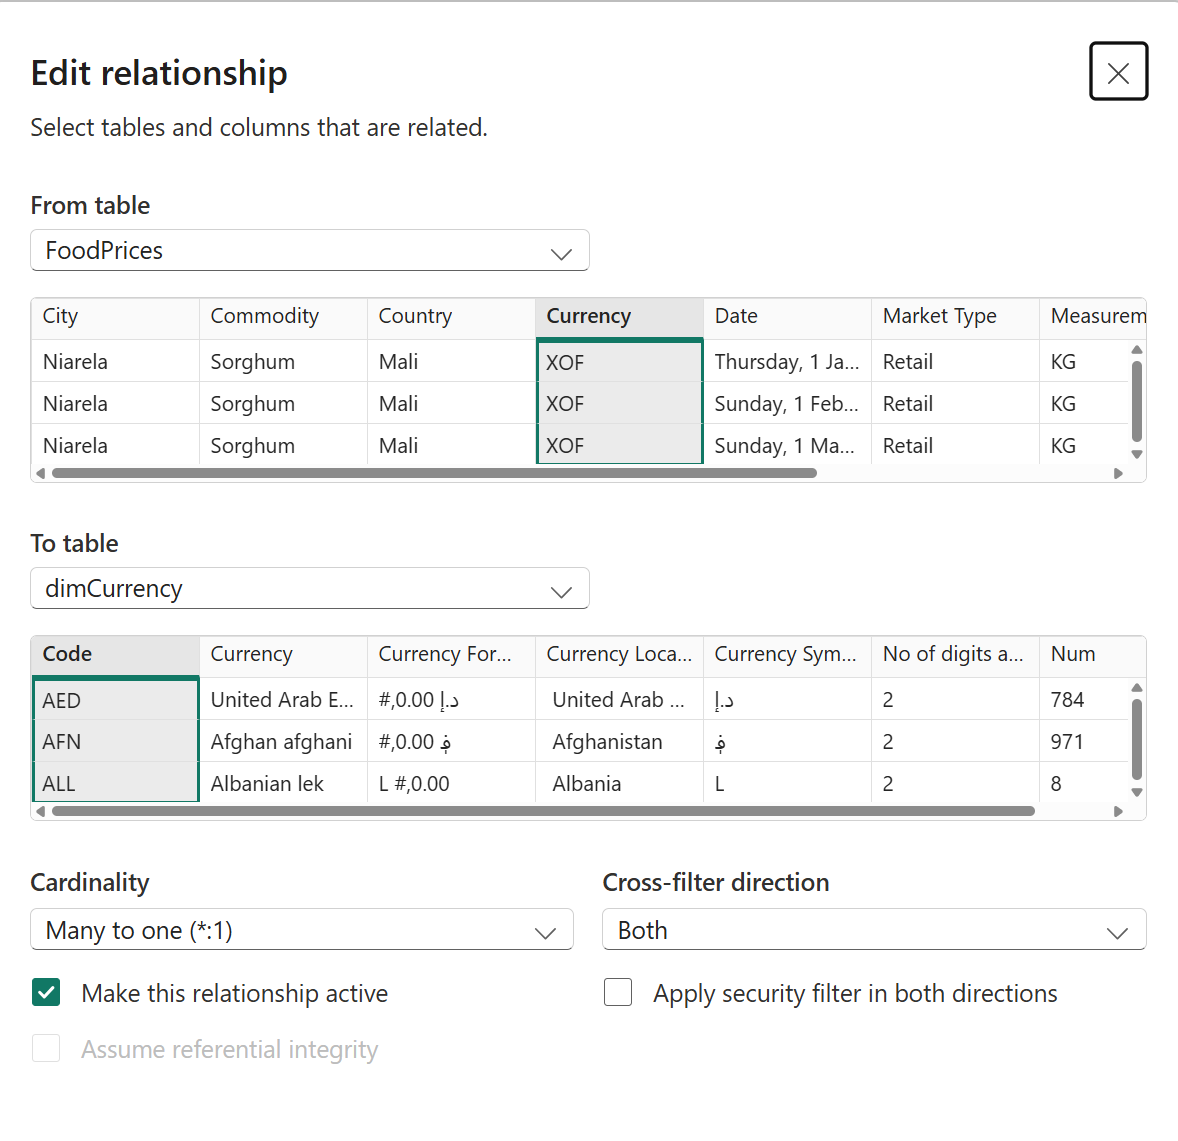
Then relate it to your main fact table using currency code, and set cross-filter direction to Both.
Now update your format string expression to:
SELECTEDVALUE('Currency Table'[Currency Format])
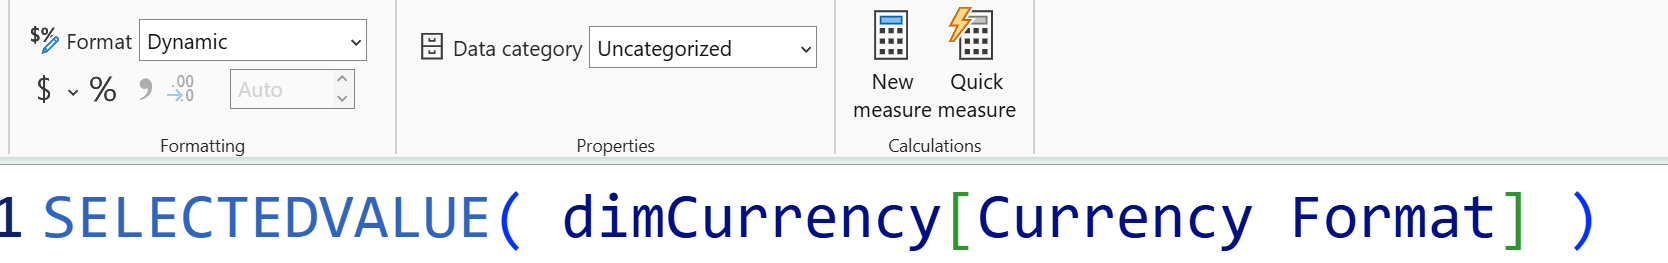
Much cleaner and scalable.
2. Switching Between Thousands and Millions
Sometimes you want to show values in
different units depending on user selection.
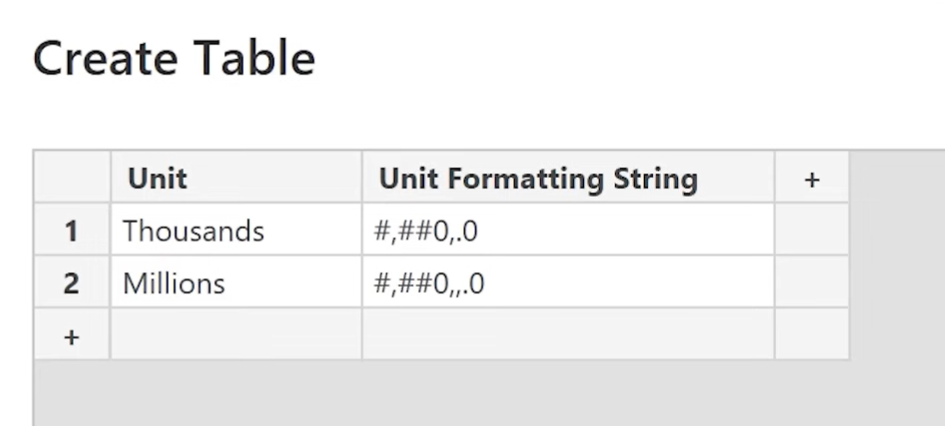
Step 1: Create a Unit Table
Create a simple two-column table:
- Unit: Thousands, Millions, None
- Format String: Corresponding DAX formatting string (e.g. #,0.0,K, #,0.0,,M)
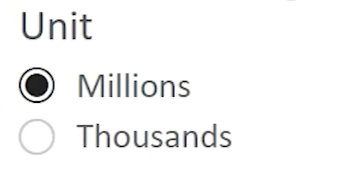
Step 2: Add a Slicer
Add the Unit column as a slicer, and set it to single select.
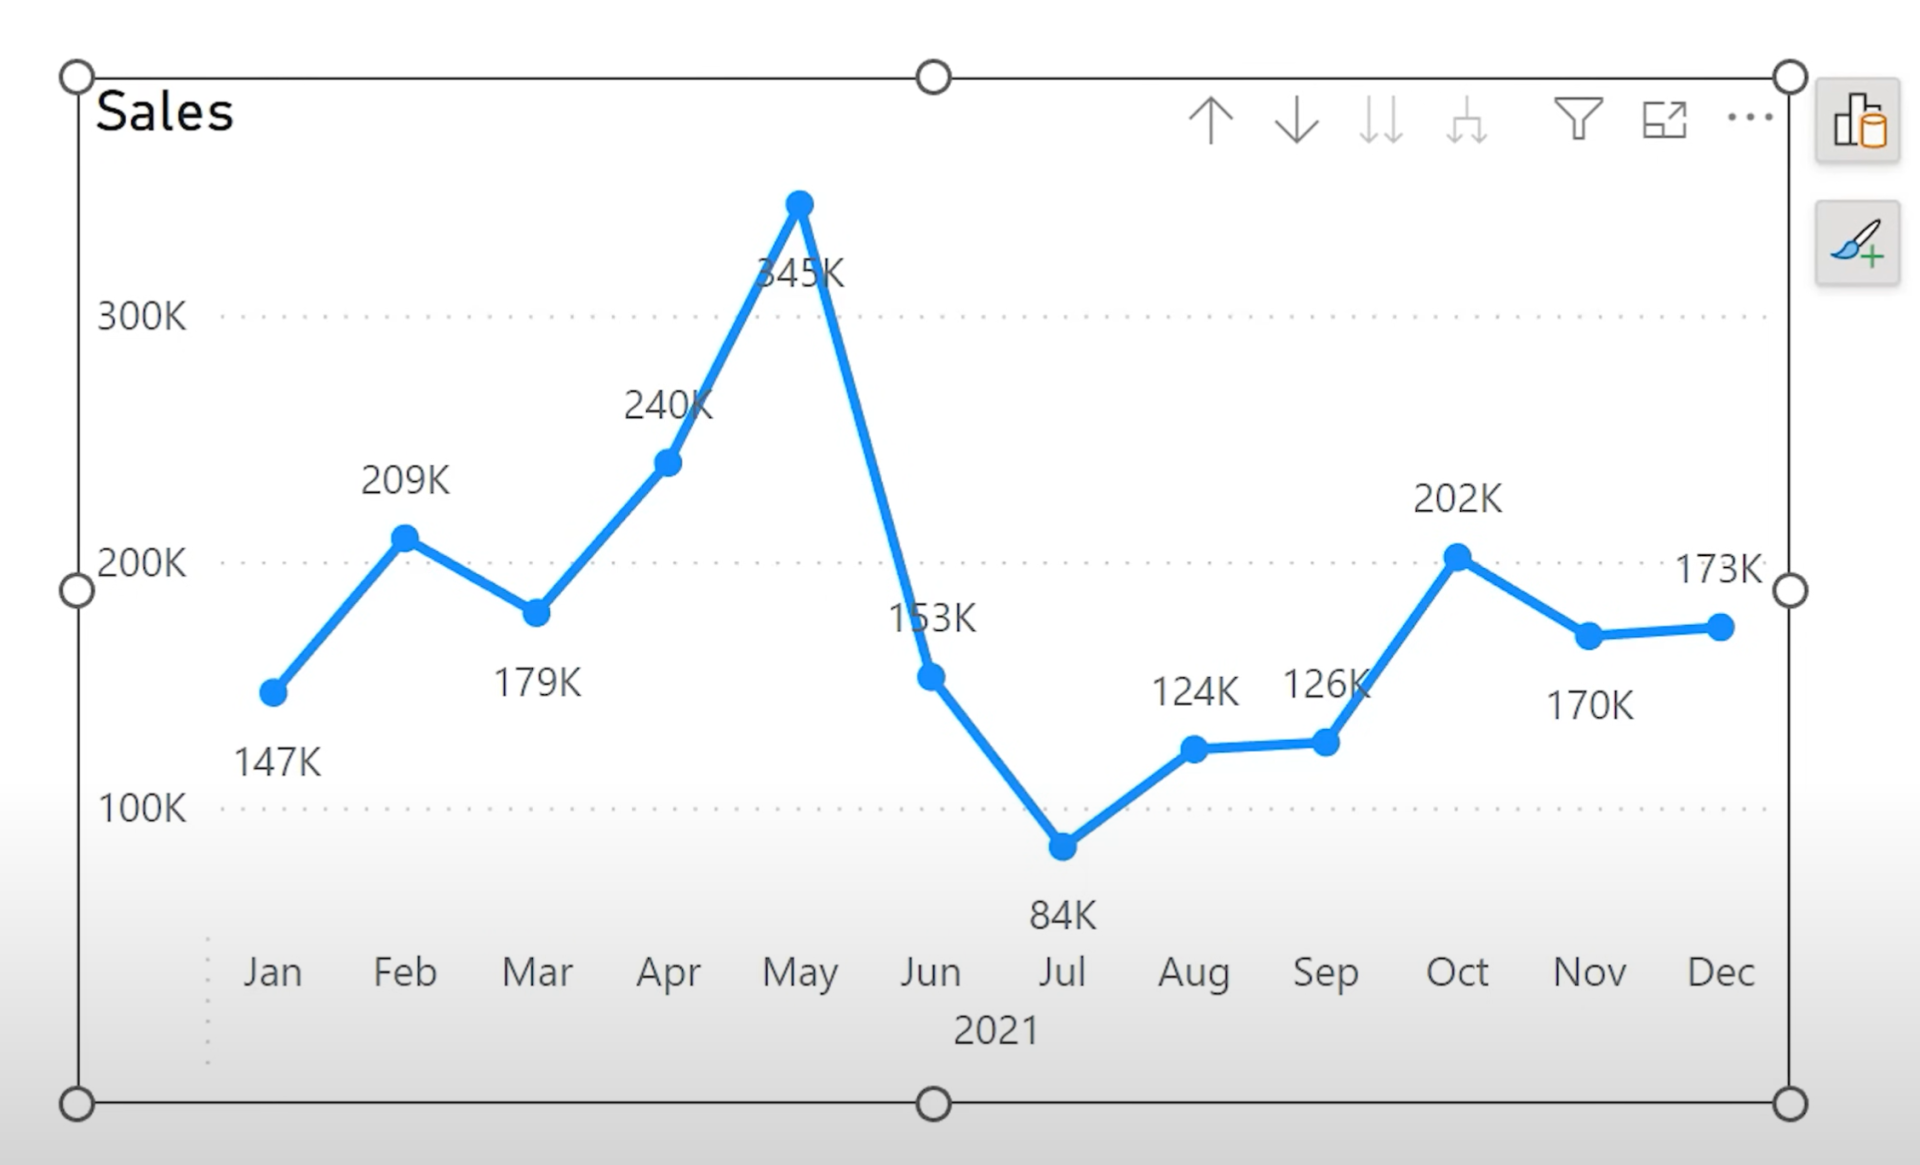
Step 3: Use in Dynamic Format Expression
SELECTEDVALUE('Units'[Format String])
Now your measure values update based on the unit selected in the slicer.
3. Using Dynamic Format Strings for Data Labels
You can even use format strings to control the content of data labels, such as adding year-over-year growth next to total sales.
Step 1: Combine Values Using Variables
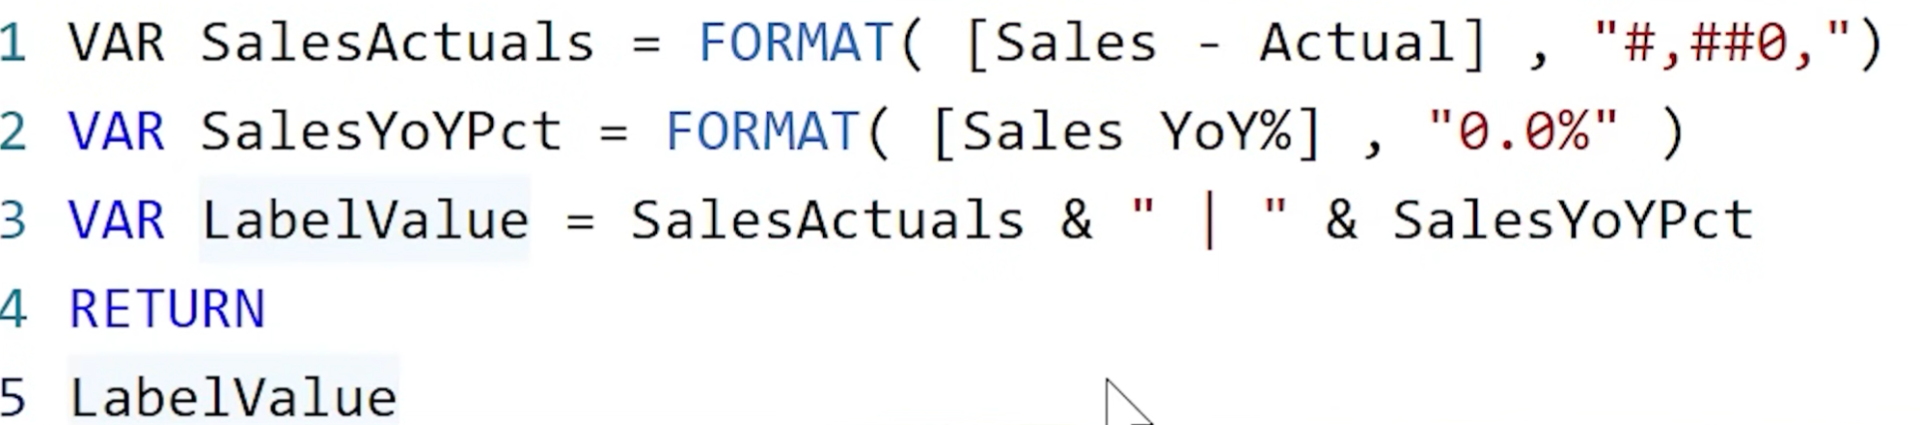
The four double-quotes """" trick ensures that the return is interpreted as text, not a formatting string.
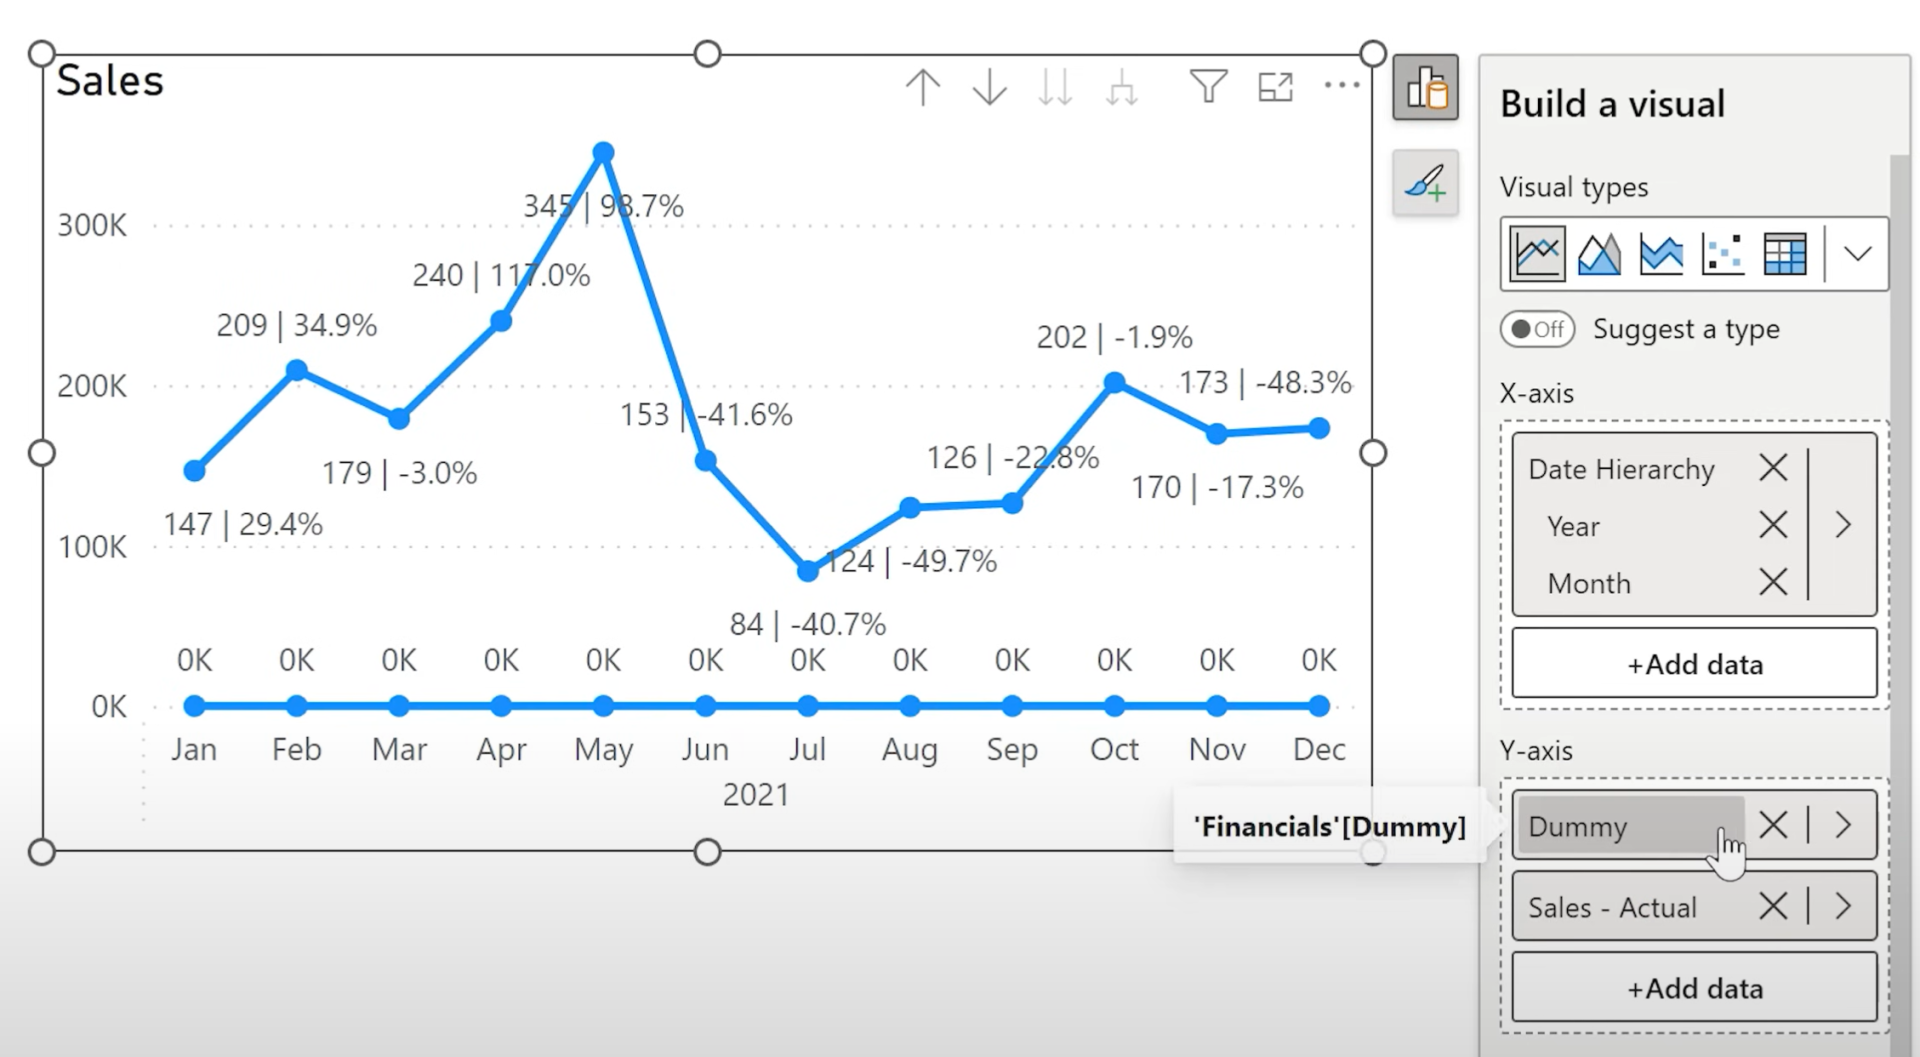
Step 2: Fixing Axis Issues
Dynamic labels might cause issues with the Y-axis. You can fix this by:
- Creating a dummy measure that returns 0
- Adding the dummy to the visual before the main measure
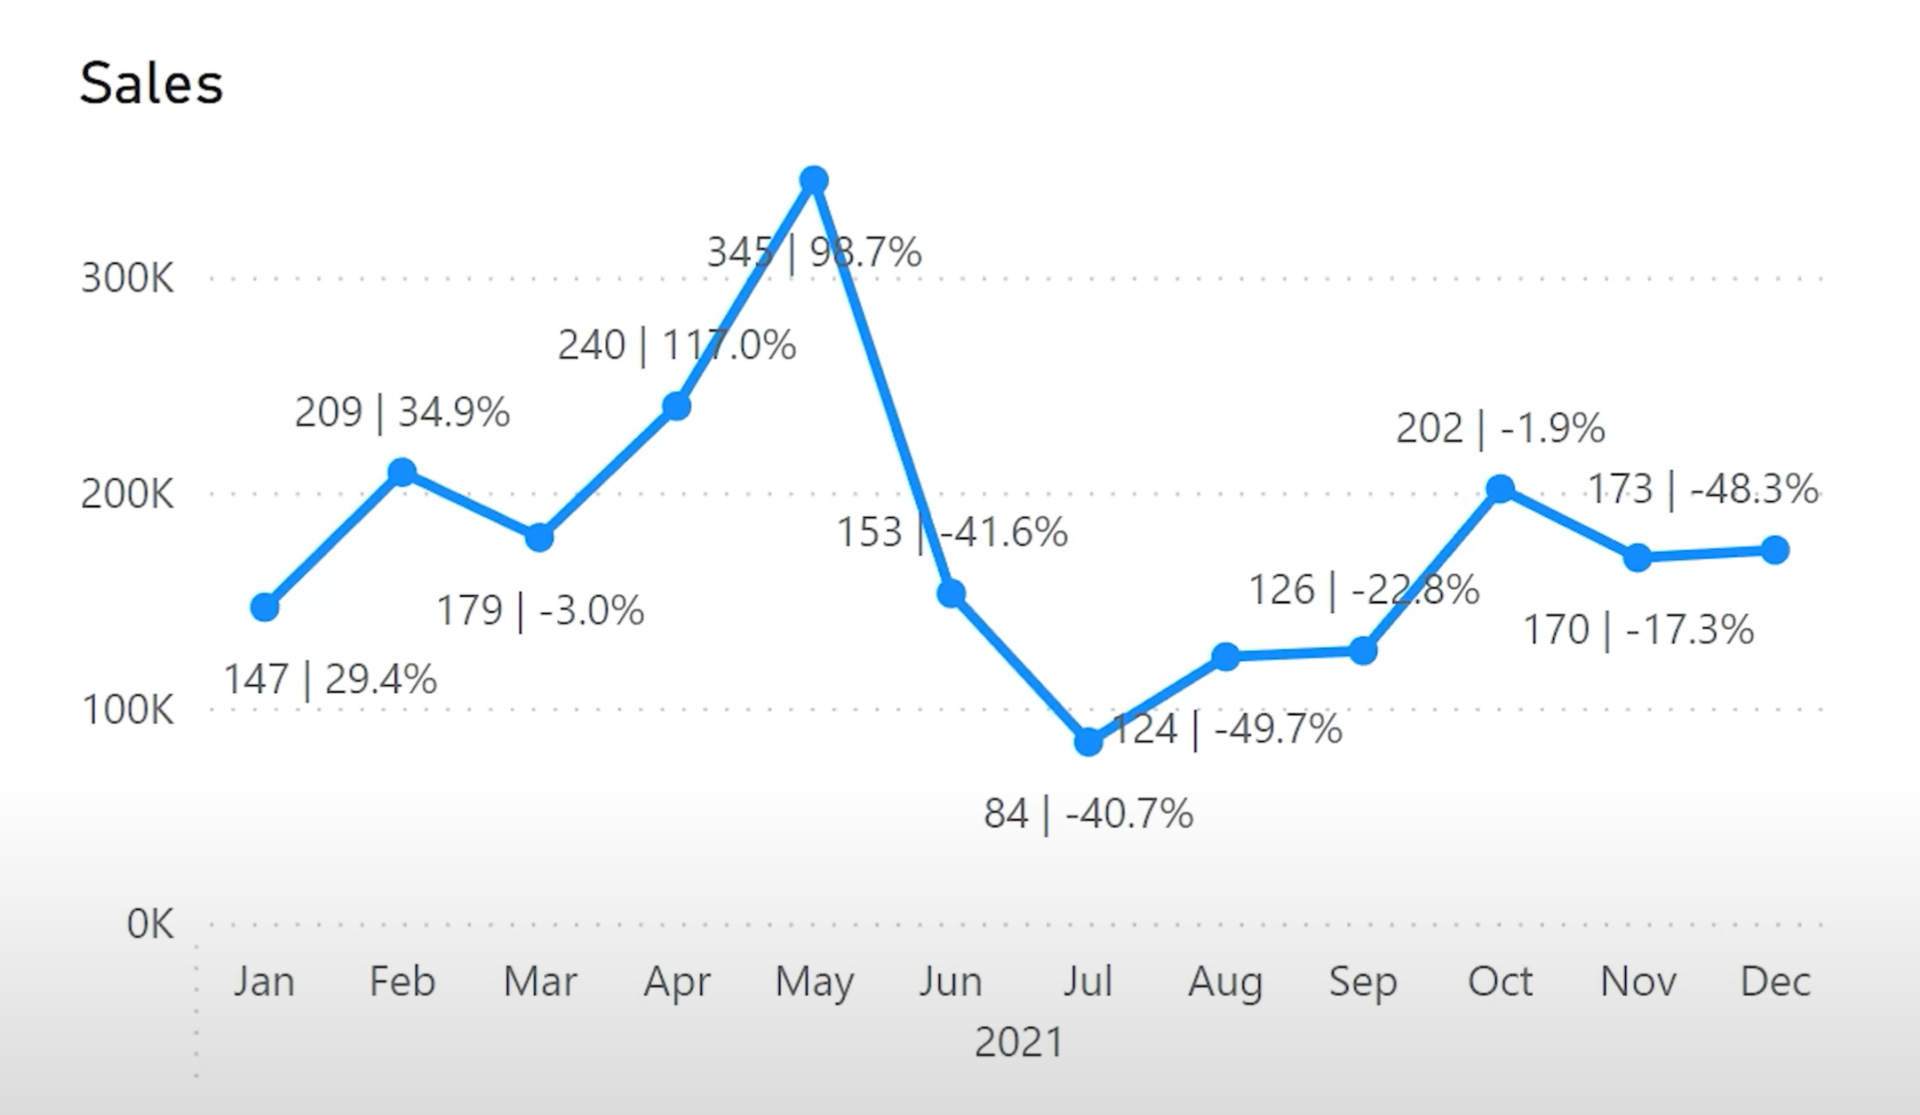
Then:
- Hide line and markers for the dummy series
- Disable its data labels
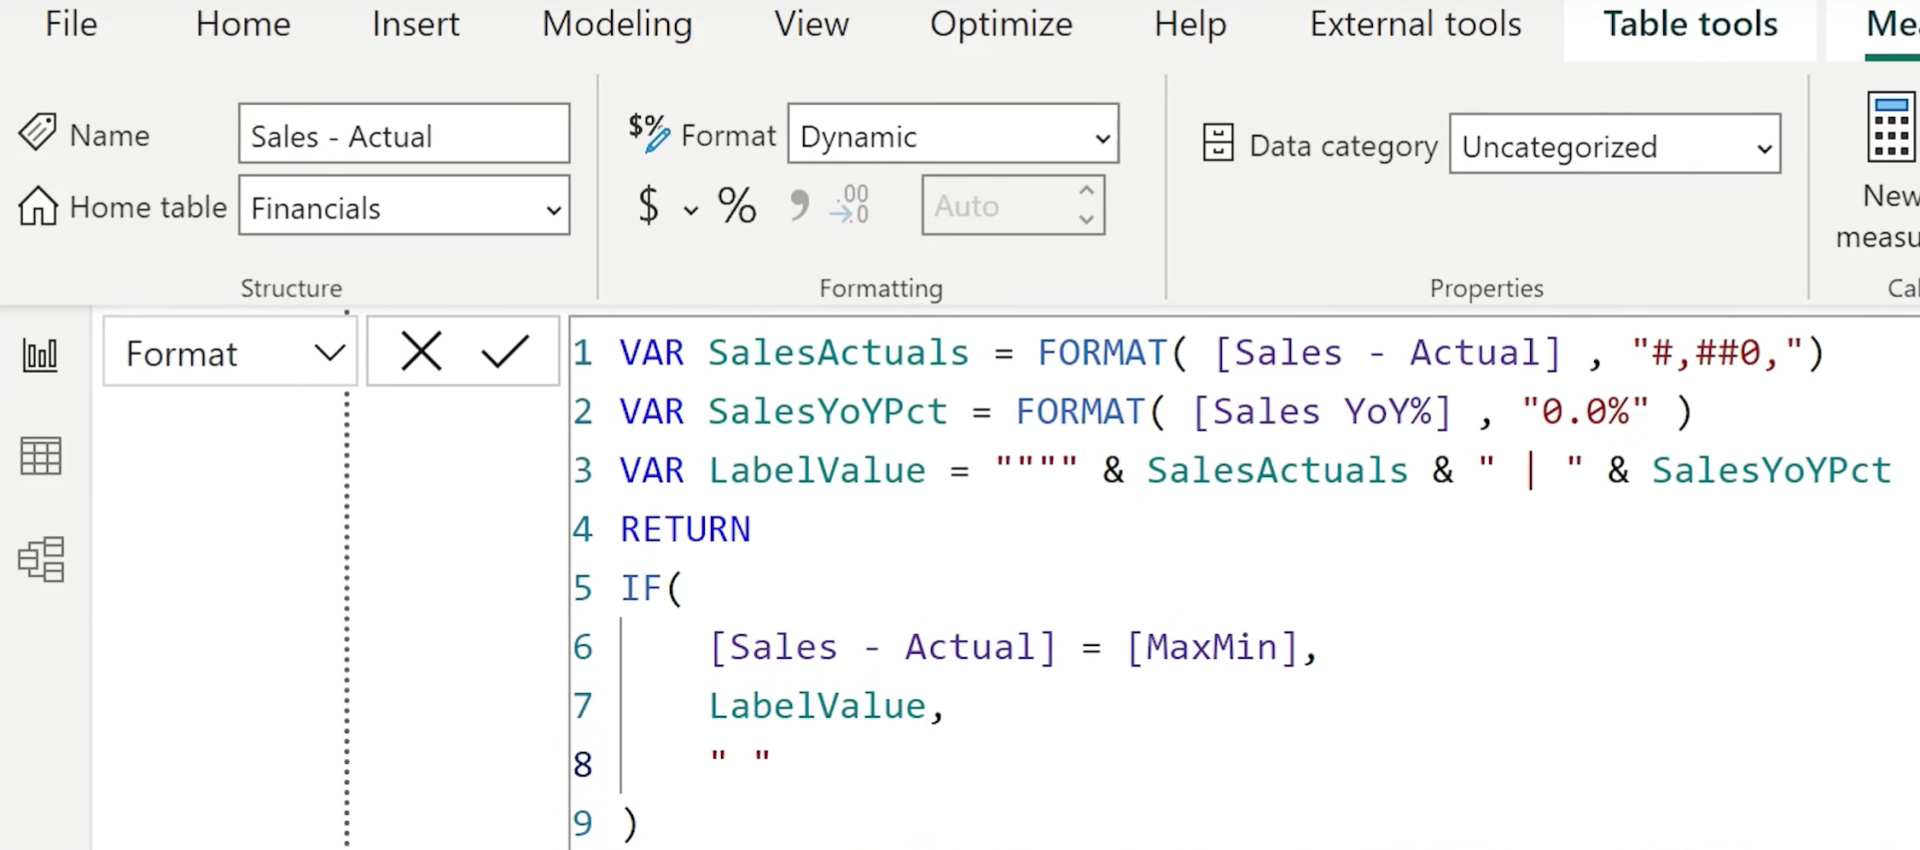
4. Optional: Display Labels Only for Max/Min Values
Final Thoughts
With Dynamic Format Strings, Power BI users now have fine-grained control over how values are displayed. From currencies to units to data labels, this functionality removes the need for complex workarounds or external tools.
Now that it’s built into Power BI Desktop, you can implement all of this without leaving your report.
Hope you like it!
Give it a try and see how it works for you! I’d love to hear what you think or see how you use this trick in your own reports.