What Makes UDFs So Powerful?The whole idea behind UDFs is that you get programming-style flexibility. You don't have to repeat similar formulas across different measures anymore. Instead, you encapsulate that logic inside a function and call it wherever you need it.
Getting Started- Make sure you're on the latest version of Power BI
- Enable UDFs under preview features (Settings > Preview Features > DAX User-Defined Functions)
Example 1: Dynamic Formatting Strings
Say you have sales by different regions and states, and you want to show values above 1,000 in "K", values above a million in "M", etc.
Traditionally, you'd go to your measure, select Dynamic formatting, and write a formula using SELECTEDMEASURE(), ABS(), and SWITCH() to return the appropriate formatting string. Just make sure your display units are set to "none" in the formatting options.
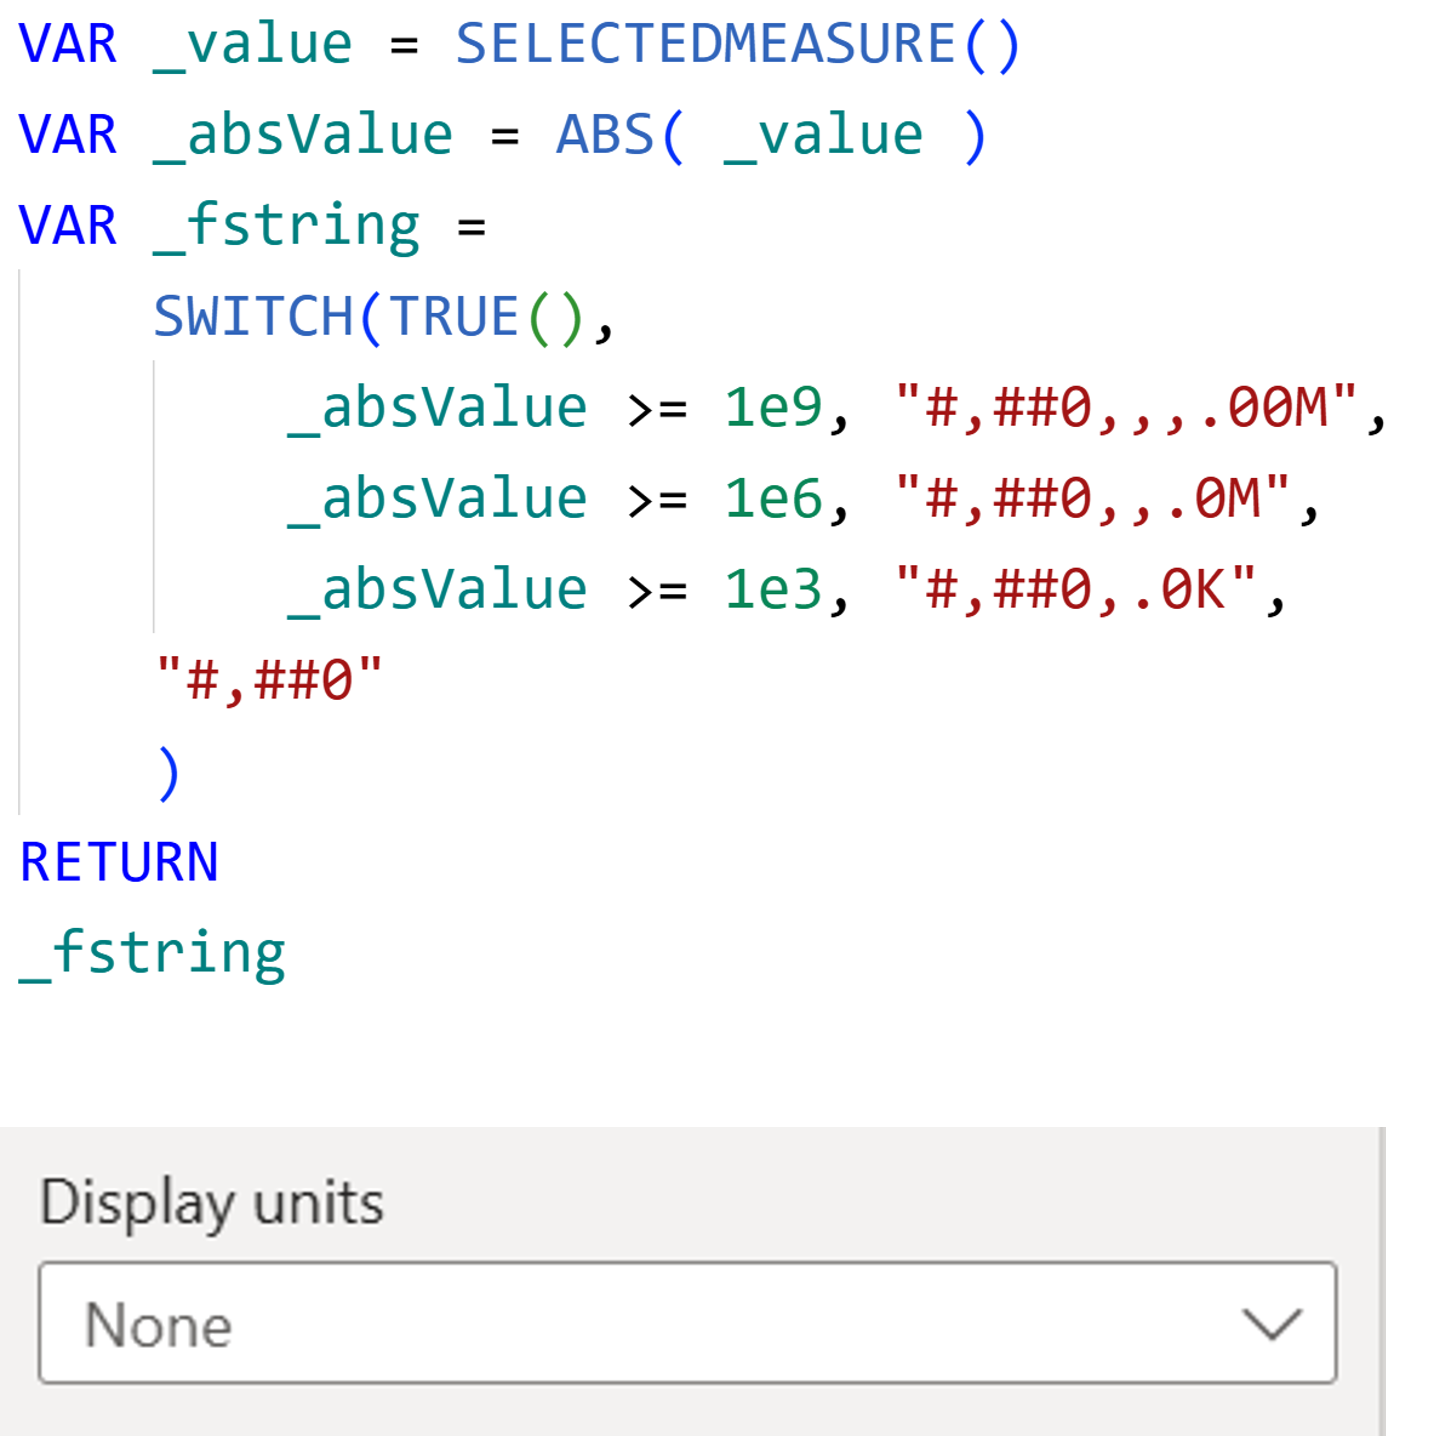
But here's the problem: If you want the same logic for another measure (like Profit Total), you'd have to copy and paste that entire formula. And if you ever need to change the logic? You'd have to update it for every single measure manually.
The UDF Solution: Create a function in the DAX Query View. Then, you can simply call the function - pbi.Numberformatting() in any measure's dynamic format. One function, multiple uses.
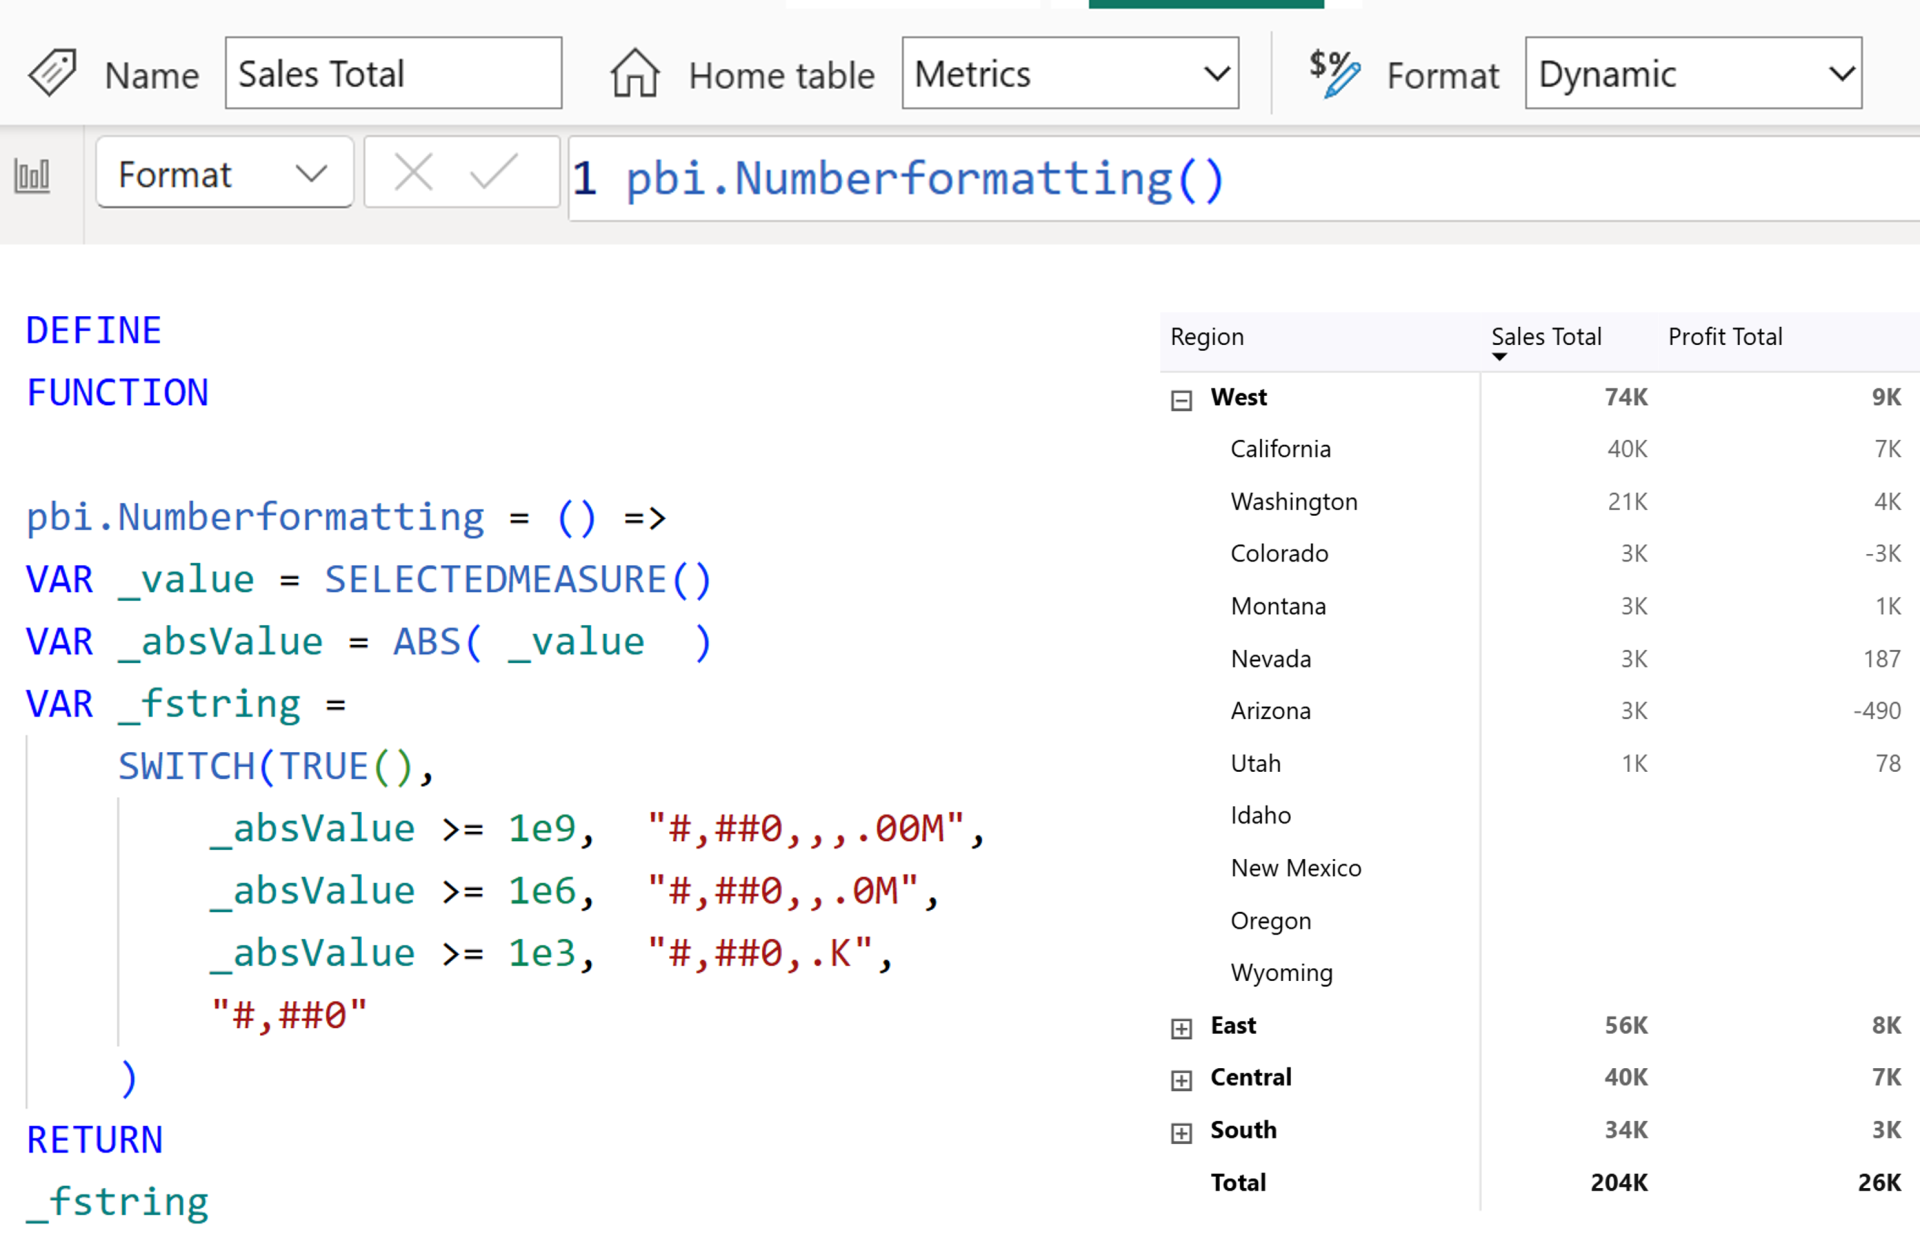
If you need to make a change (like removing decimal places from thousands), you update it once in the function, and it's reflected everywhere. Your logic is centralized, easier to maintain, and you're not repeating yourself.
Example 2: Theme Colors for Conditional FormattingSomething that's really been missing in Power BI is the ability to say "I want this conditional formatting to use a color from my theme." You can't do that natively. But with UDFs? Problem solved.
First, go to View > Themes > Customize Current Theme. You'll see all your theme colors with their color codes. Those are what we want to bring into our UDF. (You can also save the theme file and grab the codes from there - whatever is easier.)
Go to the DAX Query View and create the following function
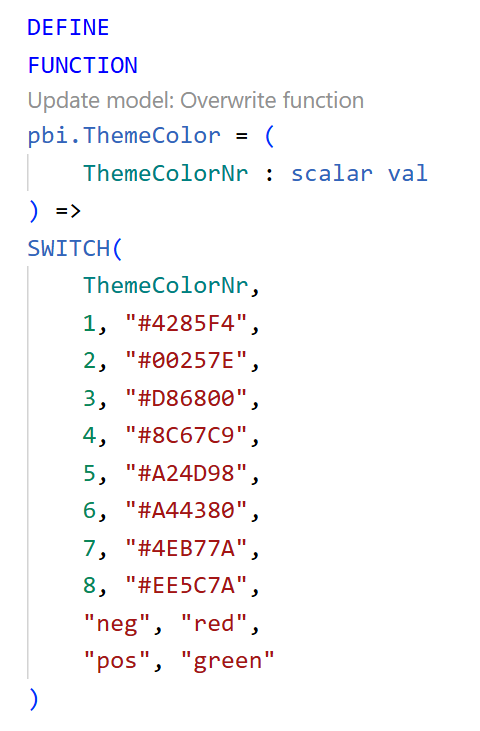
A quick note on parameters:After the parameter name, you can add ":" to define the type, subtype, and how it's passed into the function.
The main types are ANYVAL, SCALAR, or TABLE. In this case, we have SCALAR (which can be integer or text), and VAL means it gets evaluated before being passed into the function (which is also the default). Once you've updated the model with your changes, you'll see the new function appears.
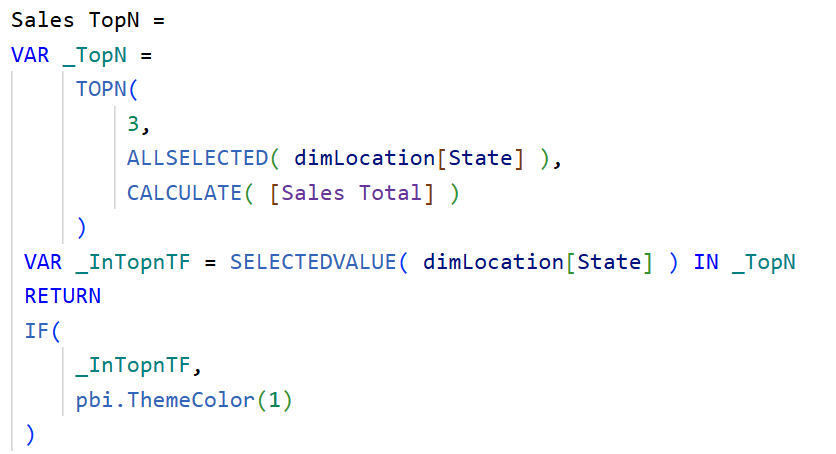
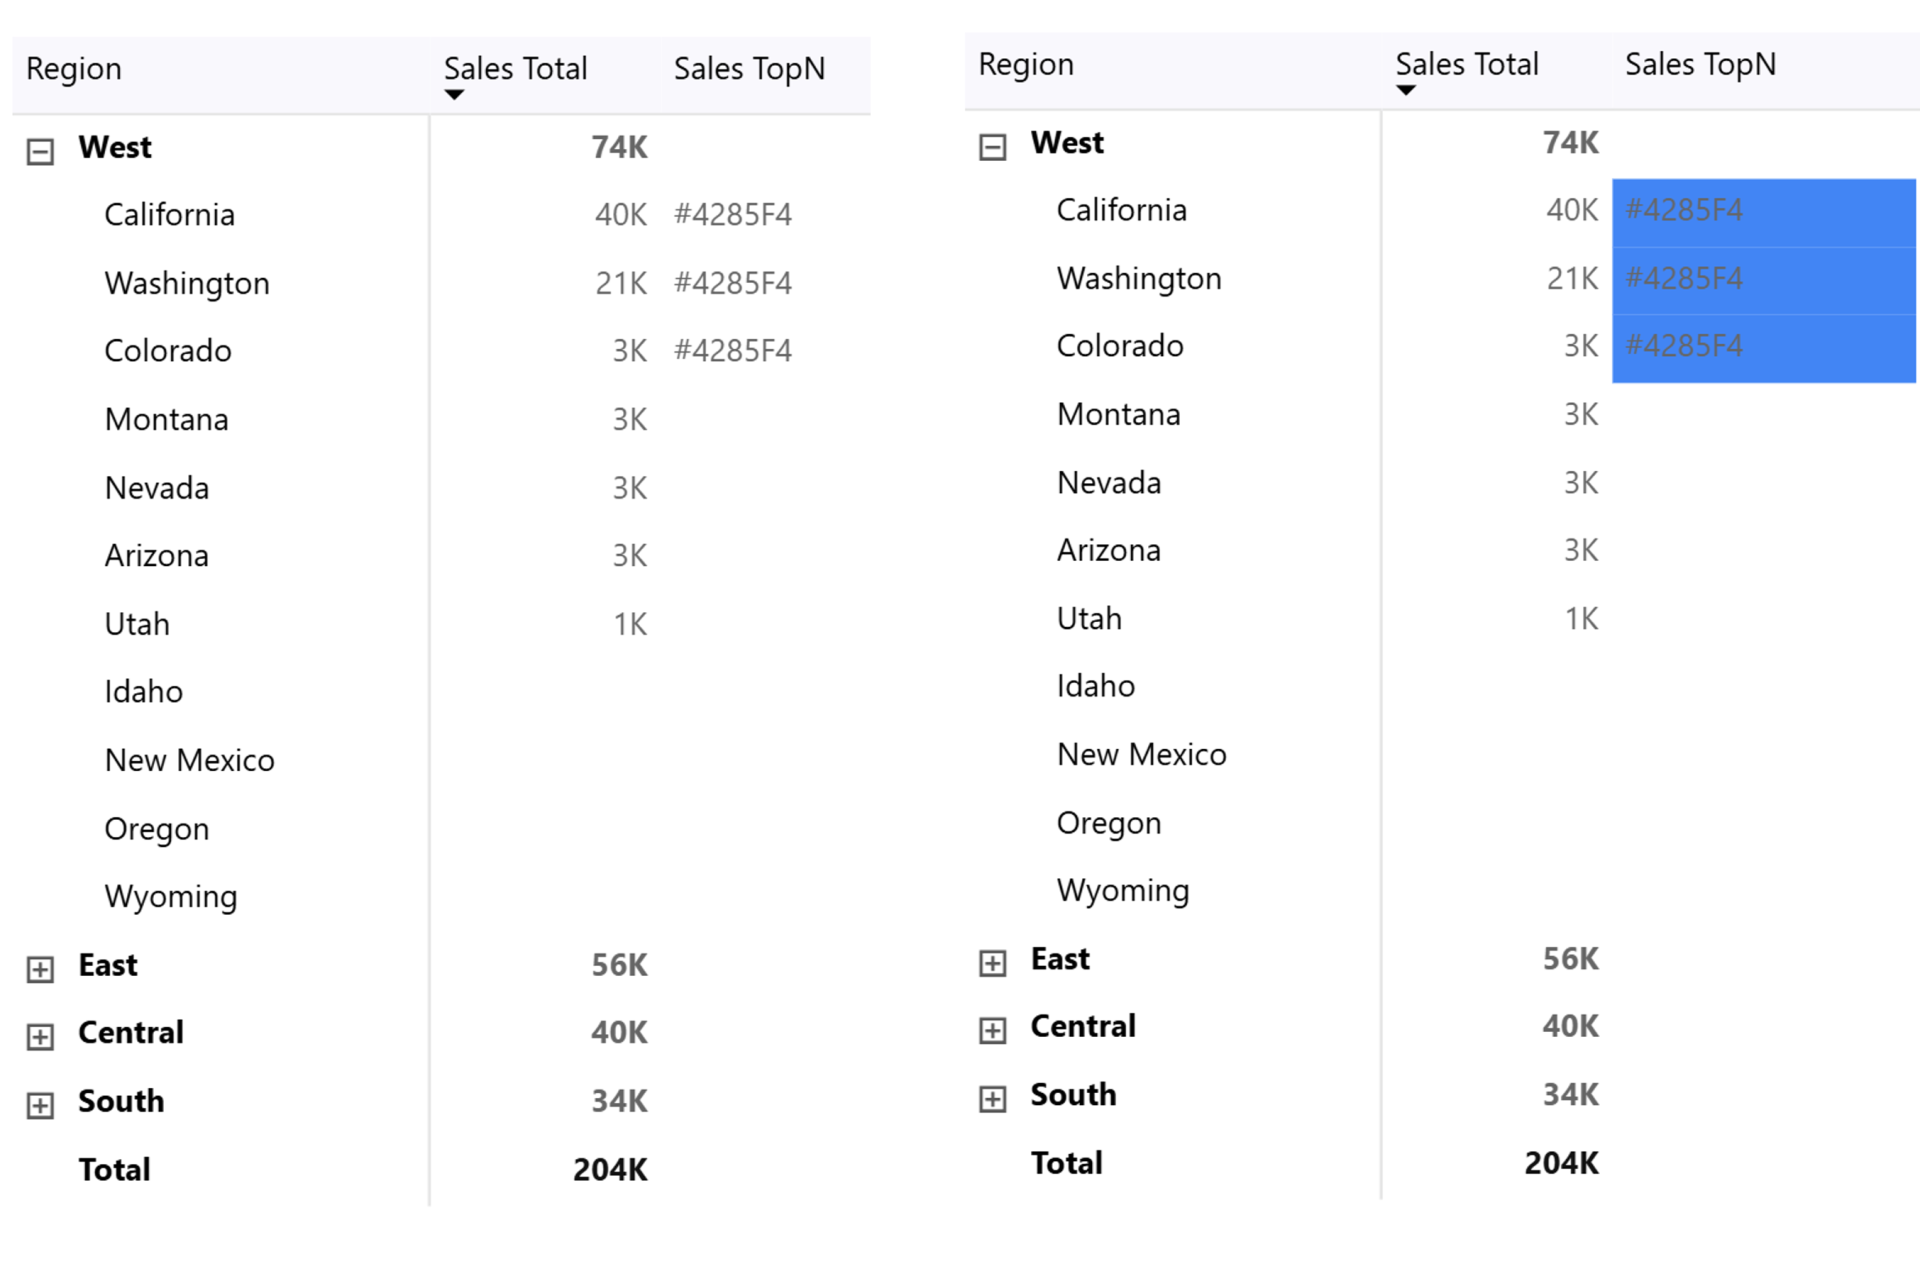
As an example, I've created a measure that checks if a state is in the top three for sales and if so return a specific color. Now, you can go to the measure and call the function. Usually we mention the color name or the color code in the measure. But, now we can just call the function and fill out the parameter value for the theme color we want.
Now the measure can be used for conditional formatting (Cell Elements > Select Series > Background Color, turn it on, click the FX button, and select "Field value.").
The beauty of this approach:- If your theme color ever changes, just update it in the UDF and gets picked up in any measure where you used it (instead of having it hard-coded).
- Want a different theme color? Just change the parameter number: PBI.ThemeColor(2) gives you the second theme color, etc.
- No more hunting down hardcoded hex values across multiple measures
Example 3: SVG Sparklines Made Easy
SVGs and UDFs are a match made in heaven. Why? Because SVG code is often really long, and now you can create a UDF library with different SVG templates that you (and your colleagues) can reuse across all your reports.
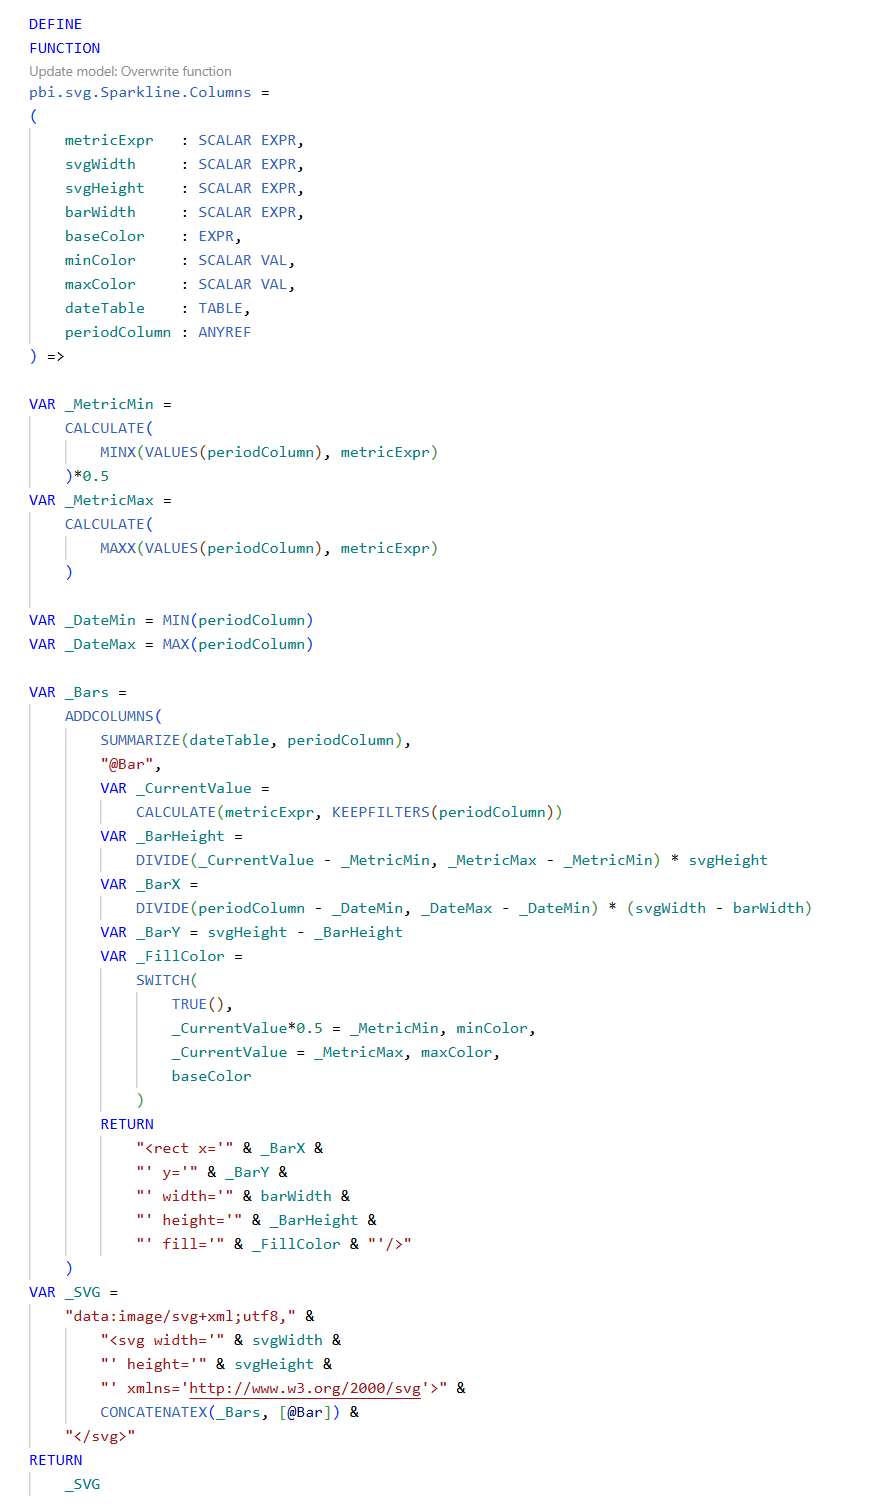
Creating the SVG UDF
This one's a bit more complex because we have many different types of inputs.
Notice the different input types we have? It's important to assign the right type so everything gets evaluated correctly.
- Scalar values like SVG width and height that get passed in as simple values
- Expression for the metric - if you have a measure using CALCULATE() or similar, it needs to be evaluated as an expression, not just a value
- Table references for the date table
- Column references with ANYREF
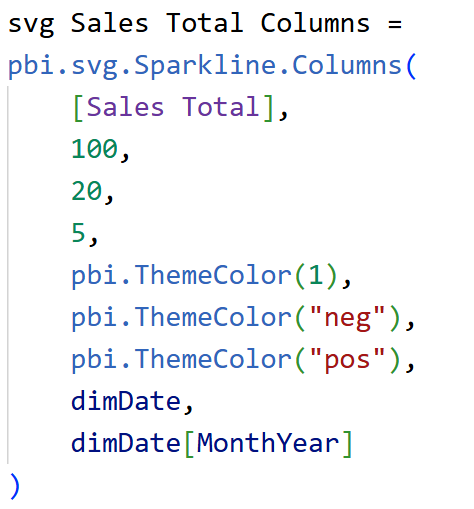
Once the function is created, now you can create a measure instead of writing dozens of lines of SVG code everytime, like the one here.
Note: The example also shows that you can call a UDF inside another UDF.
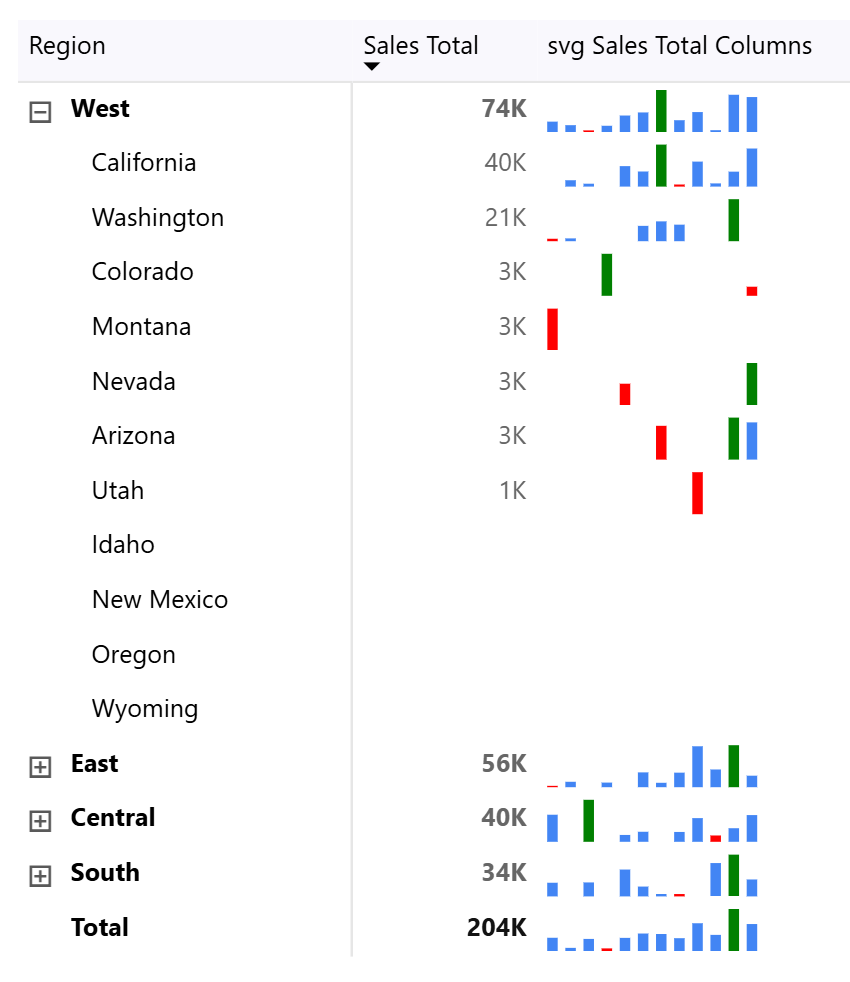
To show the SVG as image,
- Select your measure
- Go to Measure Tools > Data Category > Image URL
- Important: Set the image size to match what you defined in the function (20 by 100 in this example)
- Drag the measure onto your visual
- You may need to filter to just one year for it to display correctly
And there you have it - little sparkline columns showing in the table visual.
Building Your UDF LibraryNow it's up to you to figure out what logic are you repeating across different measures?
Think about:
- Time intelligence calculations
- Common DAX patterns you use over and over
- Business-specific formulas
Put that logic into functions and create your own library. Or start looking online -people are already writing and sharing UDF libraries you can use.
Sharing Your UDFsWant to share your functions? It's easy:
- Go to the TMDL view
- Drag and drop your functions into a new script
- Remove the lineage tags (unique identifiers)
- Share and reuse the code
When runs the code in their Power BI report, it automatically creates those functions. That's it.
Hope you like it!
Give it a try and see how it works for you! I’d love to hear what you think or see how you use this trick in your own reports.

