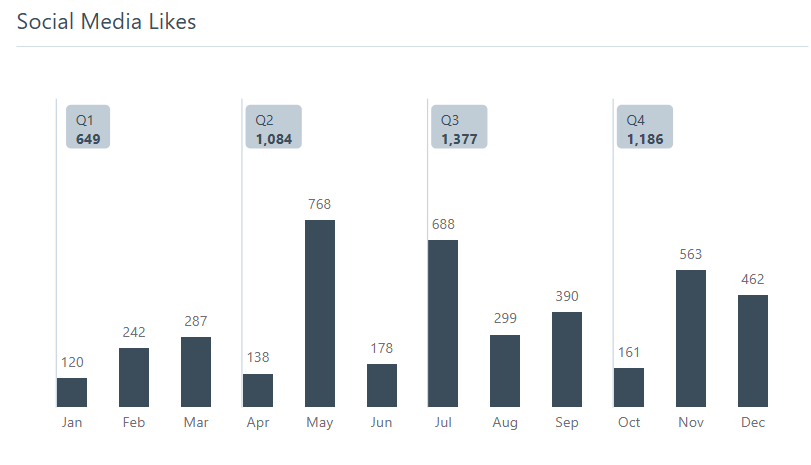
Side Drop Lines in Power BI (Without Gridlines!)

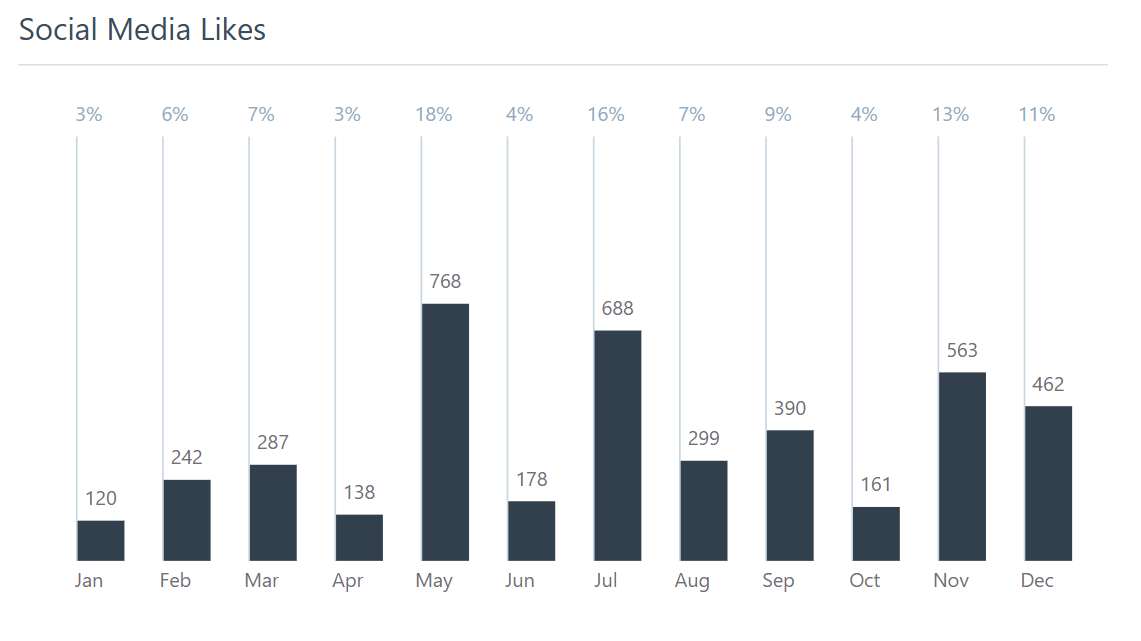
If you’ve ever wanted to take more control over vertical lines in Power BI visuals - to clearly separate data by quarter or emphasize key groups - this tutorial will show you how to do it using a clever trick with error bars and transparent series.
Apr 3 / datatraining
Step 1: Add Vertical Lines with Error Bars

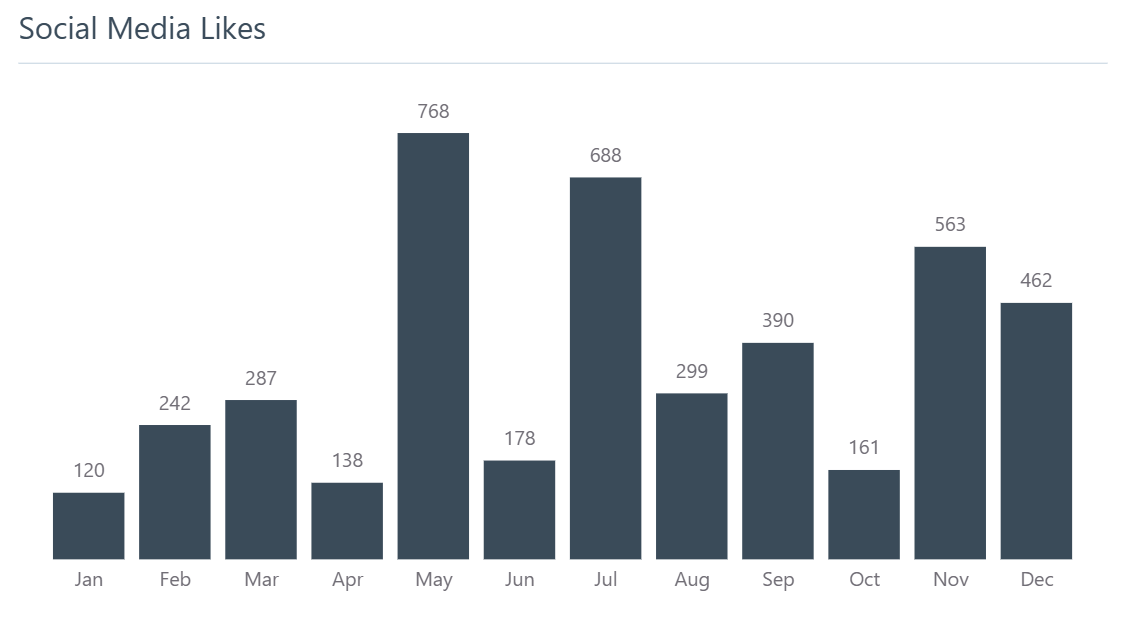
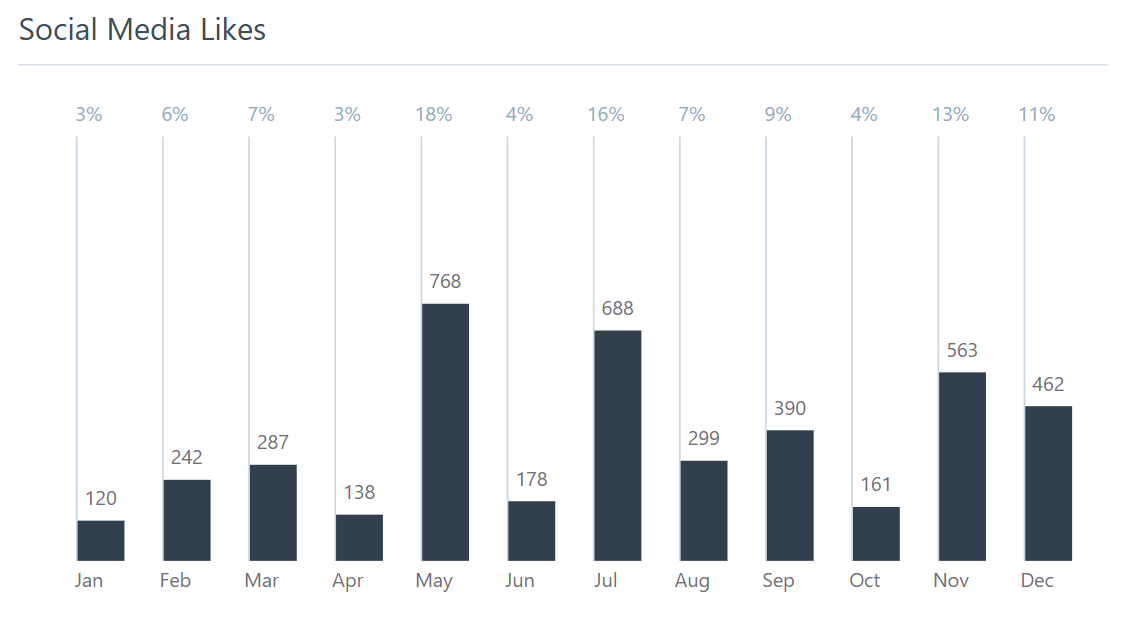
Start by building a column chart that shows something like total social media likes over time.
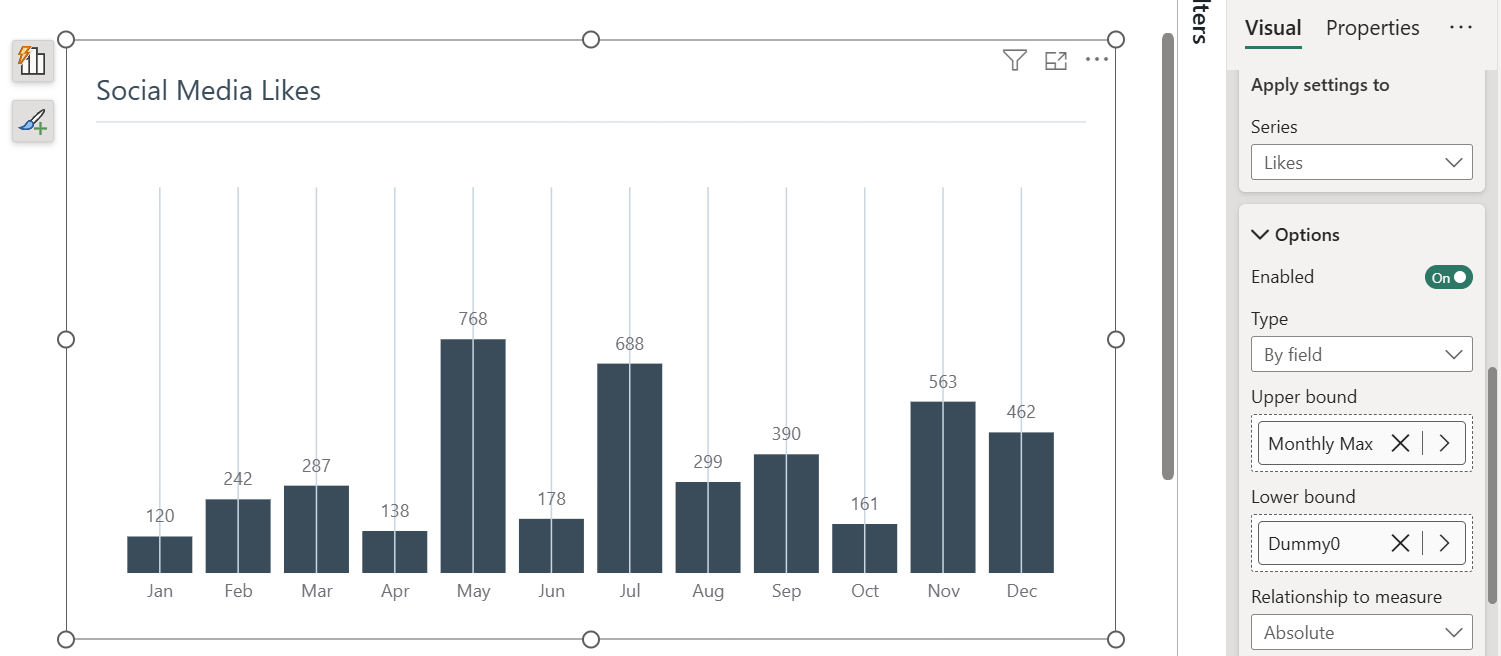
1. Create your base visual.
2. Go to Format > Error bars and enable them.
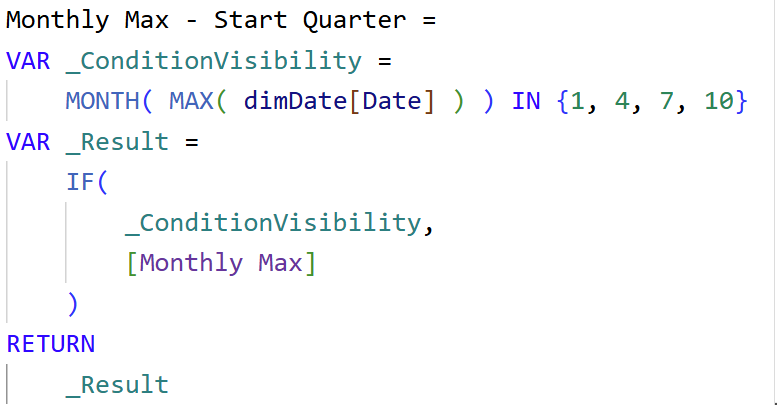
3. For the upper bound, use a DAX measure like:
4. For the lower bound, use a measure that returns zero:
5. Style the error bars:
  • Turn off borders and markers.
  • Change the color to a light tone.
Step 2: Move Lines to the Side (Left or Right of Columns)

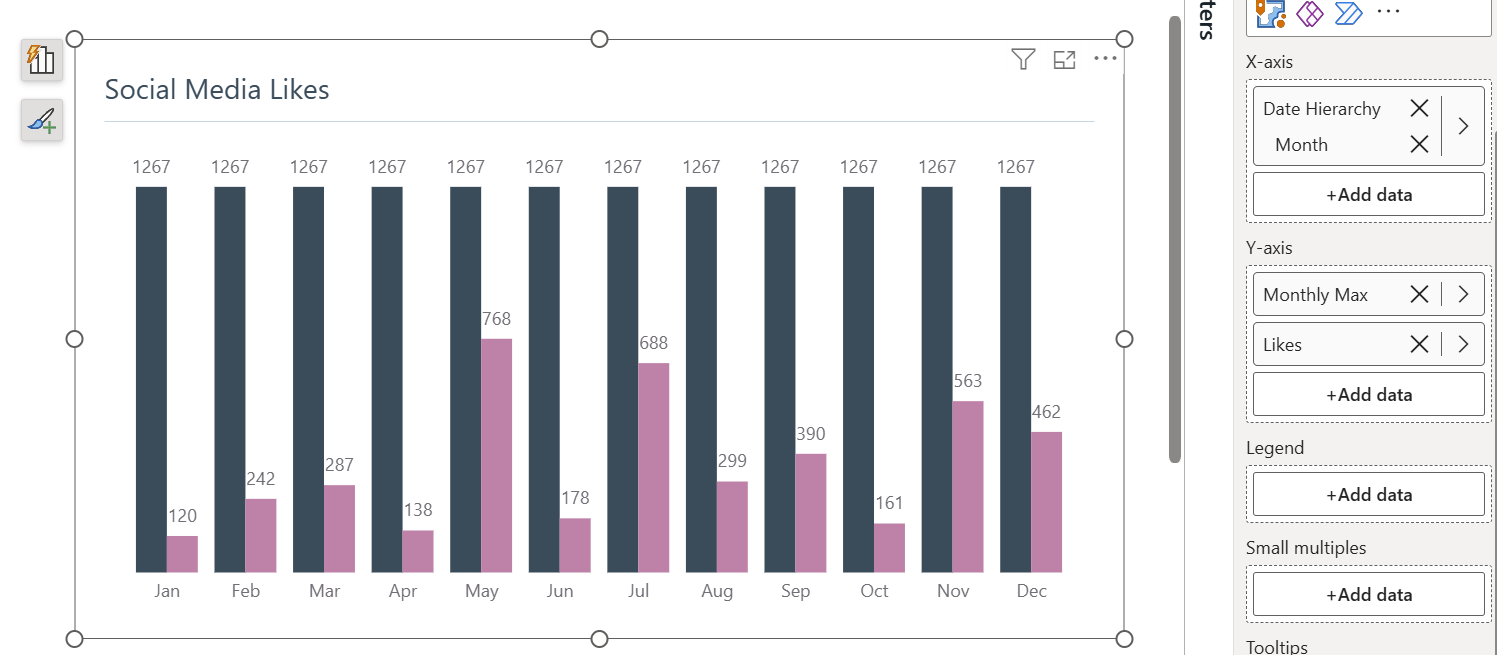
The problem: the lines are centered on the columns and overlap labels.

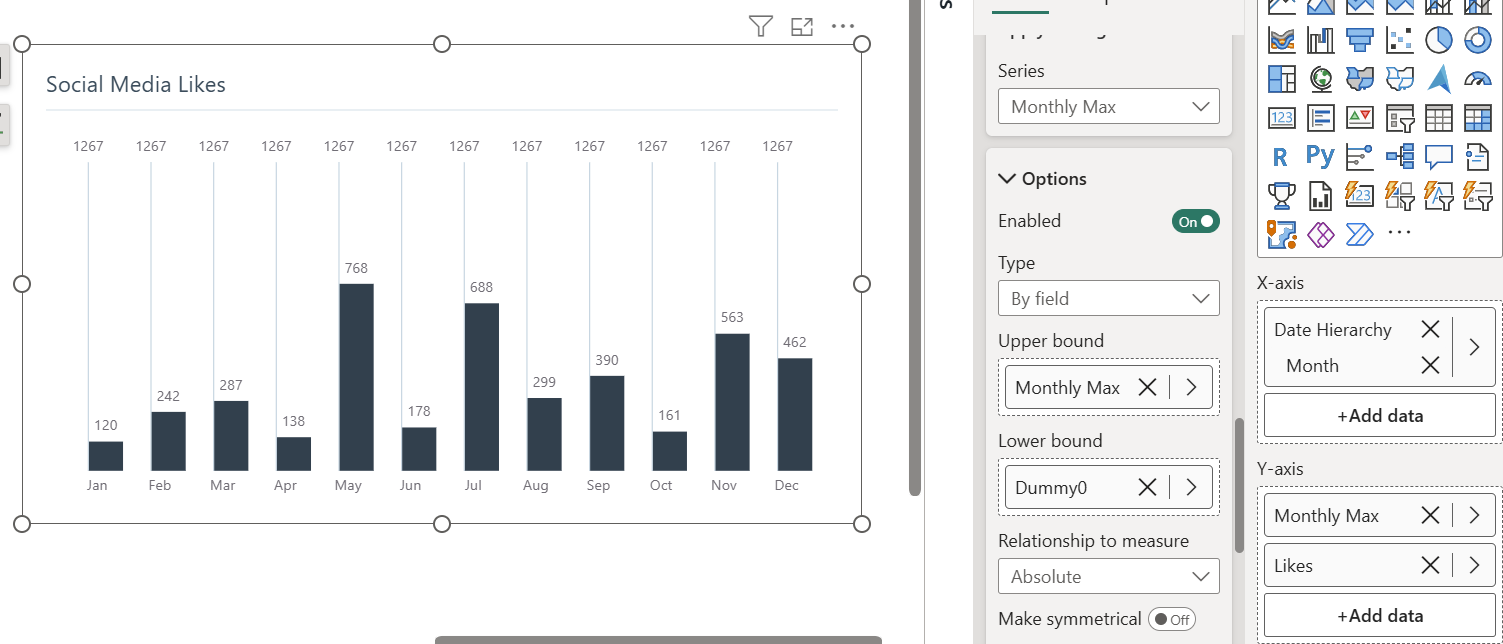
Solution: create a second data series (e.g., Monthly Max) and apply error bars to that instead of the main series.

  1. Add the same Monthly Max measure as a new series above your main one on the y-axis.
2. Make it transparent:
  • Go to Format > Series > Monthly Max
  • Set transparency to 100%
3. Go back to Format > Columns > Layout and reduce space between series to overlap the columns (e.g., 33%).

Now apply error bars to the new transparent series instead.
Step 3: Add Dynamic Labels to the Top of Lines

To place labels like percentages or growth rates above the vertical lines:
  1. Create another transparent series (e.g., Monthly Max 2)
  2. Add it between the previous two series.
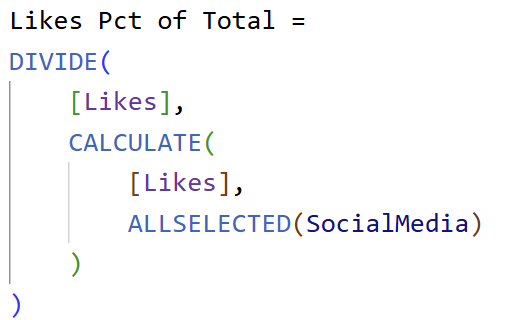
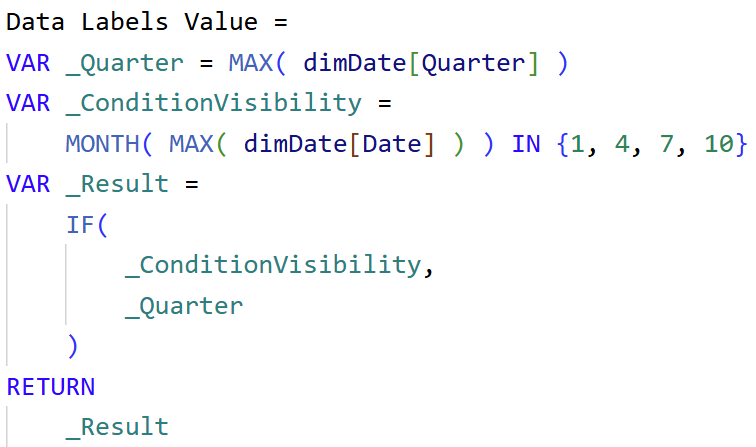
  3. Apply a measure for data labels, e.g.:
4. Apply it to Monthly Max 2 data labels.
5. Format:
  • Change color
  • Make bold or smaller as needed
Step 4: Show Labels Only at Start of Each Quarter

To make the labels appear only at the start of each quarter, use this logic:
Do the same for labels:
Apply these to:
  • Error bars (upper bound)
  • Data label values

Step 5: Add Detail Text and Final Styling

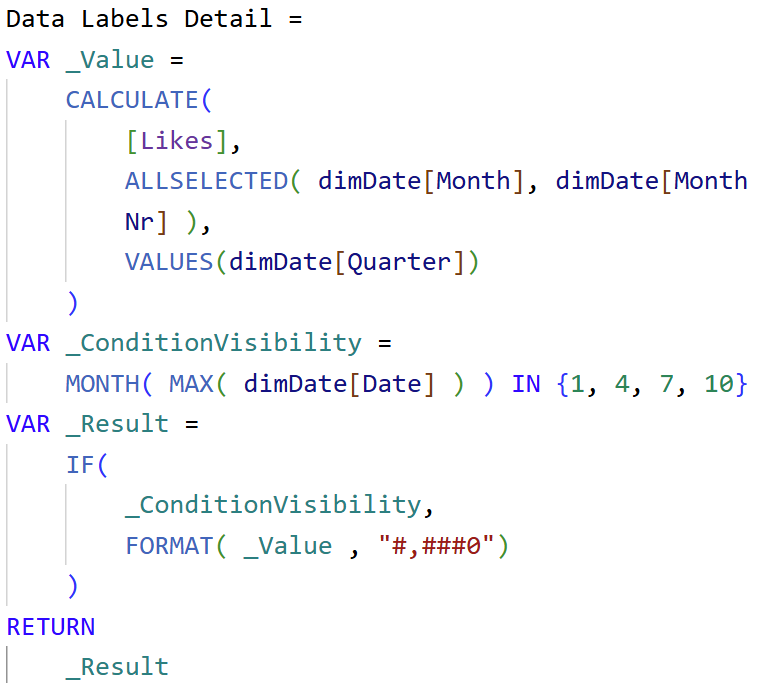
You can add detail below the main label using another measure:
Go to Format > Data label > Detail and assign this measure.

Then:
  • Set background color (light blue)
  • Format text alignment (left-aligned like flags)
  • Enable overflow text
Why Not Use Gridlines?

Standard gridlines in Power BI do not allow vertical lines like this, that’s why this method is such a valuable workaround.

Final Thoughts

This design technique gives you precise control over where vertical lines and labels appear in your visuals - something not possible with default gridline settings. It improves readability, separation by time periods, and overall UX.

Hope you like it!

Give it a try and see how it works for you! I’d love to hear what you think or see how you use this trick in your own reports.

How to Power BI

Watch it here

Launch Power BI Reports
that bring your organization
to a fully 
data-driven world.

Power BI Launch

After years of consulting we have developed a holistic solution for launching Power BI Reports in 3 months. From key metrics discovery, to report design, implementation and stakeholders' training. We know precisely how to launch Power BI reports that drive organizations' growth.

Power BI Trainings

Our technical trainings for report developers instantly upskill your teams. Alongside our unique business user trainings the improvement in overall organizational data literacy becomes immediately actionable.

Take your Skills to the Next Level

Power BI Trainings

__________