Smarter Power BI Dashboards: Show Charts Only When Needed!

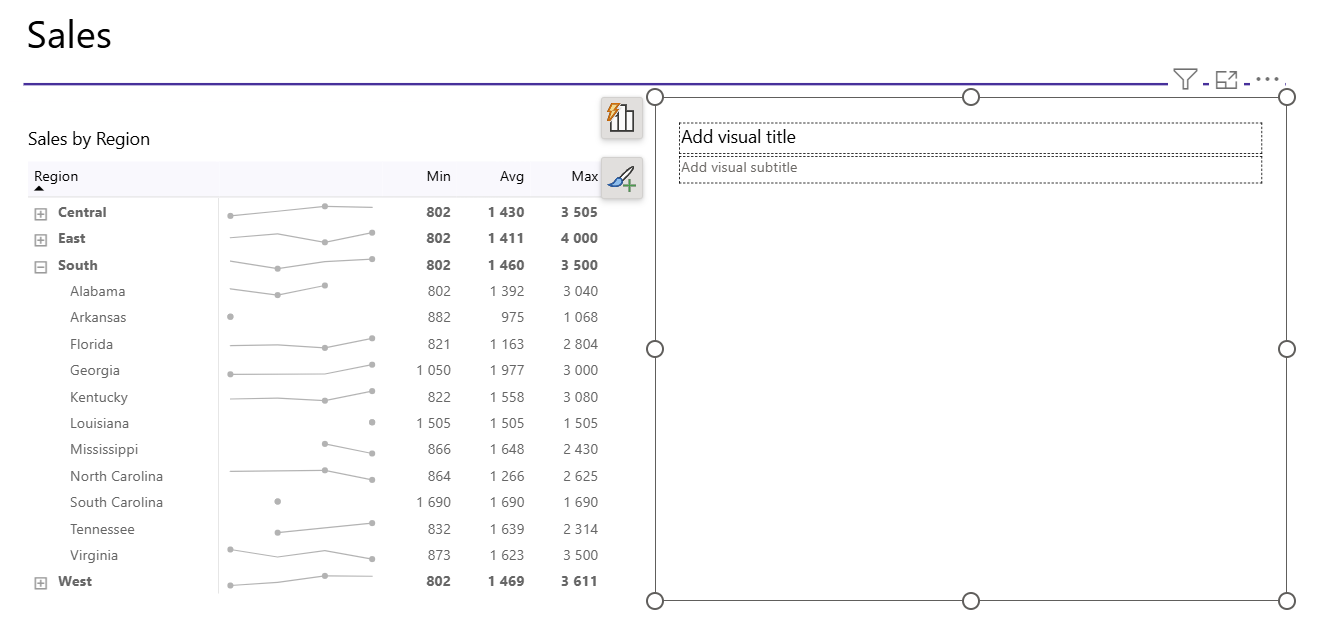
Have you ever wanted to show a chart in Power BI only when a specific item is selected in another visual? For example, display detailed metrics only when a region or employee is selected? Let's see ways to achieve it.
Mar 23 / datatraining
This tutorial shows two ways to achieve the card visibility as required:

1. The old "card overlay trick"
2. A smarter, modern method using dynamic DAX logic and even custom placeholders

Let’s explore both.
Method 1: Card Overlay Trick (Quick & Dirty)

The idea: use a card visual on top of the main chart to block it. When a selection is made, the card becomes transparent using a DAX measure. It’s quick but has a big downside: no tooltips.

Step-by-Step

1. Create a card visual and position it directly over your main chart.
2. Add a placeholder text measure like:
3. Add it to the card. Format the font, remove the border, center it, and adjust size/color.
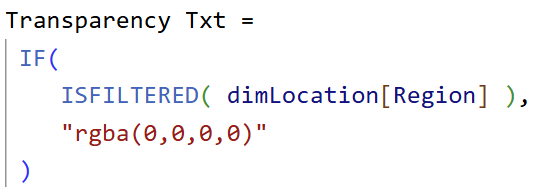
4. Create a transparency color measure using RGBA:
5. Apply this measure as conditional formatting to:
  • Card text color
  • Card background color

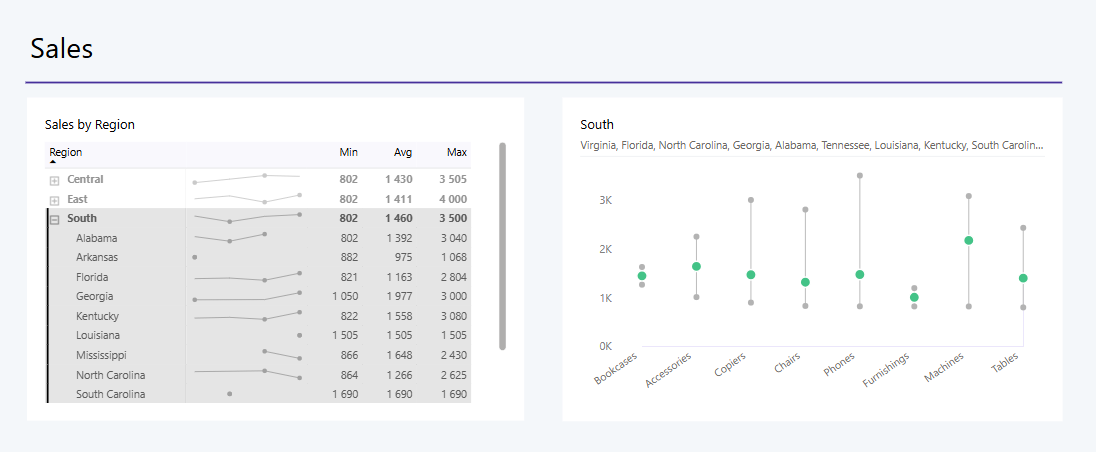
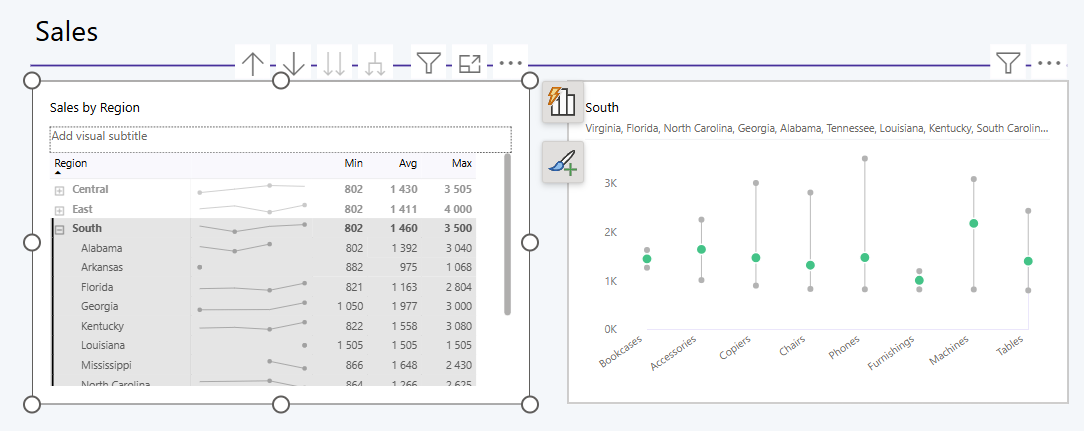
Now, the card hides the chart unless a region is selected. But tooltips won’t work due to the overlay.
Method 2: The Smart Way – Dynamic Measures Only

To avoid overlays (and keep tooltips!), modify your measures to return blank when nothing is selected.

Step-by-Step

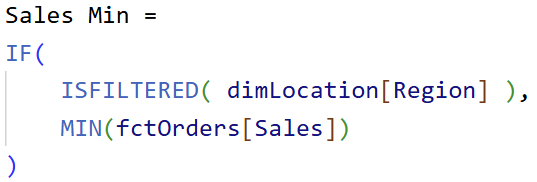
1. Update every measure used in the chart, like this:
Repeat for Sales Max, Average, and any custom values.

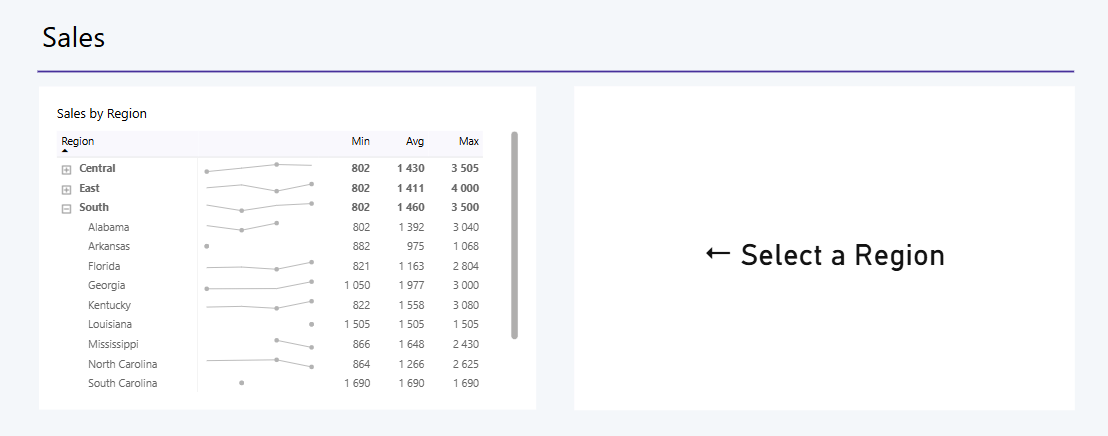
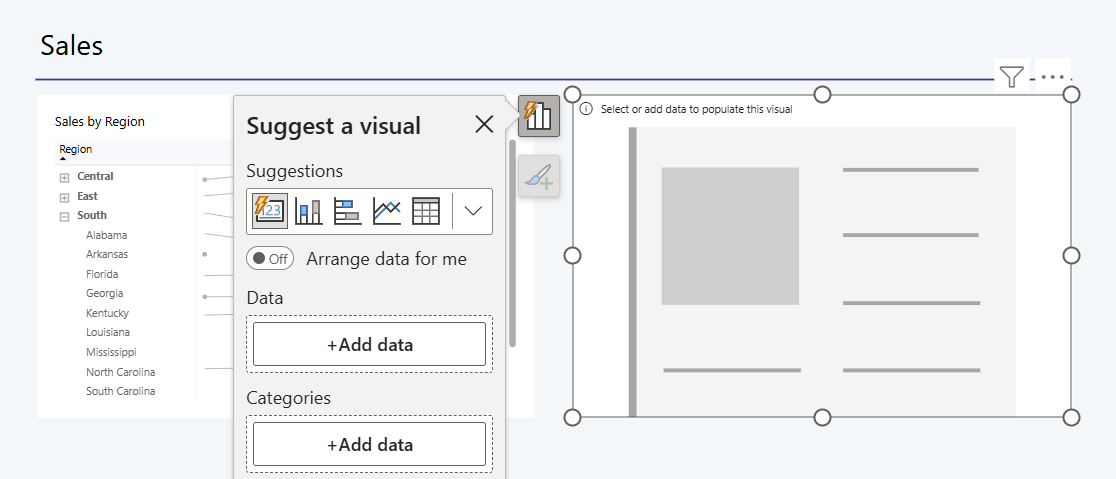
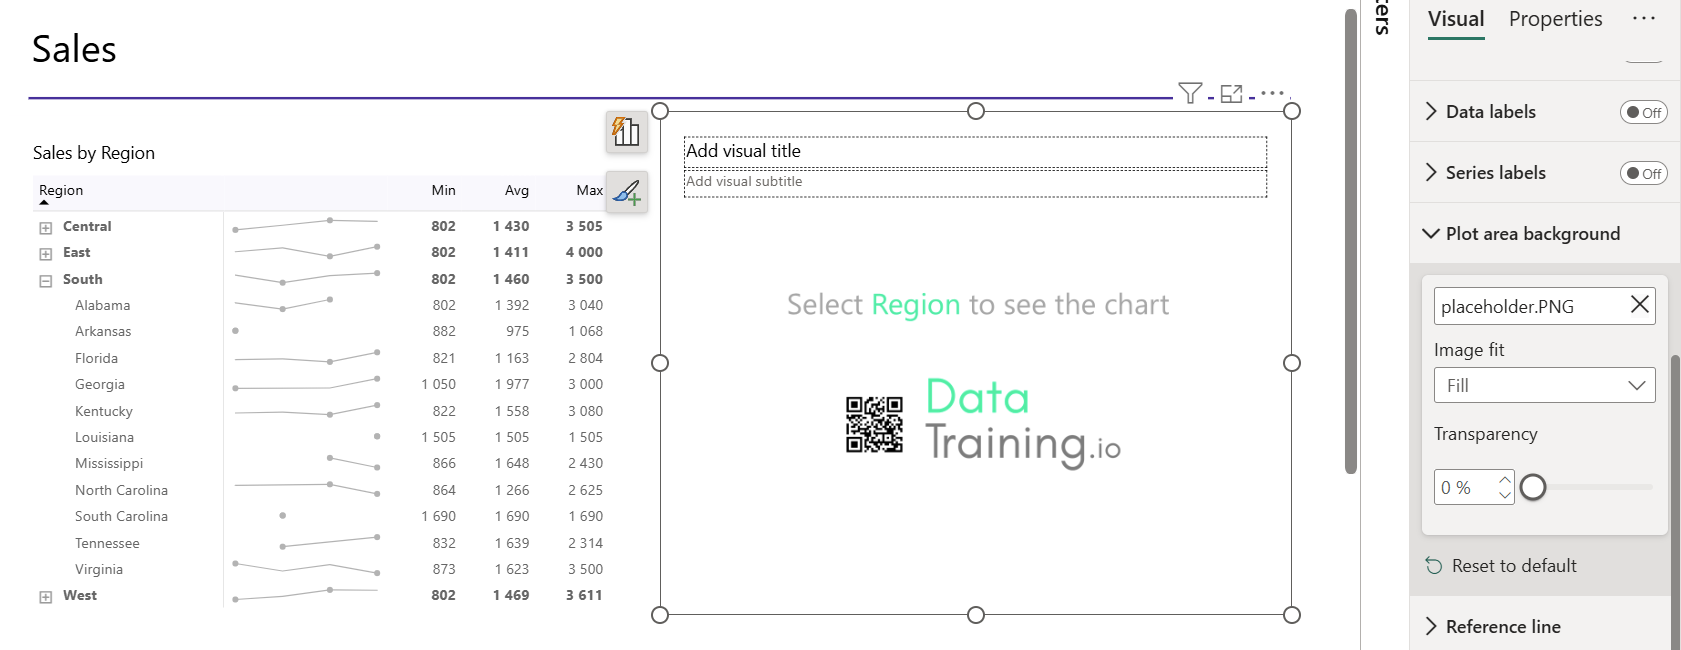
2. The chart now disappears when nothing is selected, but it leaves a blank space. To make that more user-friendly, add a visual placeholder.
Optional: Custom Placeholder with SVG

Instead of using text or shapes, use a PowerPoint-generated image.

How to Add a Placeholder

  1. In PowerPoint, design a simple placeholder (e.g. “Please select a region”).
  2. Export it as an SVG image.
  3. In your visual, go to:
    - Format → Plot area → Background image
    - Upload the SVG and set fit to "fit" or "fill"
  4. This image will only be visible when the chart is blank (i.e. when no region is selected).
Now the visual looks polished even without interaction - and no overlay or shape tricks are needed.

Benefits of the Dynamic Method

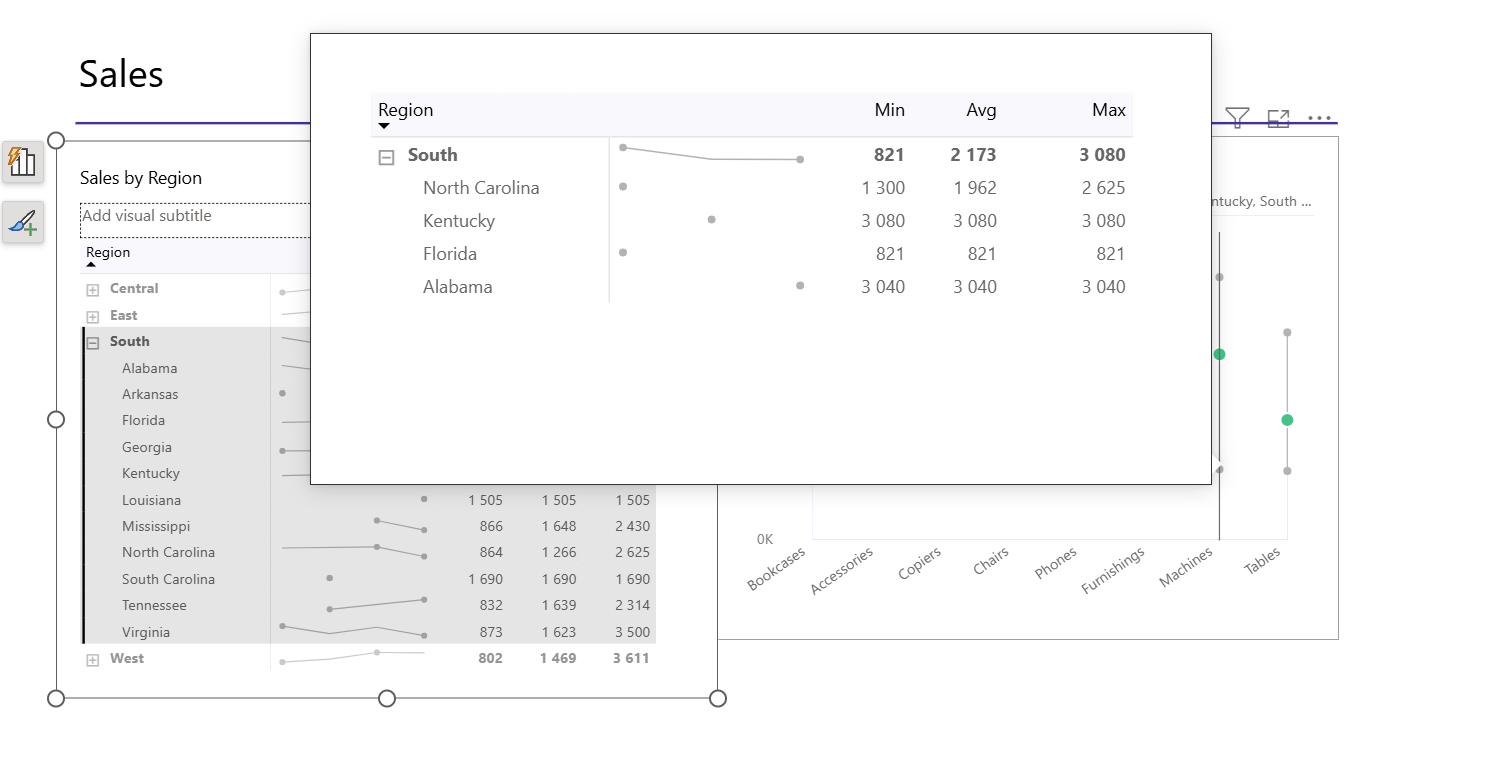
Keeps tooltips
Works with dynamic titles and subtitles
Clean UX — no layering issues
Fully DAX-driven logic
Reusable in any report
Final Thoughts

This pattern can be extended:
  • Switch images for different selections
  • Add animations with bookmarks (if desired)
  • Combine with user-based filtering for personalized dashboards

Hope you like it!

Give it a try and see how it works for you! I’d love to hear what you think or see how you use this trick in your own reports.

How to Power BI

Watch it here

Launch Power BI Reports
that bring your organization
to a fully 
data-driven world.

Power BI Launch

After years of consulting we have developed a holistic solution for launching Power BI Reports in 3 months. From key metrics discovery, to report design, implementation and stakeholders' training. We know precisely how to launch Power BI reports that drive organizations' growth.

Power BI Trainings

Our technical trainings for report developers instantly upskill your teams. Alongside our unique business user trainings the improvement in overall organizational data literacy becomes immediately actionable.

Take your Skills to the Next Level

Power BI Trainings

__________