The obvious question: how long does it actually take to go from nothing to a fully working Power BI report with AI?
I put it to the test. Let's discuss.
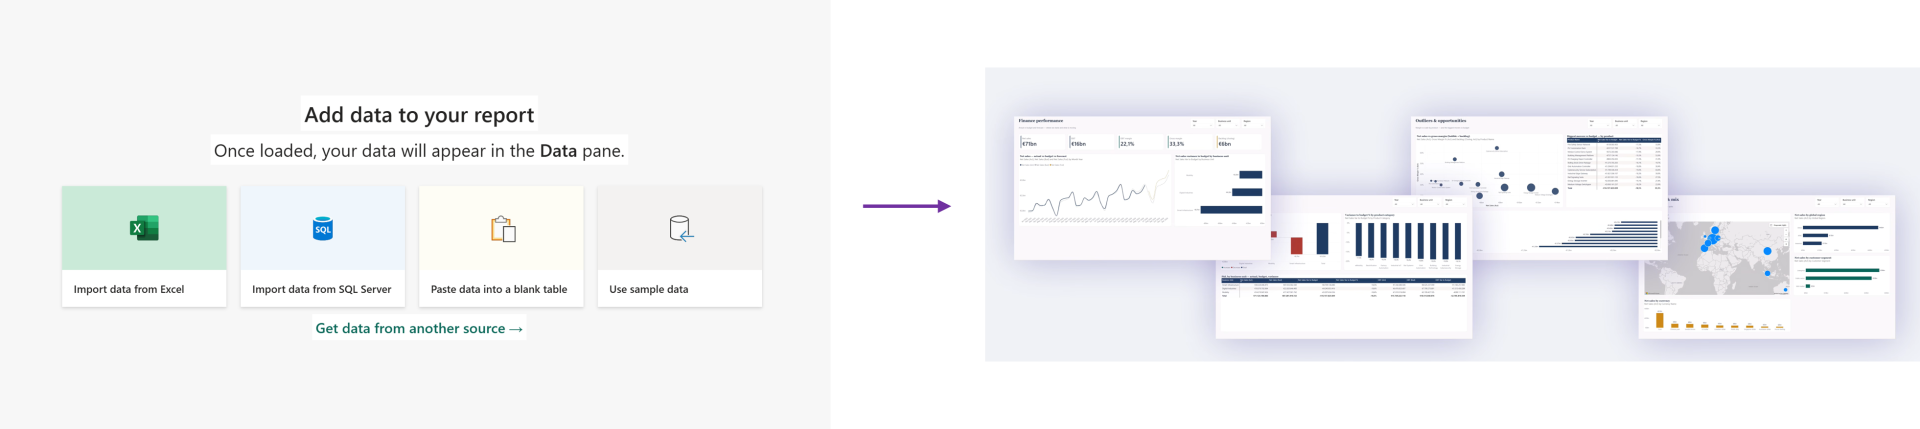
What actually changed?
The June 2026 Power BI update introduced what Microsoft calls the complete agentic reporting experience - powered by Skills for Fabric and a marketplace of Power BI and Fabric plugins.
The
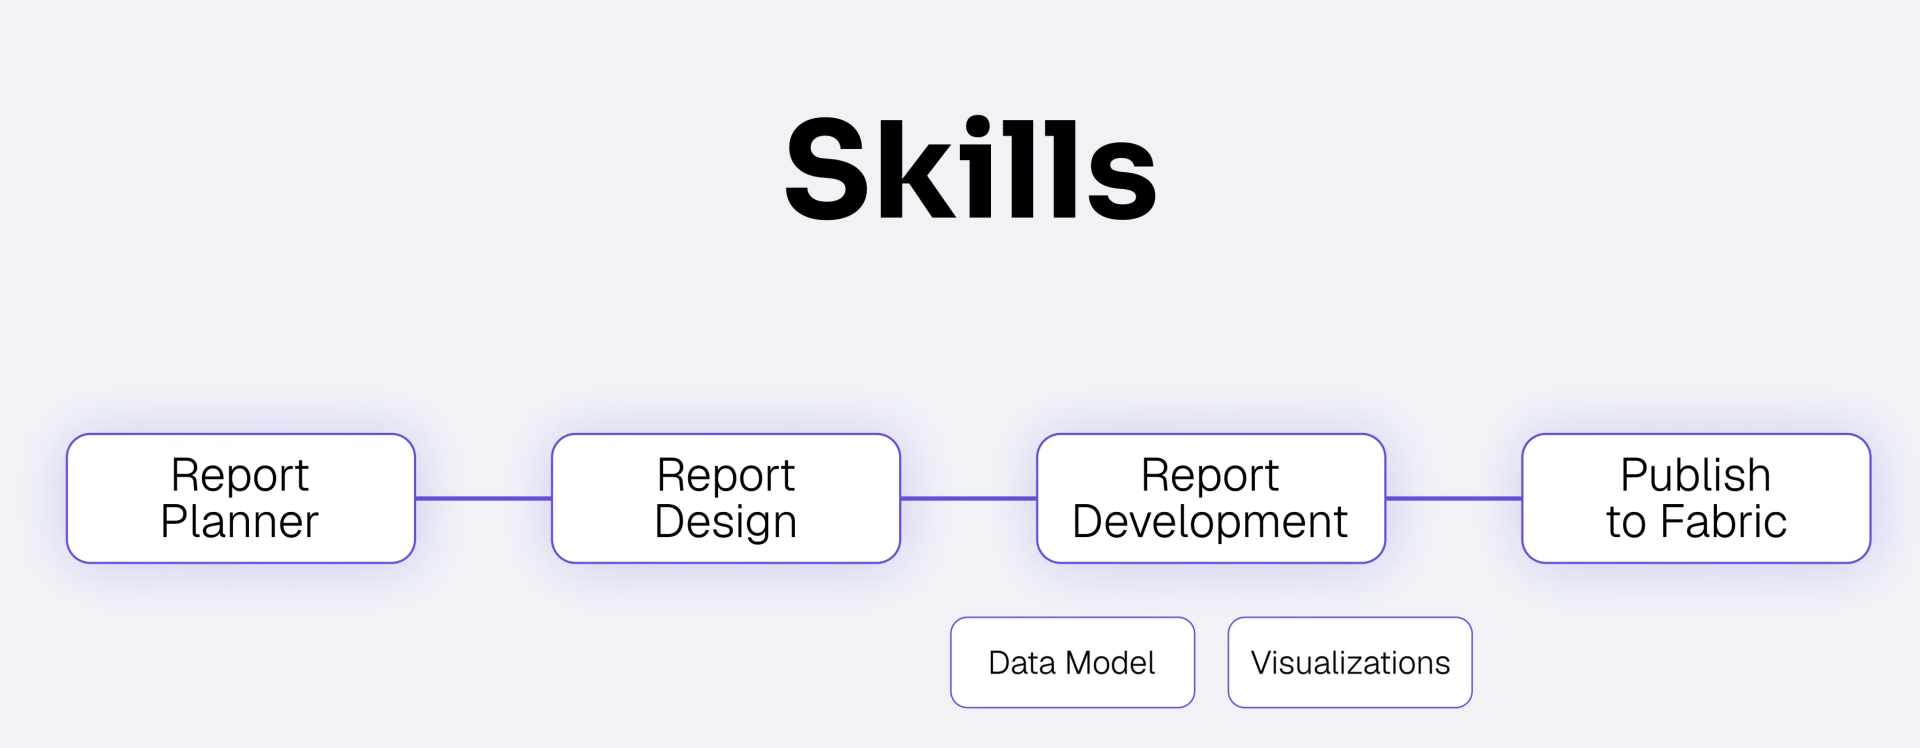
Power BI Reporting plugin ships skills for each stage of report development. From planning out what needs to go in to actually building the whole semantic model and visualizations.
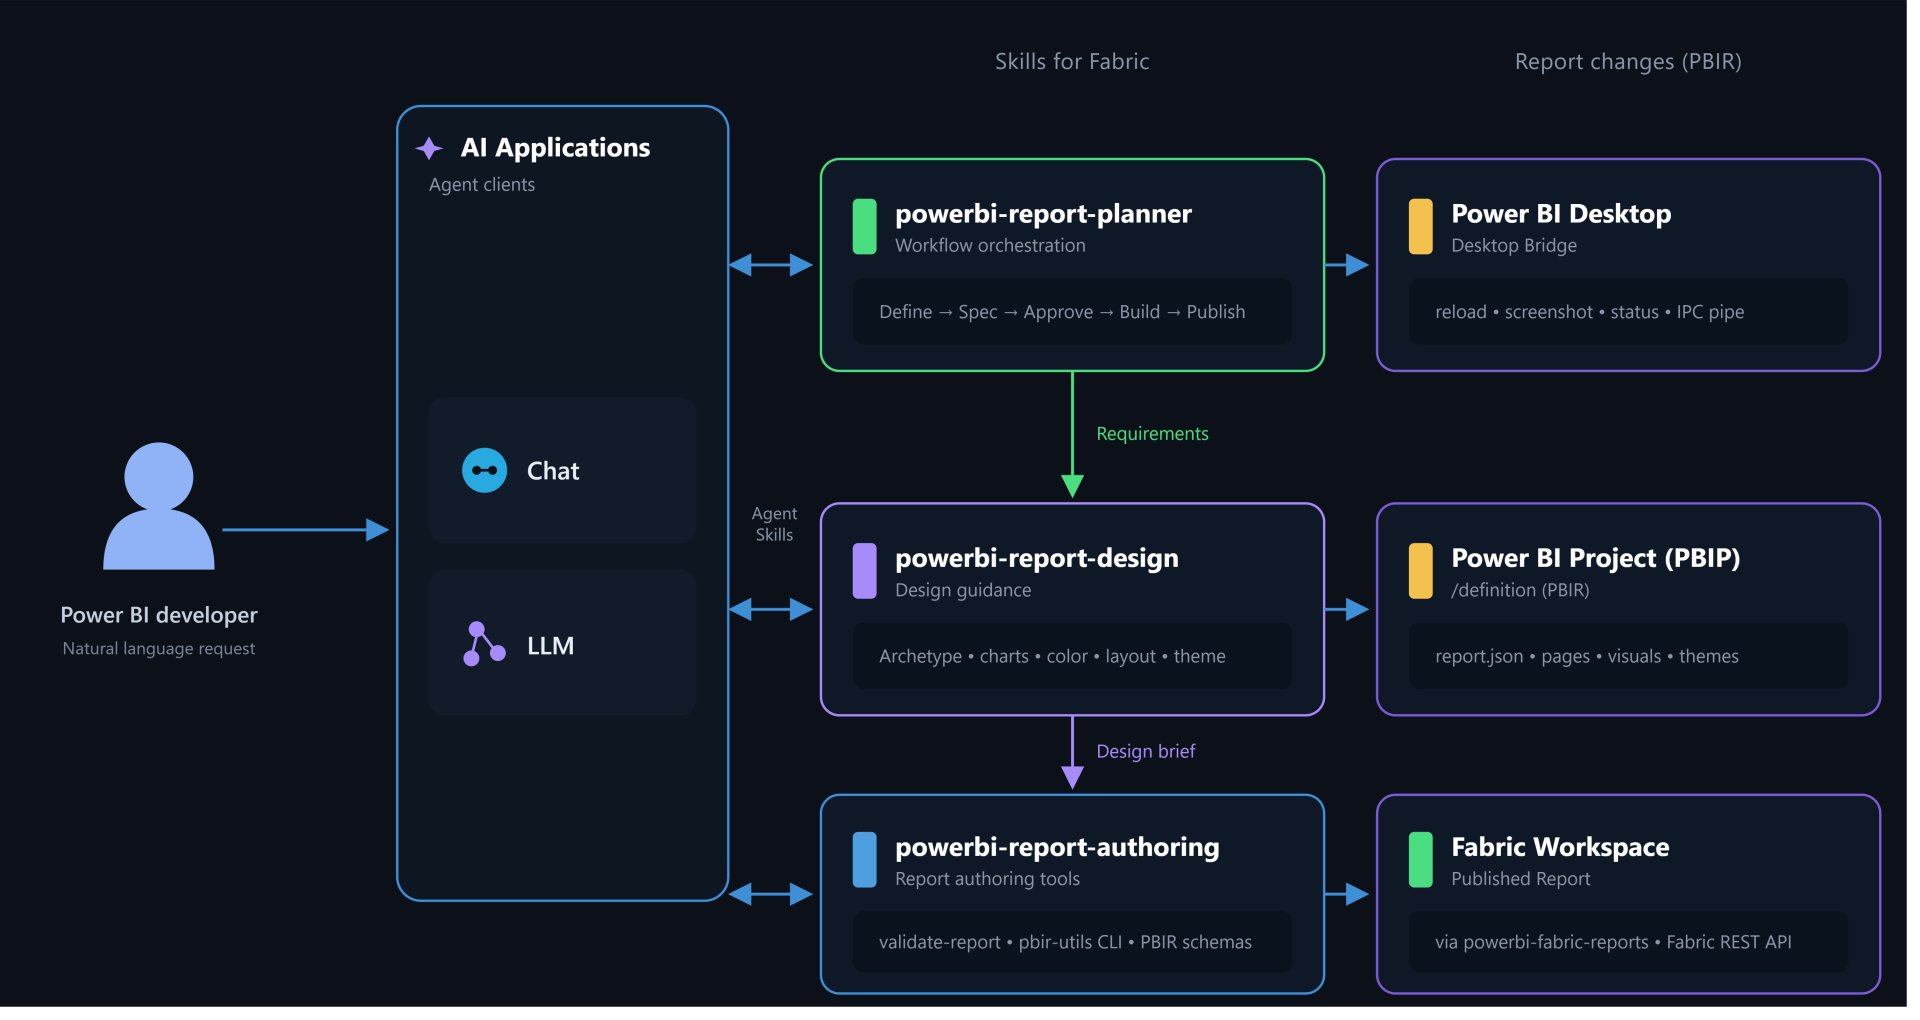
High level, the flow looks like this:
You (the developer) prompt AI in your tool of choice - Claude Code, VS Code, or CLI you prefer. The large language model does the work. The thing is that it's trained on general data. It doesn't automatically know all settings in Power BI and how to change the PBIP files.
That's exactly what Microsoft built skills for - to give it that information and also structured processes to follow for planning out the best report structure.
Power BI Report Planner - figures out what needs to go in the report for your audience
Power BI Report Designer - decides how to show it: which visuals, what layout, what design identity
Power BI Report Authoring - actually builds it
The development needs to happen on a Power BI project (PBIP), not PBIX. And there's desktop bridge that takes screenshots of your open report in Power BI Desktop, so AI can validate whether things are going in the right direction as it works and show the changes live.
Initial Setup (before anything else)
First you need to make sure AI can use the skills in your tool of choice.
Claude Code (what I used):
- Open Claude Desktop → Code tab
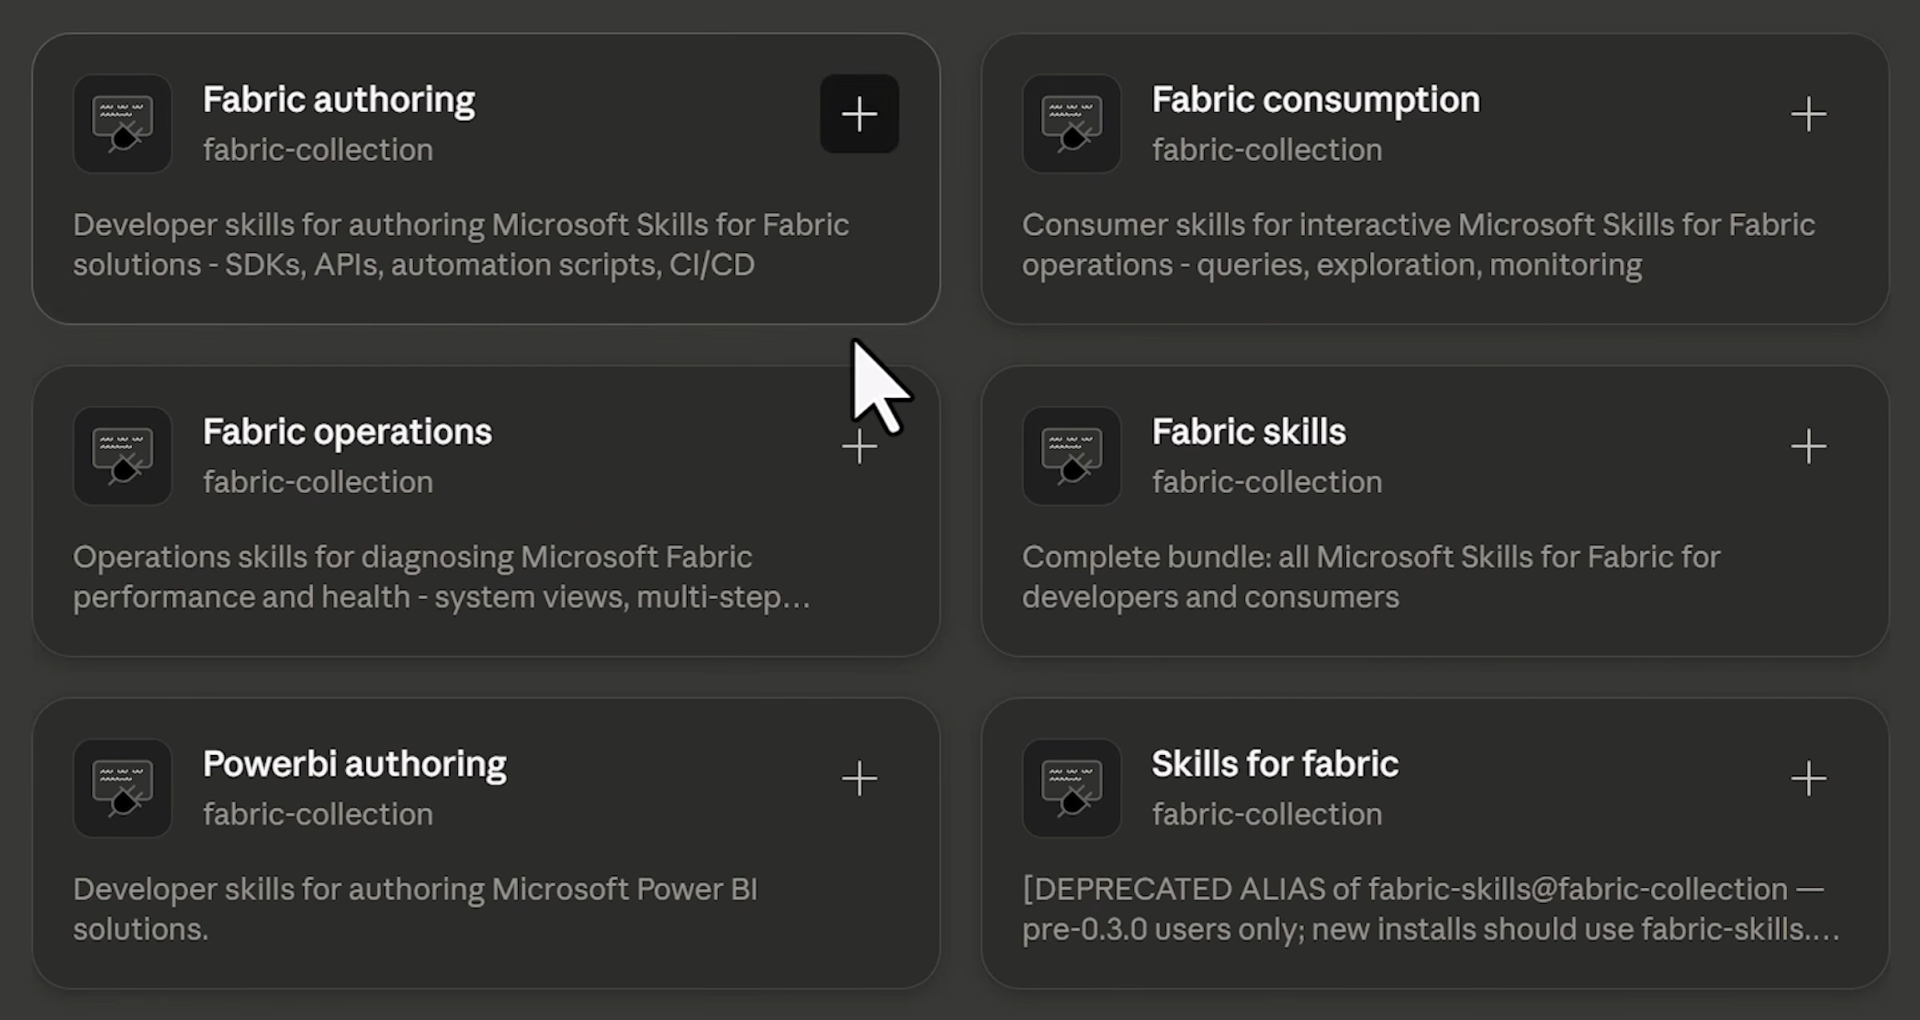
- Customize → Plugins → + → Personal → Add Marketplace
- Paste the GitHub repo URL from the June Power BI update (Skills for Fabric marketplace link)
- Sync, then enable all plugins except the deprecated one
- Connect your project folder (where your PBIP report and data will live)
- Save an empty report as PBIP in that folder, open it in Desktop, then you're ready to prompt
Vs Code alternative:
Install VS Code + your AI extension (Claude, Codex, or Copilot)
Settings → Plugins → Install plugin from source → same GitHub repo URL
Open your project folder and start a session
Skills are markdown files with instructions and reference assets and they're customizable. Add your company's design JSON, adjust chart-type preferences, add templates. The marketplace gives you Microsoft's defaults; you make them yours.
The test:
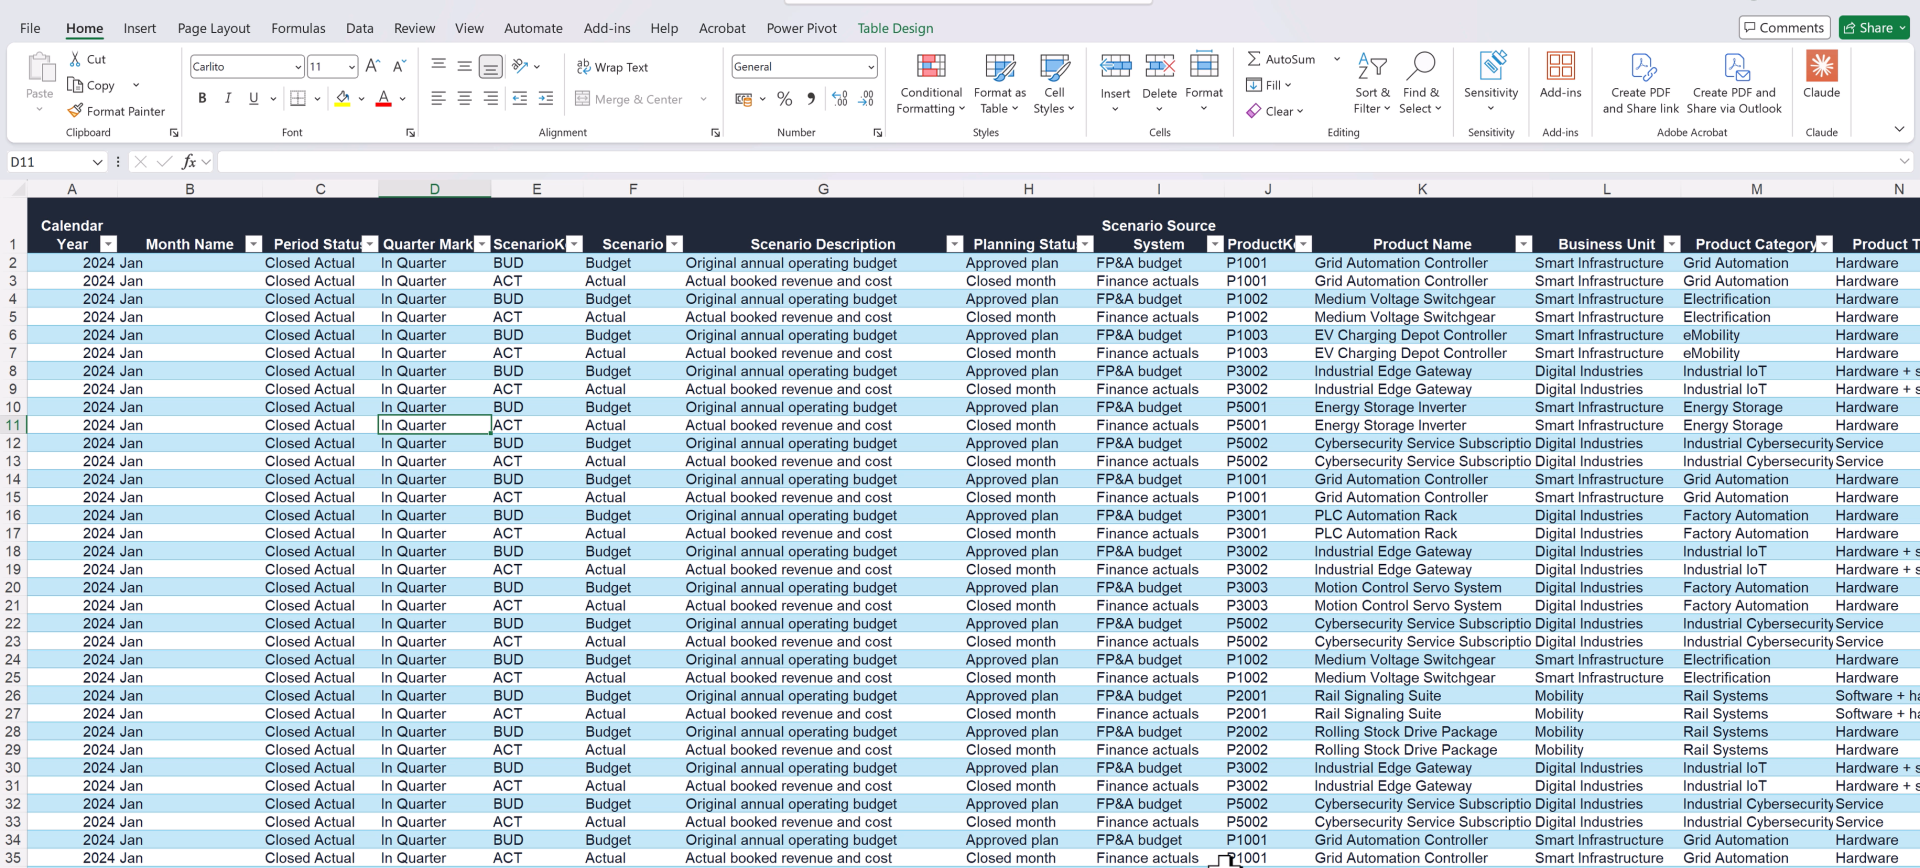
With the setup done, I role-played as a finance manager at a large corporation - Siemens. Starting point: an Excel file with typical financial data. Sales, costs, products, markets, time periods, actuals and plan.
The ask: build a published Power BI report with meaningful insights. Semantic model, measures, audience-appropriate content, visuals, all of it.
Dataset: roughly 5,000 rows, 69 columns - a classic flat table in excel.
I saved a blank report as PBIP (finance) in my project folder, dropped the Excel file in alongside it, opened the report in Power BI Desktop, and connected AI to it. Then I started prompting.
What I ran and how did it look?
Step 1: Semantic Model
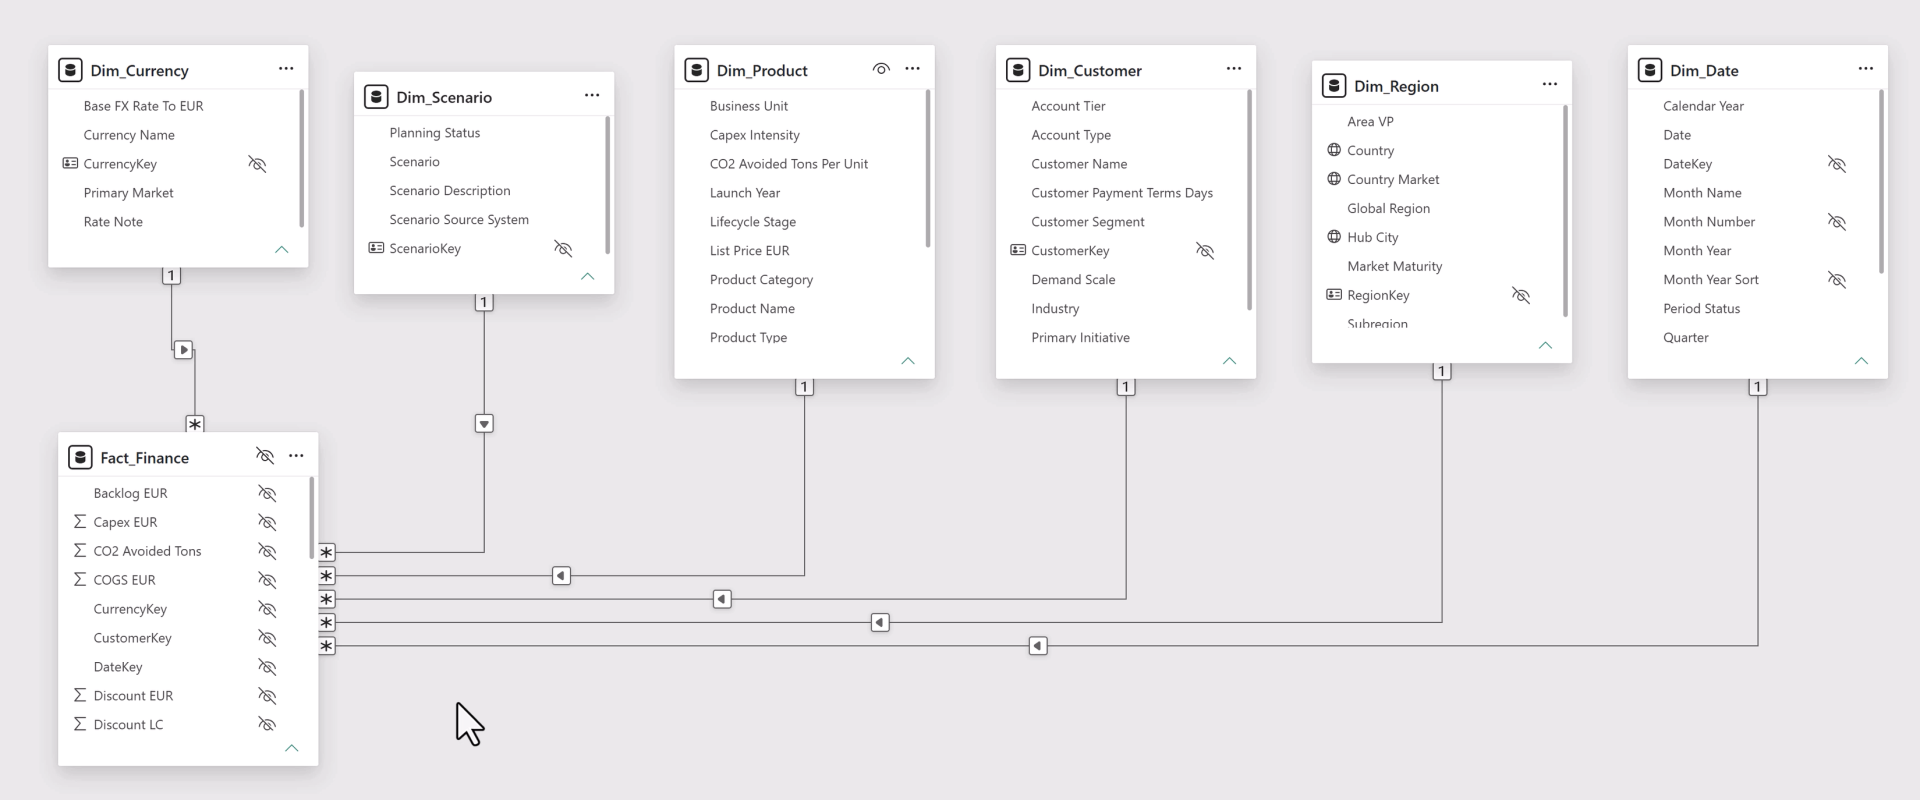
First prompt: import the Excel file and build an optimized star schema - fact table, dimension tables, date table, sorting columns, hierarchies, sensible aggregations, and a separate measure folder with core measures and time intelligence.
It scanned the dataset, designed the model before building, then worked through Power Query to split out the tables. The result was solid: dimension tables for currency, customer, product, and region; a properly marked date table; a measure table with core and time intelligence folders.
Step 2: Report Planning
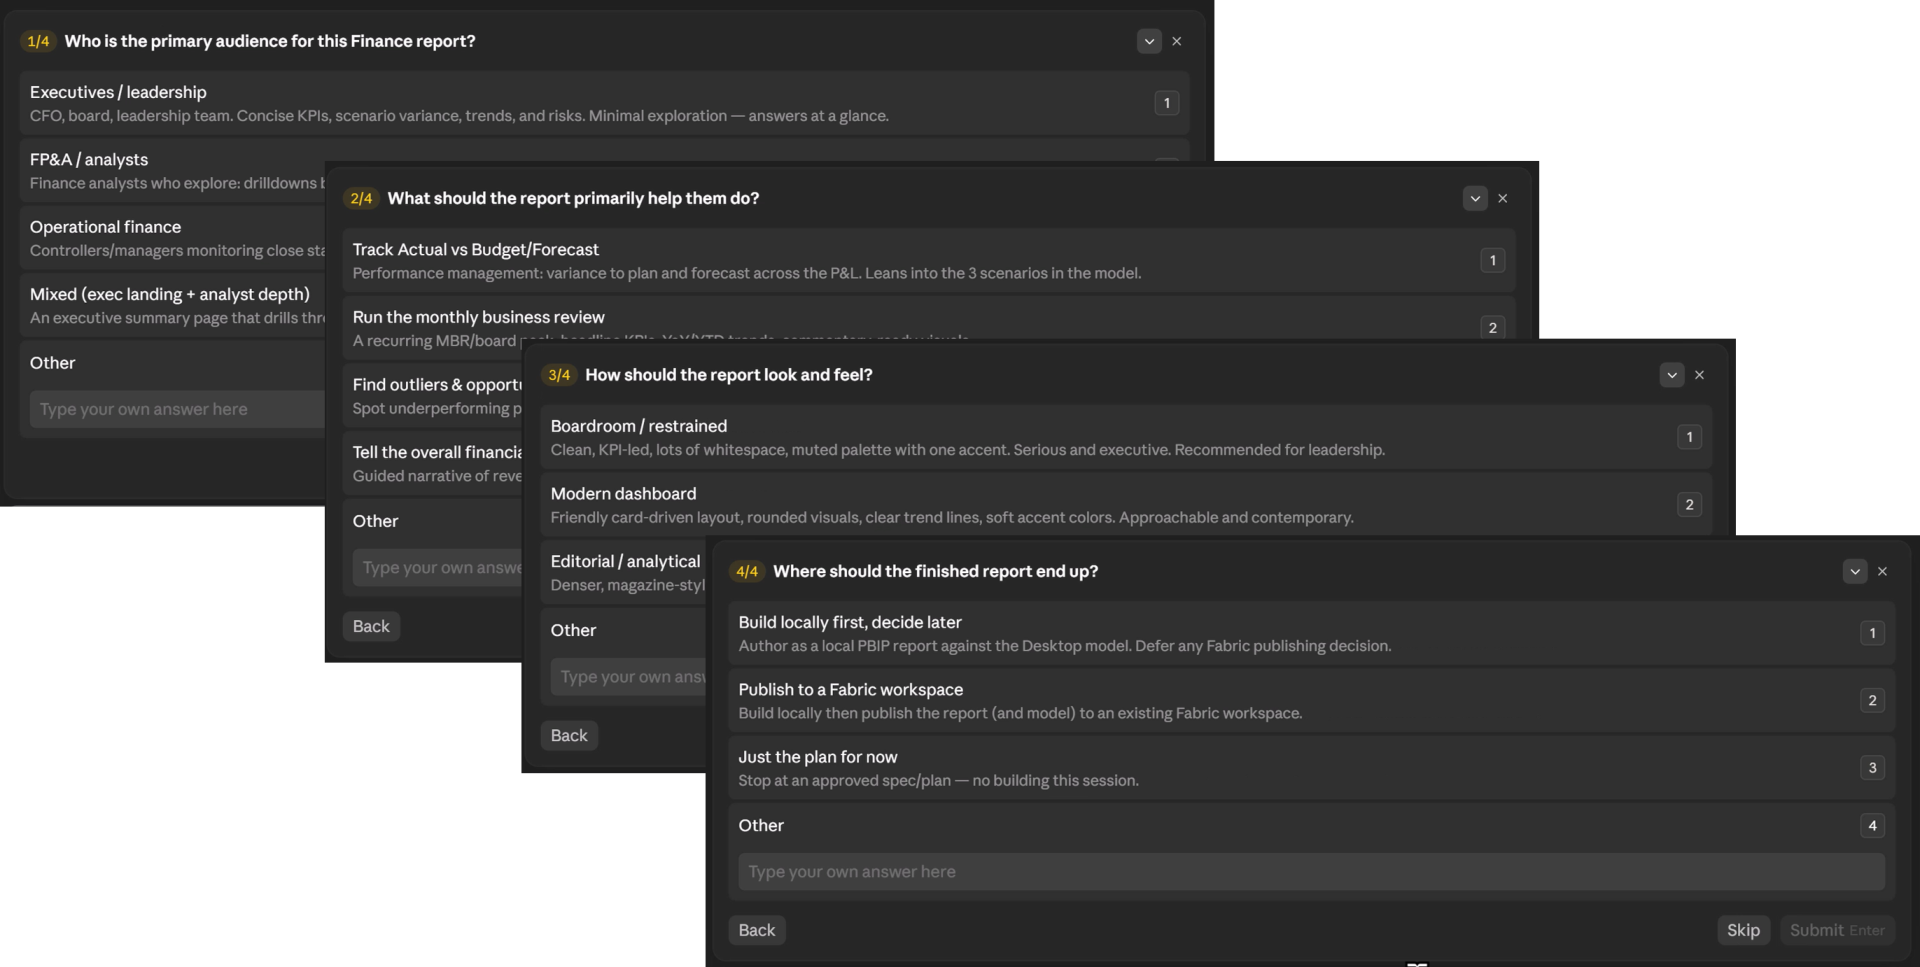
I didn't invoke the planner skill manually. I just asked broadly what pages the report should contain, what visuals, and how it should look. AI routed to the Power BI Report Planner skill on its own.
It asked questions about the audience, primary goal, how the report should look like, and publish target.
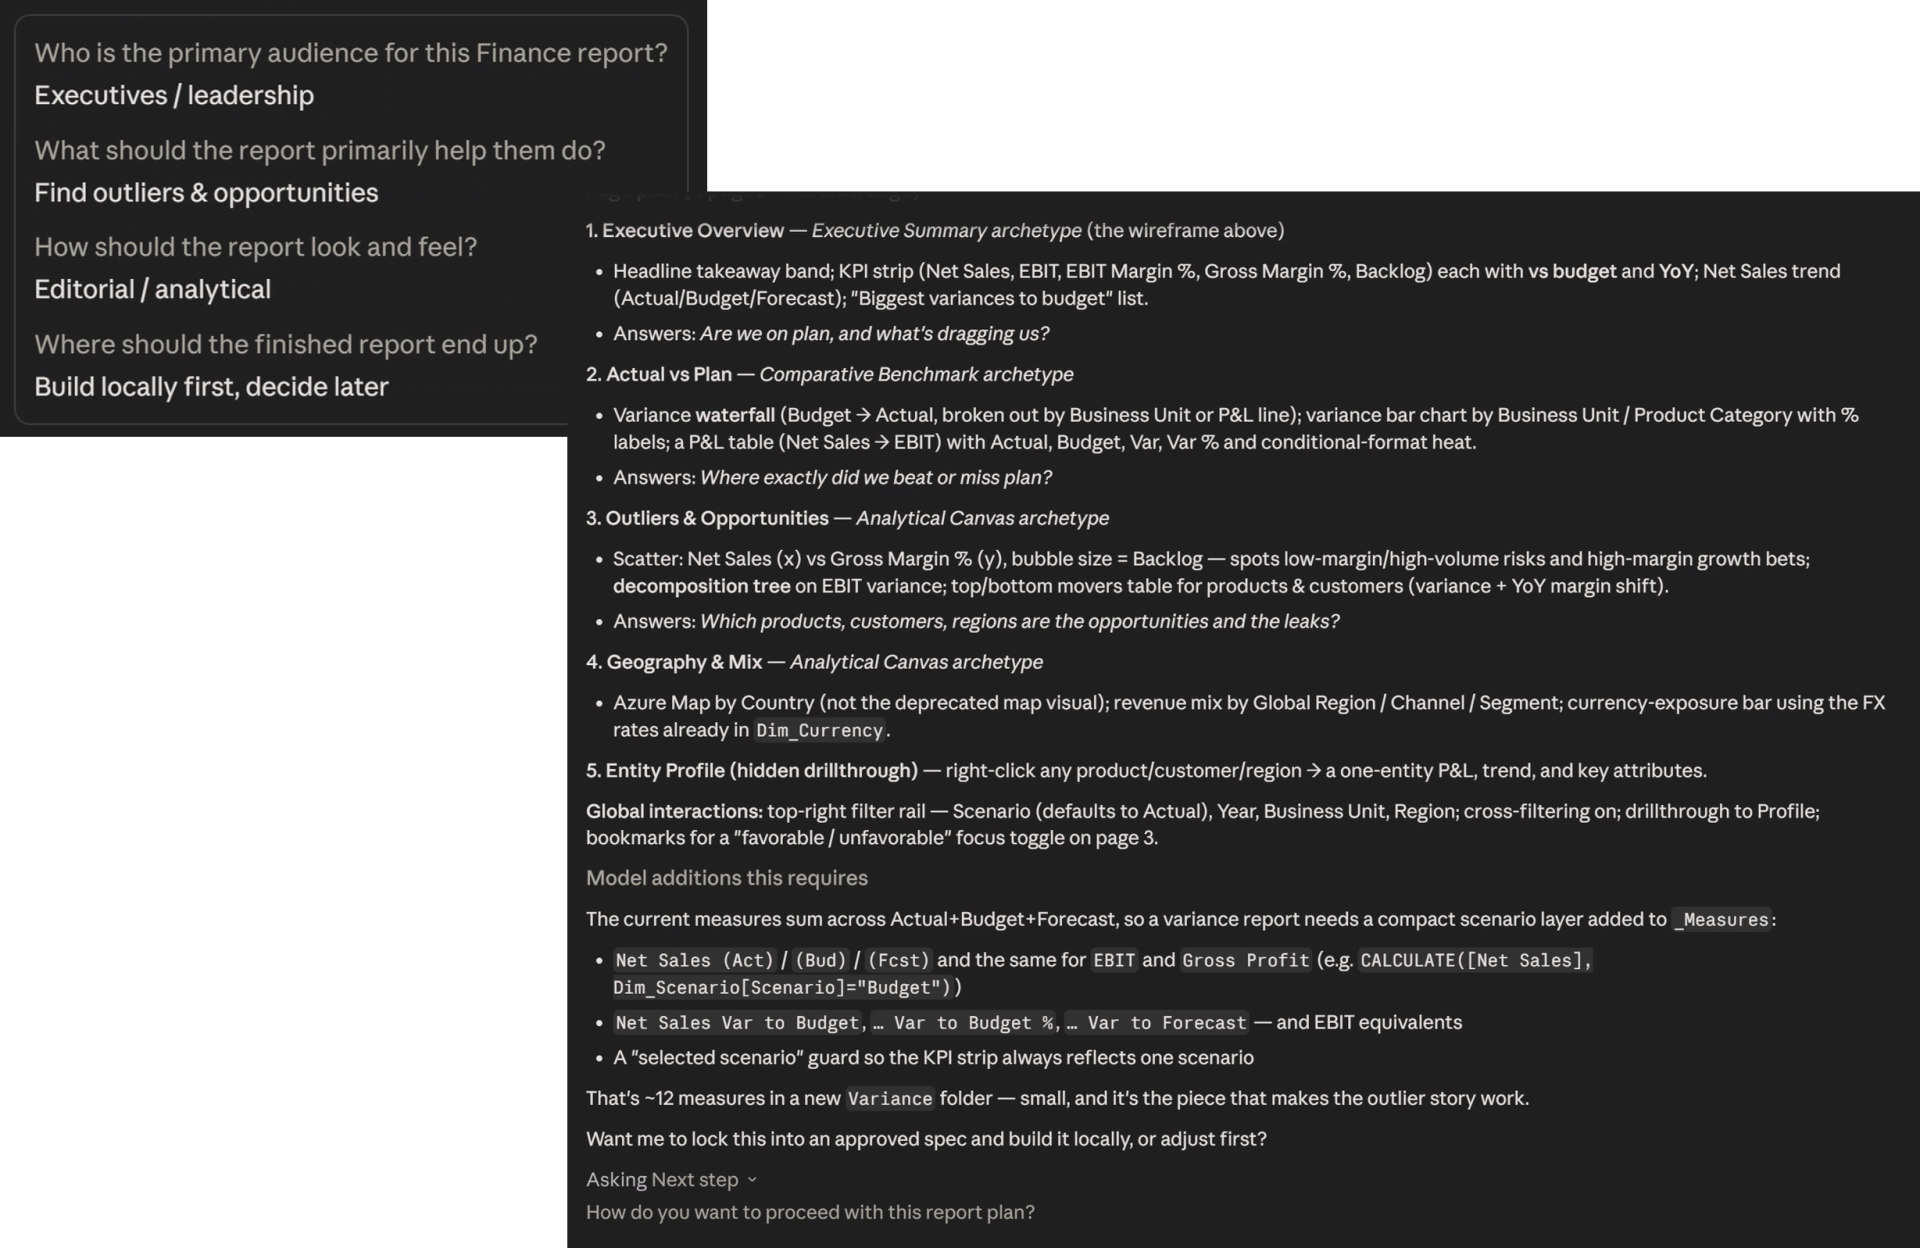
Output: a locked spec with four pages plus drill through - Executive Overview, Actual vs Plan, Outliers and Opportunities, Geography and Mix.
Step 3: Design and build
After approving the plan, it used the design skill to think through what visuals would best fit and how they should by styled (theme). Then it was time to actual build the front-end using the Power BI authoring skill. Because of Power BI desktop bridge it is able to show the changes live and take screenshots to get to the result you are looking for.
One thing worth noting here, is: While it was running it flagged KPI card issues but the fixes didn't fully land until I closed the report, chose "Do Not Save" when prompted, and reopened it. Why?
This came up multiple times, and it's confusing until you understand what's happening.
AI writes changes directly to your PBIP files on disk - the JSON and text files that make up your report. Power BI Desktop, meanwhile, holds its own in-memory copy of the report. When those two get out of sync, things look broken even though the files on disk are correct.
Saving too early makes it worse: Desktop can flush its stale in-memory state over the changes AI just wrote. The fix that worked - every time - was to close the report, choose "Do Not Save" when Desktop asks, and reopen the file. That forces Desktop to reload from disk, picking up what AI actually wrote. No save needed. Counterintuitive, but it works.
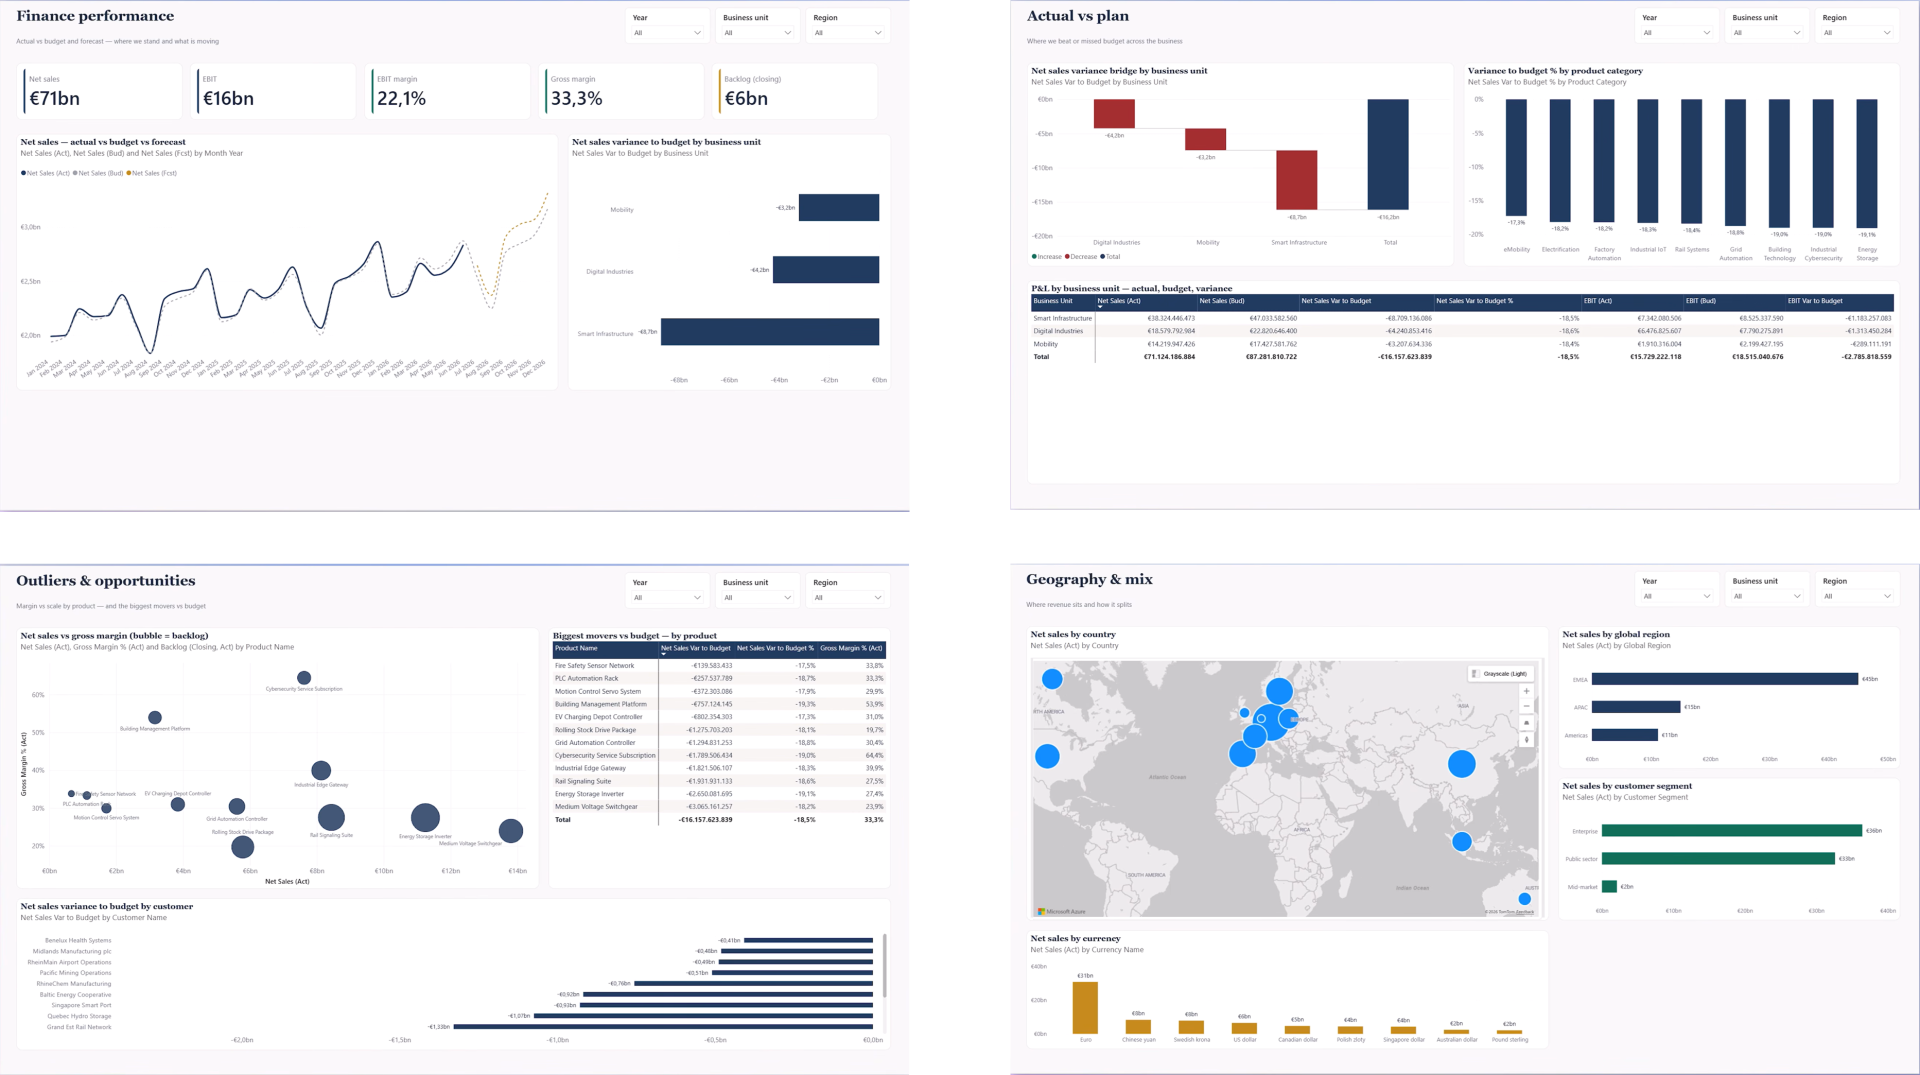
Step 4: Branding
To test how well it could adjust the look and feel of the report I pointed AI at siemens.com - dark blue, teal, white, gray and asked it to get it more on brand. It did a pretty good job.
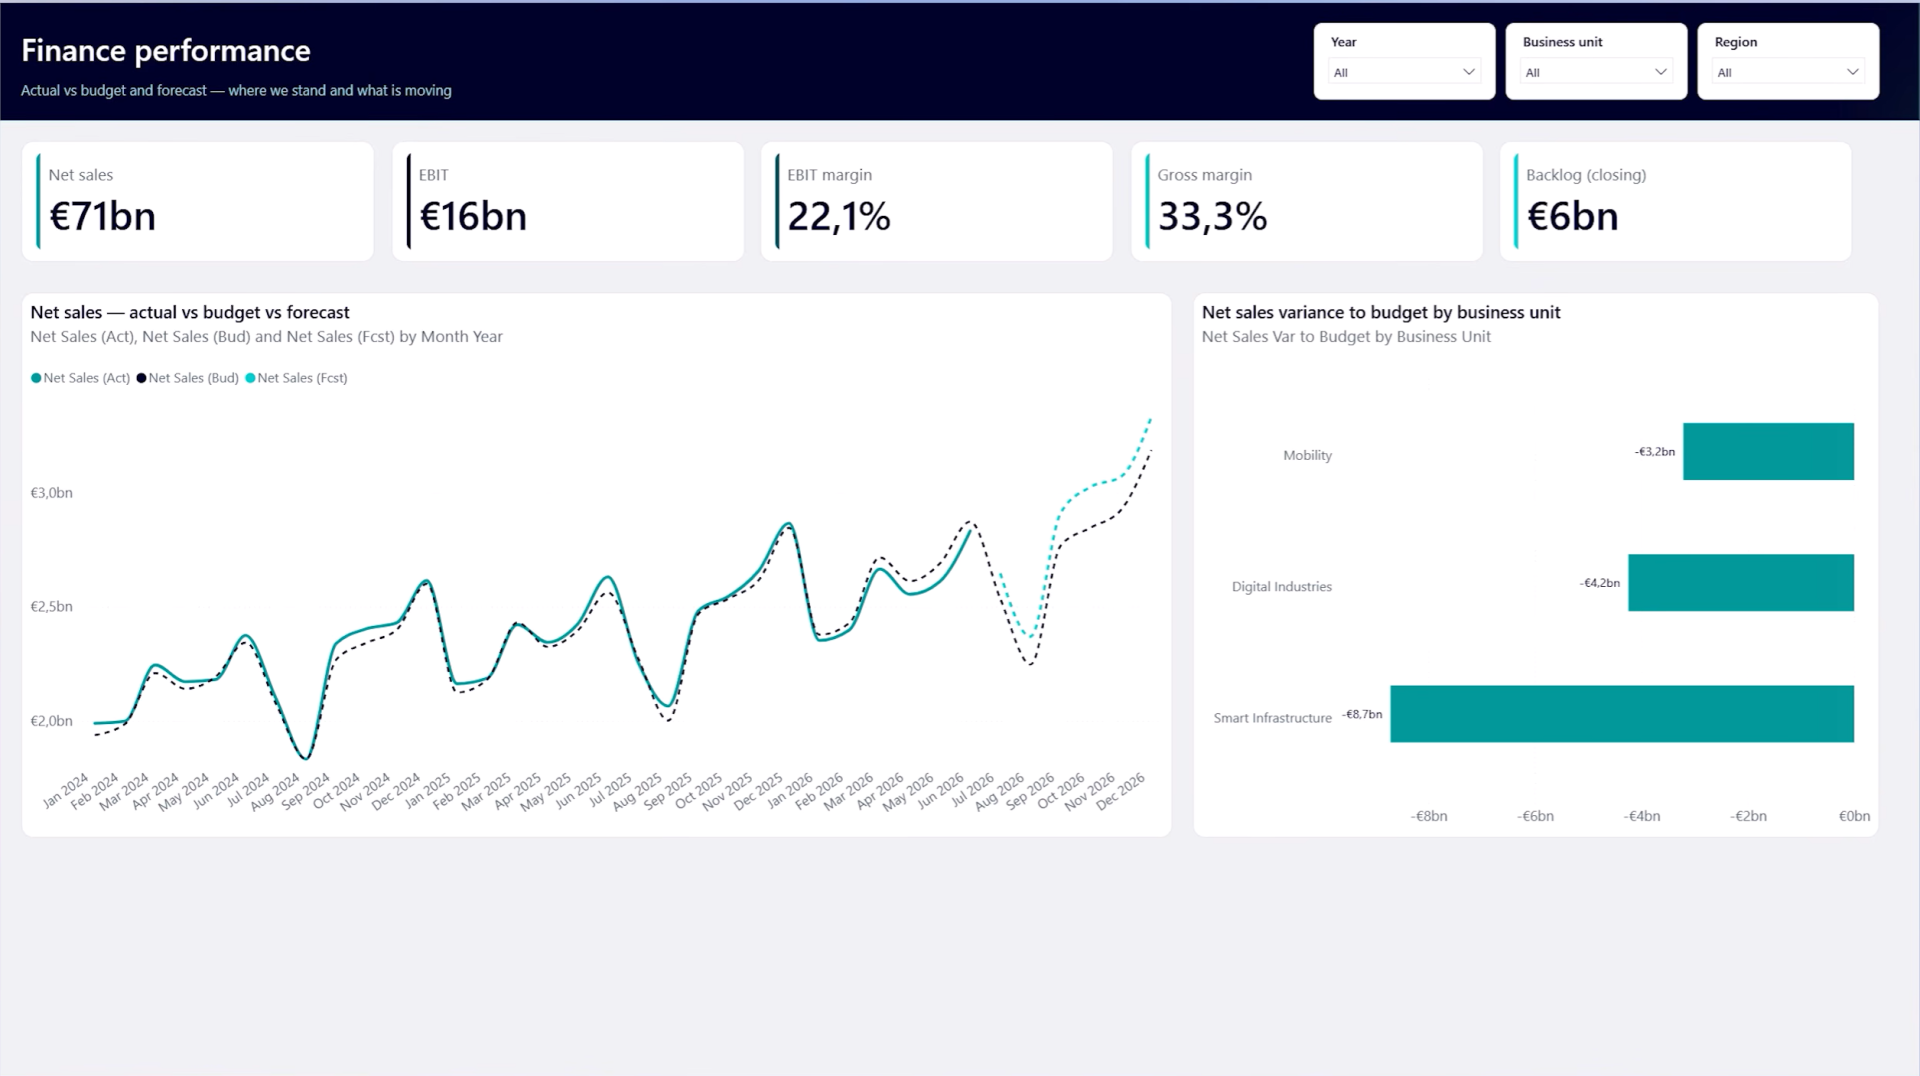
Step 5: KPI polish
When I started to push it a bit more on features such as reference labels (like defined in the spec) or error bars it wasn't able to do so. This is because the skill doesn't have the full json structure of certain elements yet (everything is still under preview).
Overall, close. Not perfect. Fixable with another prompt - or a custom skill once the reference documentation exists.
Where this leaves us
After about 2 hours and 500k tokens AI built a whole report. Pretty good, however not fully end-user ready just yet. Moving beyond the standard layout of the charts is still a bit tricky for AI unless you create the skills for it (or do it yourself).
These developments are super exciting (also check out the Fabric plugins).
Hope you like it!
Give it a try and see how it works for you! I’d love to hear what you think or see how you use this trick in your own reports.