1. TMDL view
TMDL writes your semantic model out as plain text. Every measure shows its formula, its format and its display folder in a few lines you can read without clicking through the Properties pane.
Here's the difference. In the formula bar, a measure is only its DAX:
In TMDL view, the same measure looks like this:
Formula, format and folder, all in one place.
That doesn't look like much until you have lots of measures and you need to move half of them into a new folder. In the old way you click each measure, change the folder, and repeat. In TMDL view you edit the text, change many measures at once, and apply it to the model in one step. Renaming folders and fixing format strings across a whole model takes minutes.
It's also the easiest way to understand a model you didn't build.
2. User-defined functions (UDFs)
A user-defined function is a calculation you write once and reuse. You give it inputs and it gives you back the result.
Take a margin calculation. You define the function once:
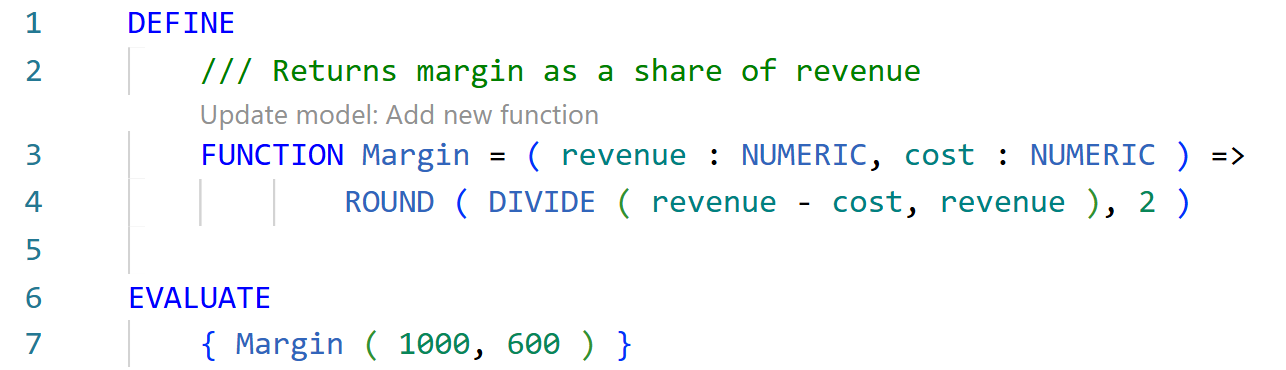
Then each measure calls it with its own values:

It's most useful if the business decides margin should be calculated differently, and you change the function in one place, and every measure that uses it updates with it.
A real example: dynamic format strings
I wanted Sales Total to show its values in thousands, and the 2.3 million total in millions. A dynamic format string handles that. In the Measure tools ribbon, switch the format to Dynamic and write the logic:
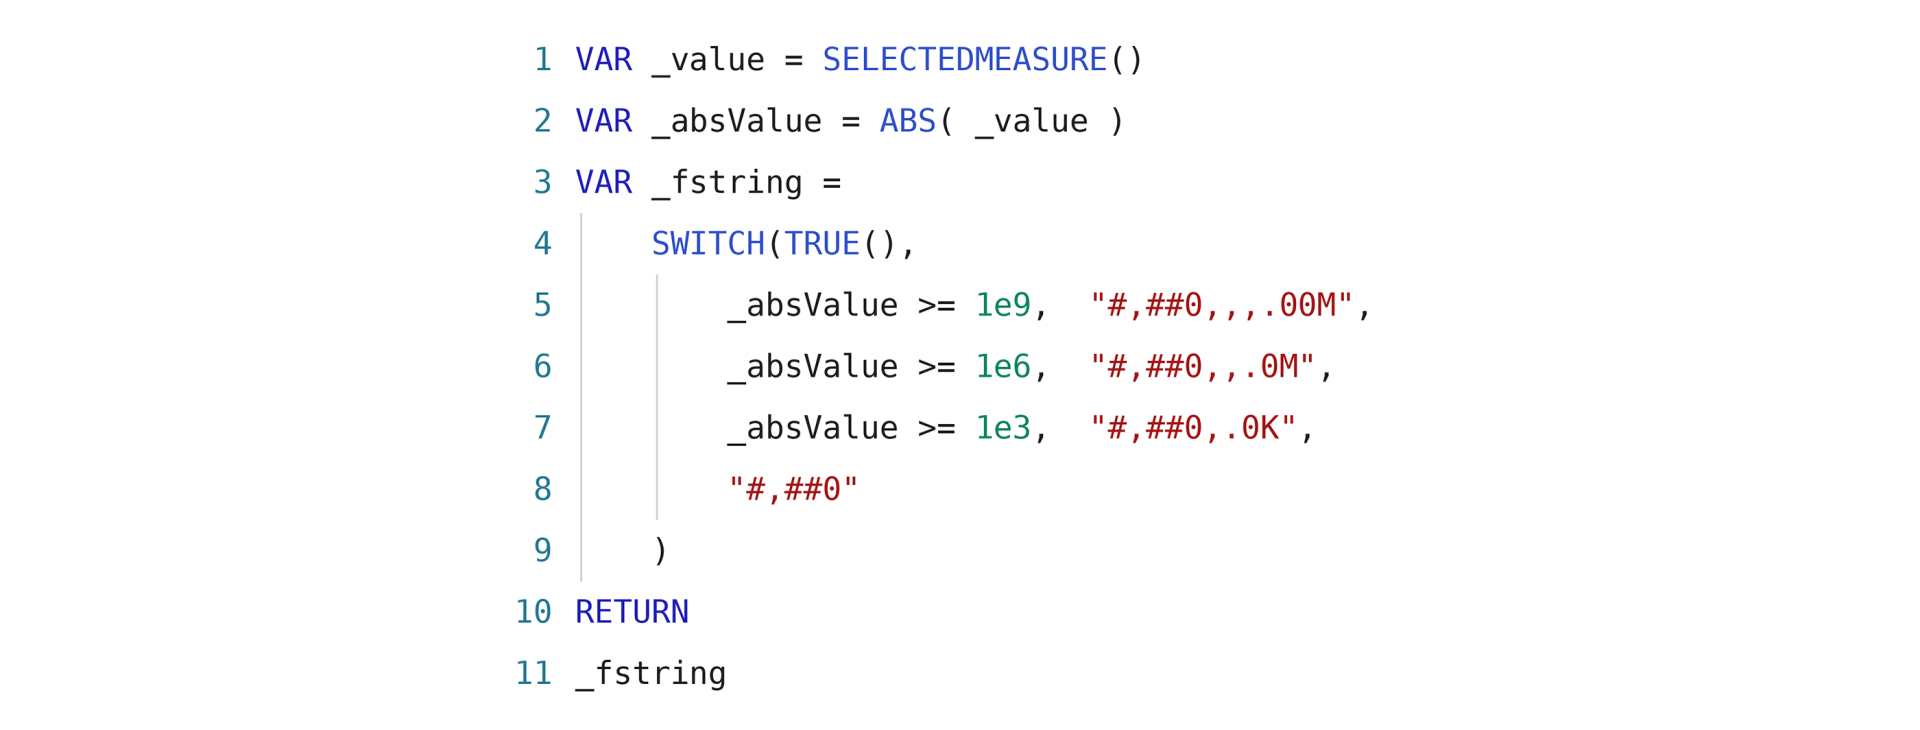
Then I wanted the same logic for Profit Total. I could copy the code into that measure too, and it works. But now the same logic lives in two places, and every change means opening every measure that uses it.
So I moved it into a function. In DAX query view, you write:
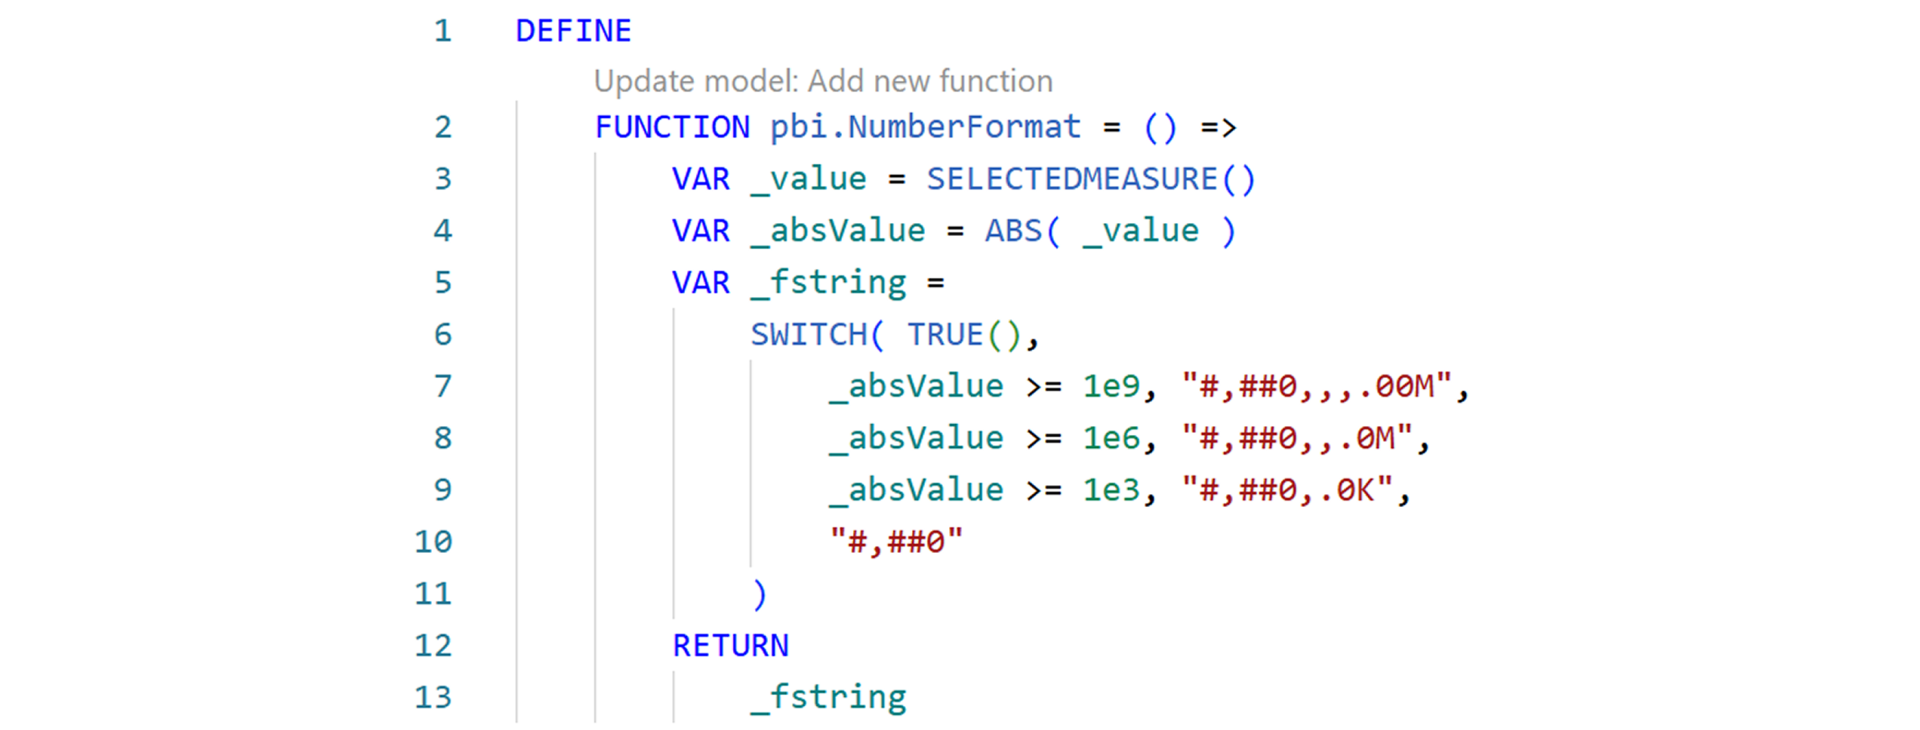
Click Update model (you only need to do this once), and the function shows up on the right-hand side under Functions. You can do the same from TMDL view too: drag the function into the editor and you'll see it looks almost identical.
Now go back to each measure's dynamic format string and replace all that code with one line:

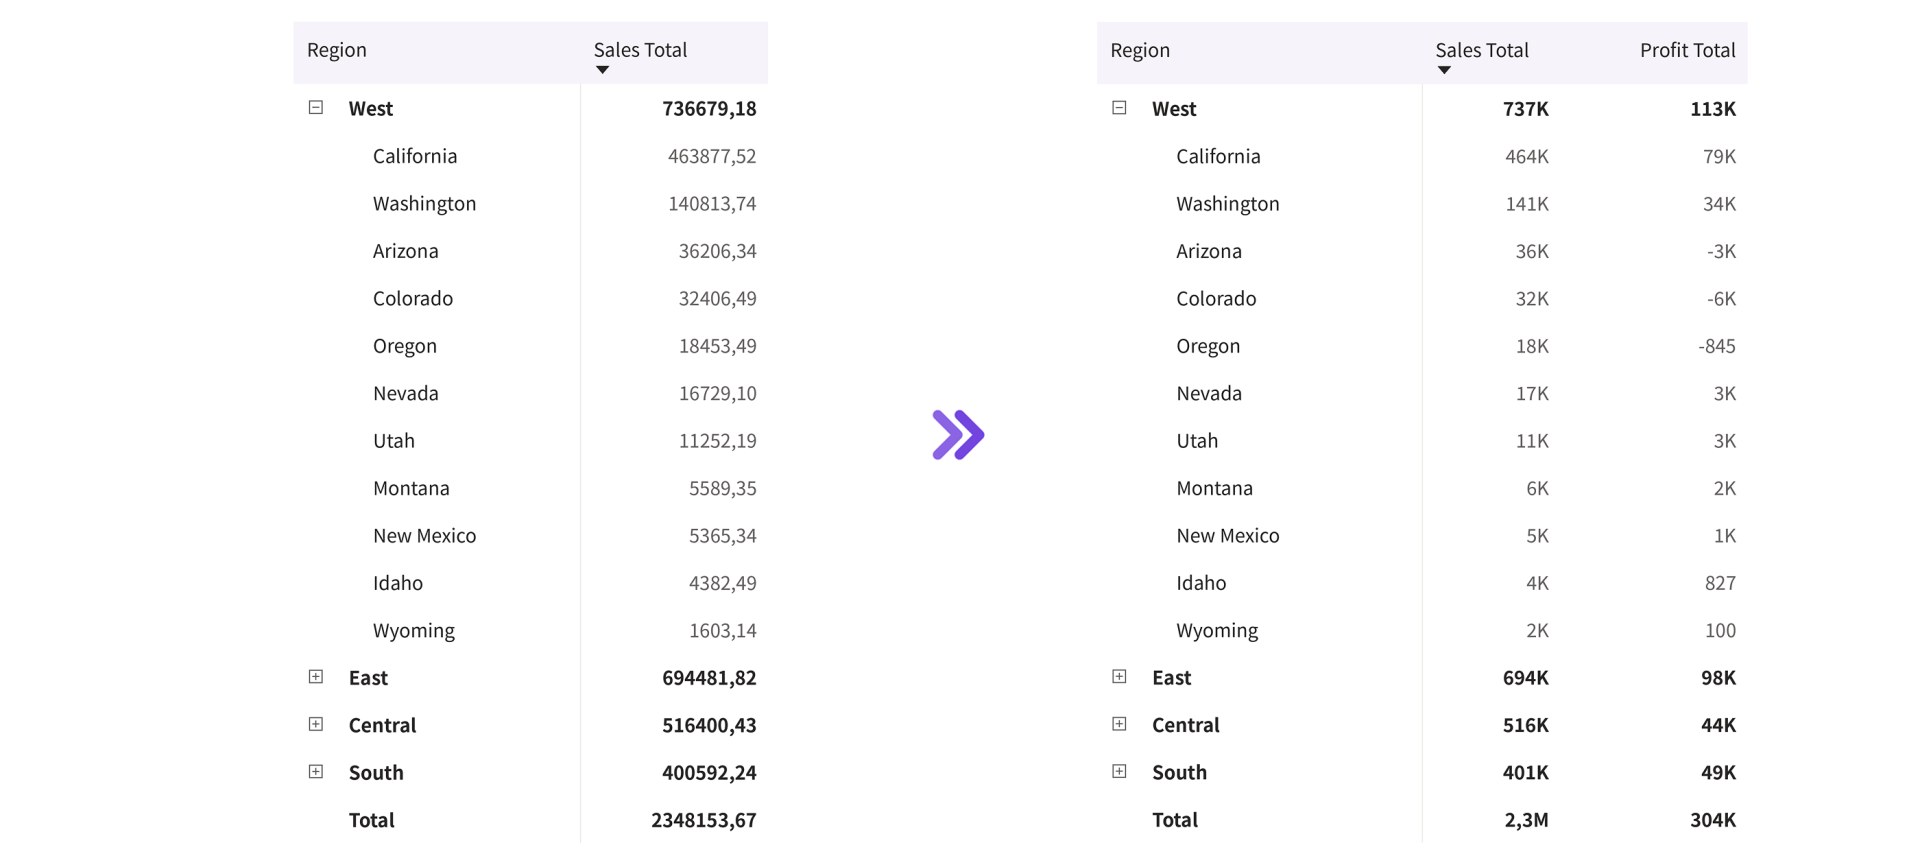
The function works and the next time the formatting rules change, you edit the function once and every measure follows.
You'll find this example, and a few more, in my
video on user-defined functions.
If you want to take it to the next level, see my
full training.
3. PBIP and Git
Save your report as a Power BI Project (.pbip) and Power BI splits it into folders of plain text files: one for the report and one for the model. The model folder is the same TMDL you just learned to read.
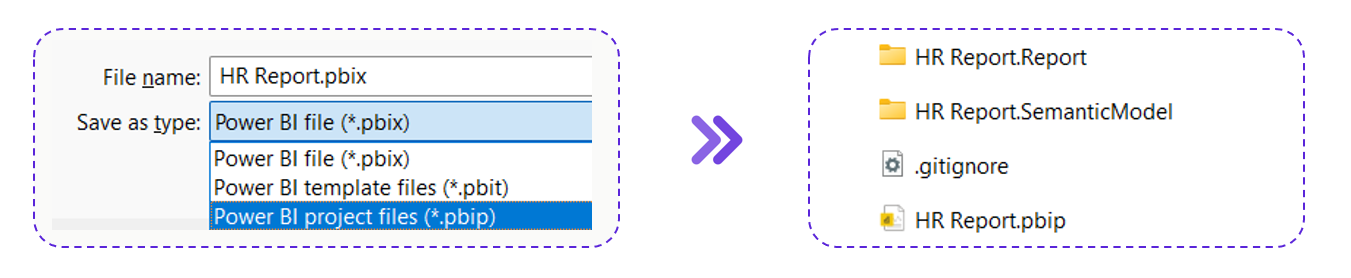
Now put that folder in Git. From then on, every save shows exactly which measure or visual changed. You can go back to any earlier version, and two people can work on the same report without emailing files back and forth.
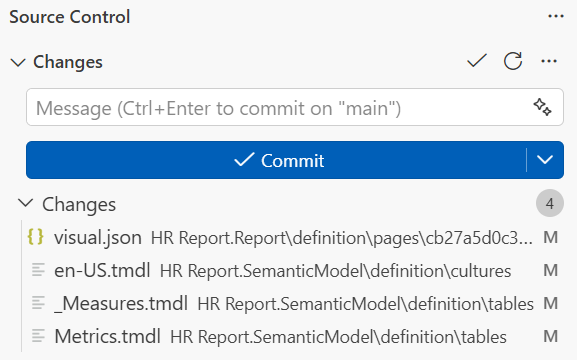
You don't need to know much to start. Commit, see what changed, go back if something broke. That covers most of what you'll need for the first few months.
4. MCP and AI agents
MCP (Model Context Protocol) gives an AI agent tools to work with other software. With the Power BI Authoring MCP server, you can ask an agent in plain language to add measures, rename objects in bulk, or write descriptions for every table and column in your model.


The skills I tested in my video
A general AI model doesn't know every Power BI setting or how PBIP files are put together, so Microsoft built Skills for Fabric: a marketplace of plugins with instructions the agent loads when it needs them.
The skills are free in Microsoft's
skills-for-fabric repository on GitHub. In Claude Code, go to Customize > Plugins > Add Marketplace, paste the repo URL and enable the plugins. In VS Code, use Settings > Plugins > Install plugin from source with the same URL. Then save a report as PBIP in your project folder and start prompting.
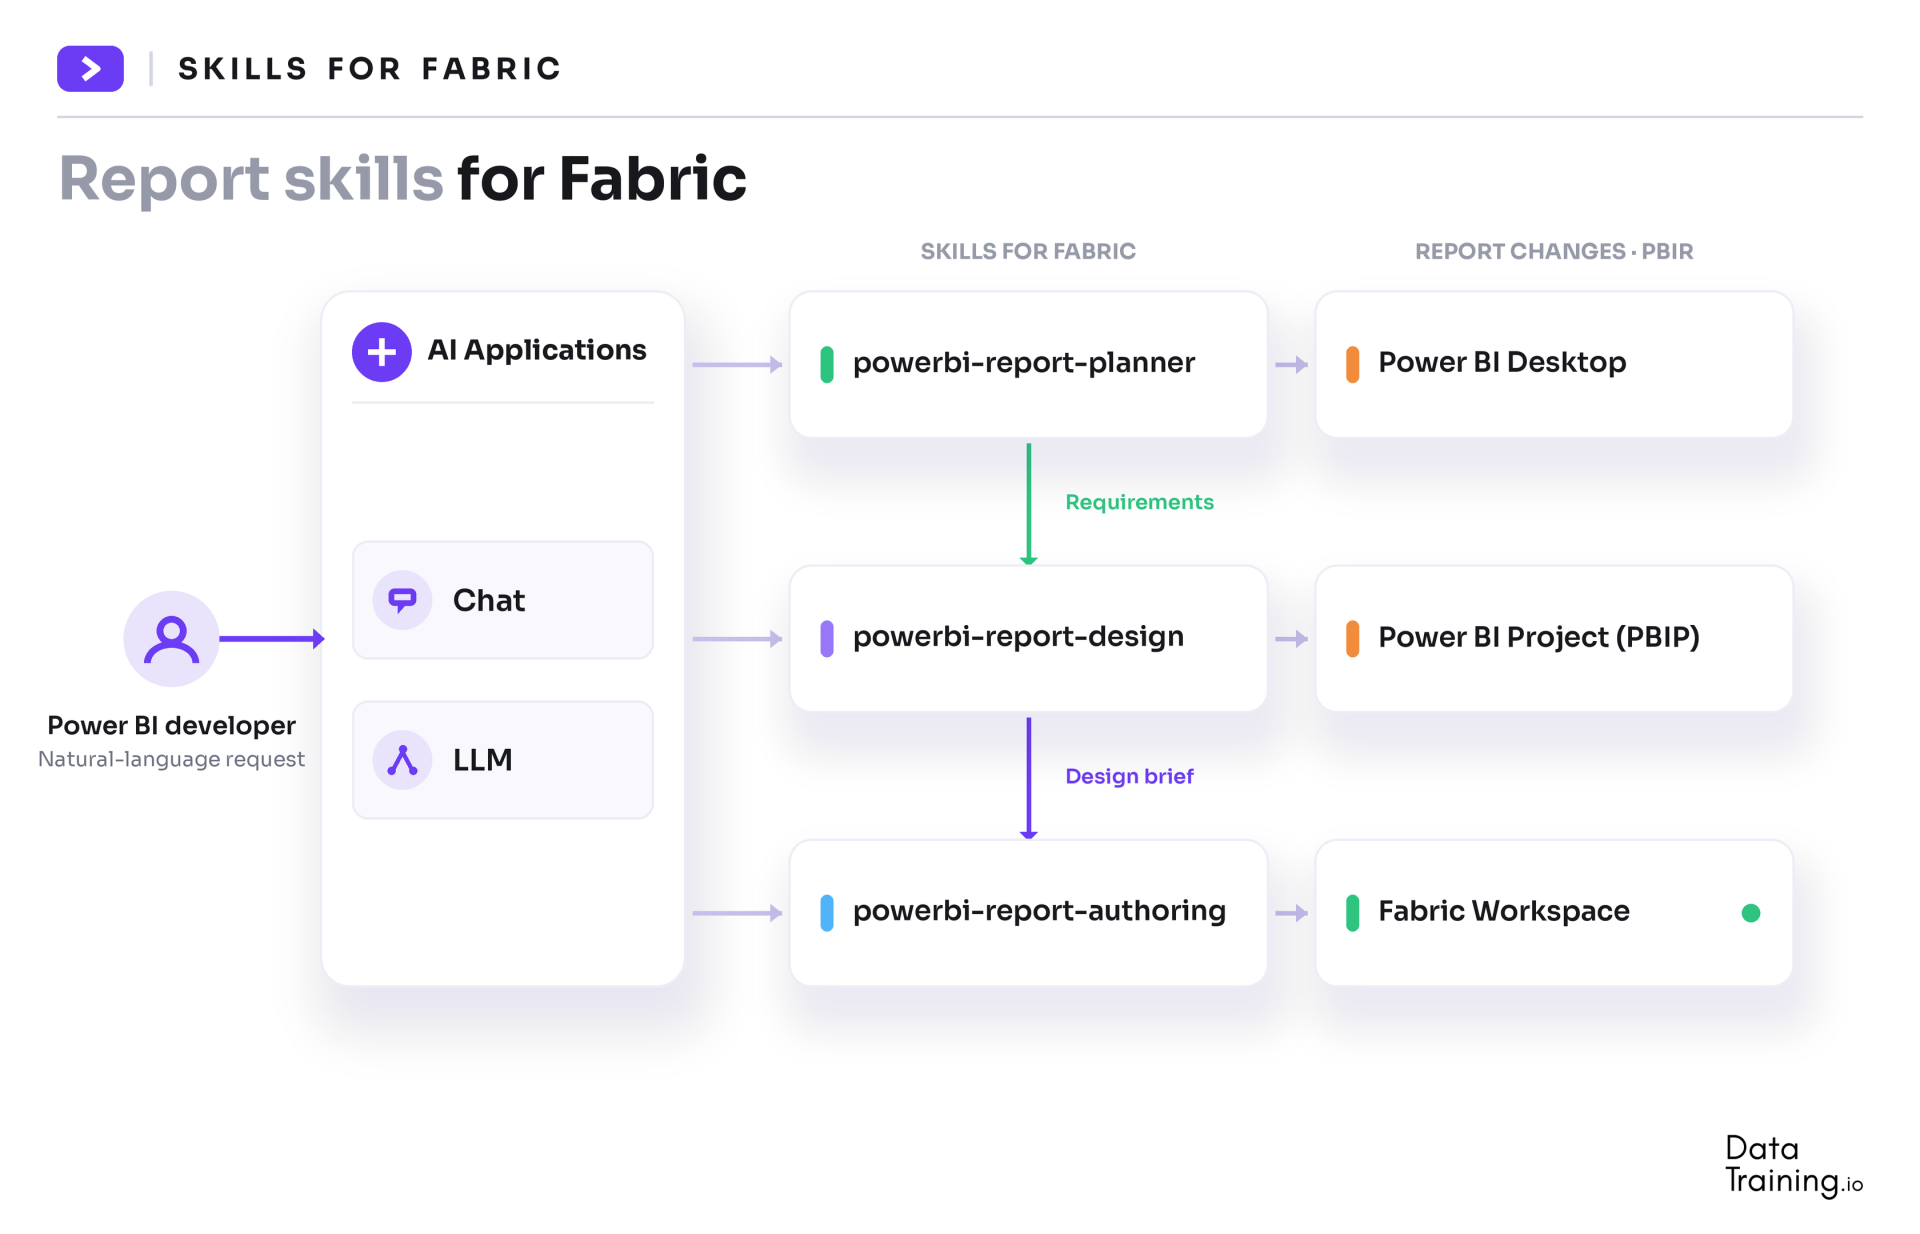
The Power BI Reporting plugin has a skill for each stage of building a report:
- Power BI Report Planner works out what the report needs for its audience.
- Power BI Report Designer decides how to show it: which visuals, what layout, what look.
- Power BI Report Authoring builds it.
The work happens in a PBIP project, and the Desktop Bridge takes screenshots of the open report so the agent can check its own progress. Skills are plain markdown files, so you can add your company theme, chart preferences or templates and make them your own (simplified Microsoft diagram):
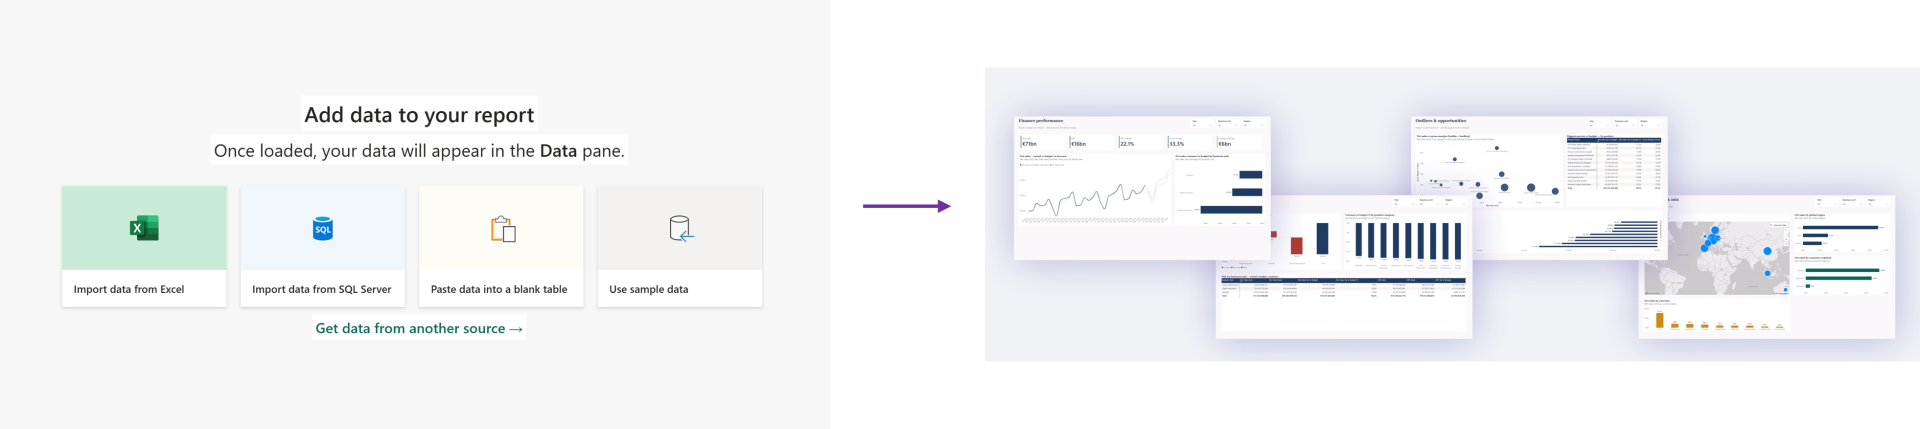
A finance report from one Excel file
I played a finance manager at Siemens with one flat Excel file and asked the agent for a full report. It built a star schema, planned four pages with the Planner skill, then designed and built them and matched the Siemens brand colors. About two hours and 500k tokens later I had a working report. It was close, but things like reference labels and error bars aren't supported yet, so it still needed some finishing by hand.
Where I'd start
Pick one report you know well, open TMDL view and read through the model. Then move one repeated calculation into a function. Save the report as a PBIP project, put it in Git, and then try an AI agent on it. You'll learn all four skills on a single report.
Hope you like it!
Give it a try and see how it works for you! I'd love to know which one ends up saving you the most time.