Hack 1: Create a Reusable Code LibraryWhile every report is different, many DAX and M functions tend to repeat.
Examples include:
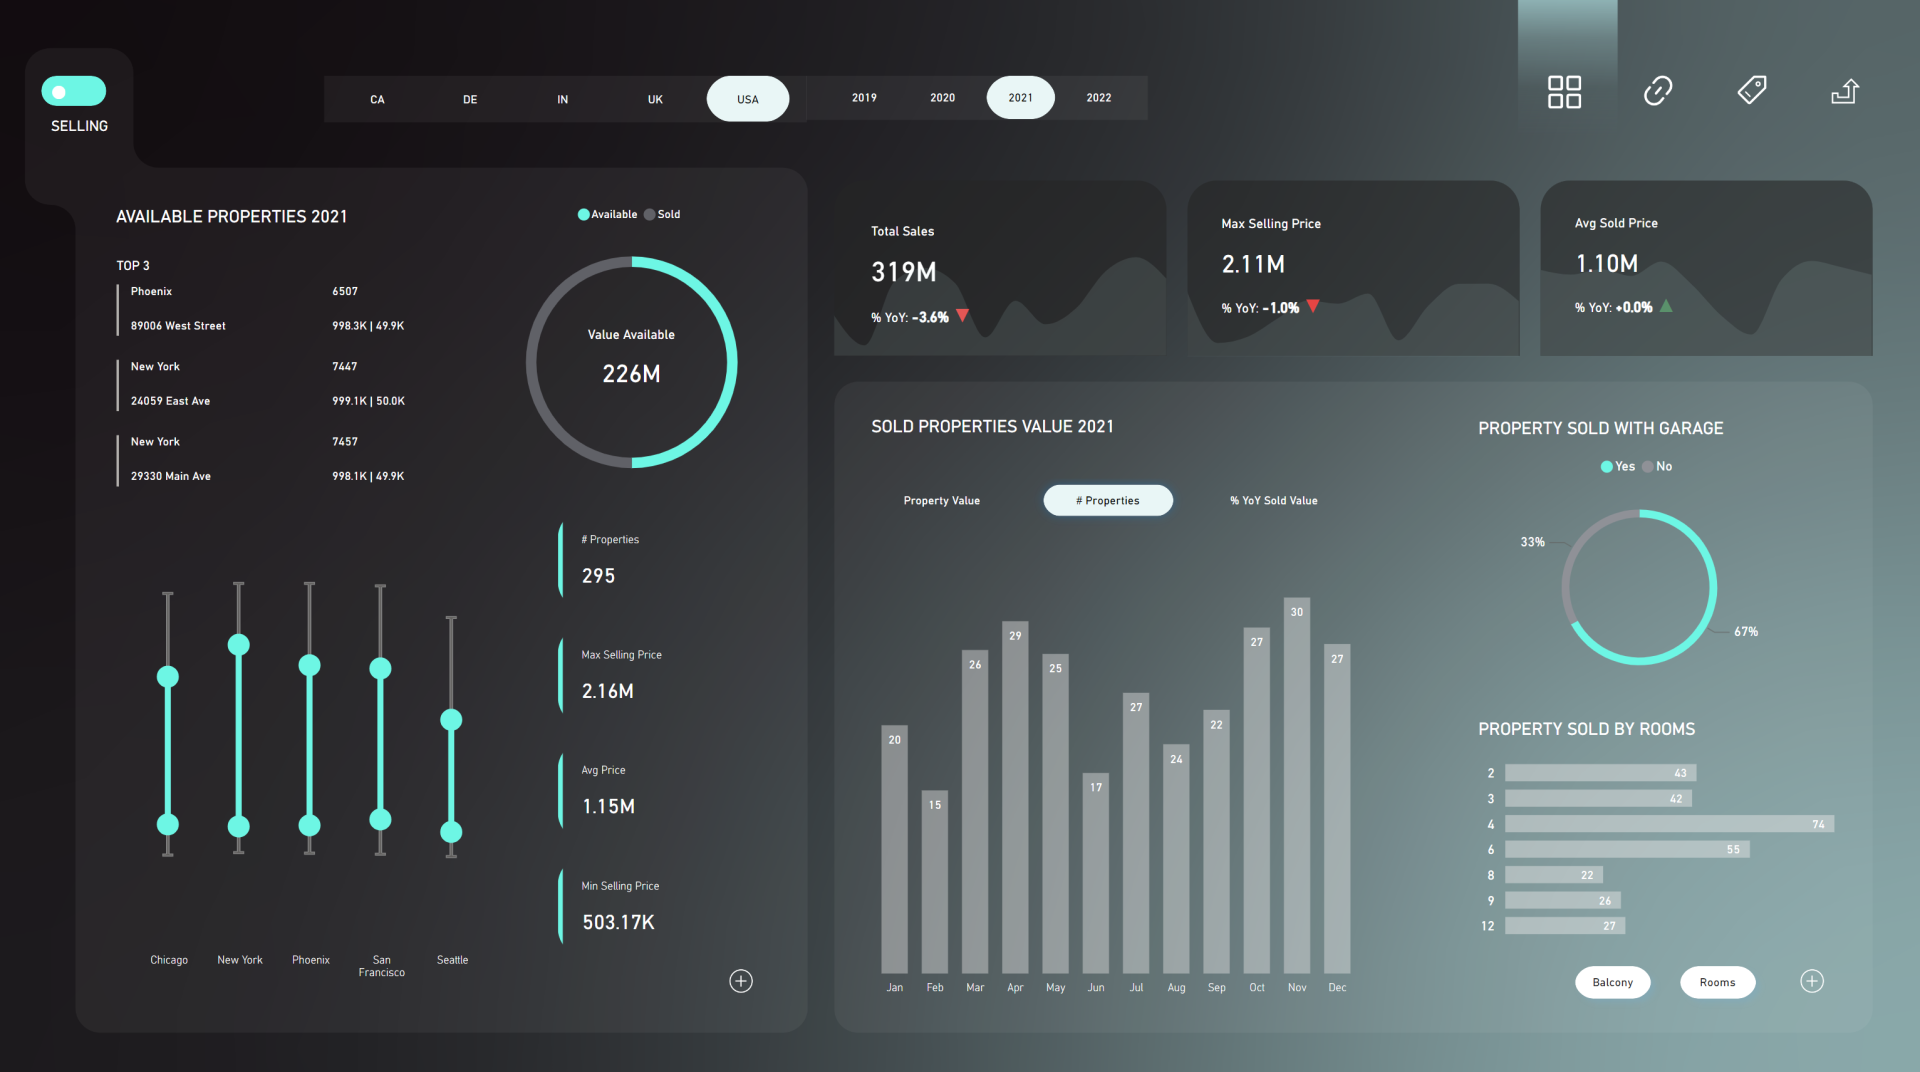
- Highlighting the max/min value in a chart
- Showing top N values
- Above-average calculations
Instead of rewriting them from scratch, you can store them as templates and reuse them.
Step 1: Save Your Measures to a Central File
Start by copying your useful DAX expressions to a .txt file that you store in a centralized location. Over time, this file can get messy - especially if others are contributing too.
Step 2: Use GitHub for Better VersioningA better approach is to use
GitHub to store your reusable code. It supports collaboration, version control, and is accessible from anywhere.
1. Create a GitHub account.
2. Set up a private repository for your Power BI assets.
3. Add your first file, e.g., CF_Highlight_Max_Min.md.

4. Copy and paste your DAX measure into this file and commit the change.
5. Repeat this process for other templates like “Above Average”.
Step 3: Access Templates EasilyYou can:
• Access templates online through GitHub
• Use GitHub Desktop to sync with your local machine
• Open them in Visual Studio Code for easier editing
Bonus tip: You can also search public GitHub repositories for existing M functions and use them as needed.
Hack 2: Build and Reuse Design AssetsDesign consistency matters, but applying the same formatting repeatedly is tedious. Here’s how to save time:
Step 1: Customize Themes
Use Power BI’s theme editor to create a base theme that reflects your brand or visual identity.
1. Go to View → Themes → Customize current theme.
2. Adjust colors, fonts, and visual styles.
3. Save the theme as a .json file.
4. Open the file in Visual Studio Code or other tool for fine-tuning.
Step 2: Add Advanced Styling
You can manually add elements such as:
• Background color
• Borders and rounding
• Padding
• Visual-specific customizations
Do you want to know what’s possible with the themes in Power BI?
Step 3: Apply and Test in Power BI
1. Import the .json theme into Power BI.
2. Check if the changes (like rounded corners or padding) apply as expected.
3. Make sure features like borders are turned on for full visual impact.
Beyond themes, good backgrounds of the report can significantly enhance the aesthetics.
To make this process efficient:
• Create several background templates in tools like PowerPoint, Figma, or Adobe Illustrator.
• Adjust layout and placeholders per page.
For example, different pages might require slight variations in layout to accommodate visuals:
Maintain a small library of design assets, such as placeholder rectangles, grids, and SVG elements. That way, when you need a new layout, you can duplicate an existing element, modify it slightly, and export a new SVG background.
Hack 3: Use External Tools to Automate Repetitive Work
There are fantastic free tools that extend Power BI’s capabilities and help you work more efficiently.
Tool 1: Bravo by SQLBI
Bravo allows you to:
- Analyze your data model
- Identify unused or heavy columns
- Format DAX
- Create date tables and time intelligence measures
You can also generate full sets of time intelligence measures with just a few clicks.
Tool 2: Quick Measures Pro by Greg Deckler
This tool lets you:
• Generate advanced DAX expressions
• Use templates for SVGs, ranking, forecasting, etc.
• Create visuals based on measure-driven SVGs
You can create a new DAX measure in seconds using pre-built logic.
Final Thoughts
These three strategies can drastically improve your Power BI productivity:
1. Centralize your reusable code with GitHub
2. Build and refine themes and design templates
3. Leverage external tools to speed up modeling and calculations
By setting up these systems, you’ll spend less time on repetitive tasks and more time delivering insights.
Hope you like it!
Give it a try and see how it works for you! I’d love to hear what you think or see how you use this trick in your own reports.