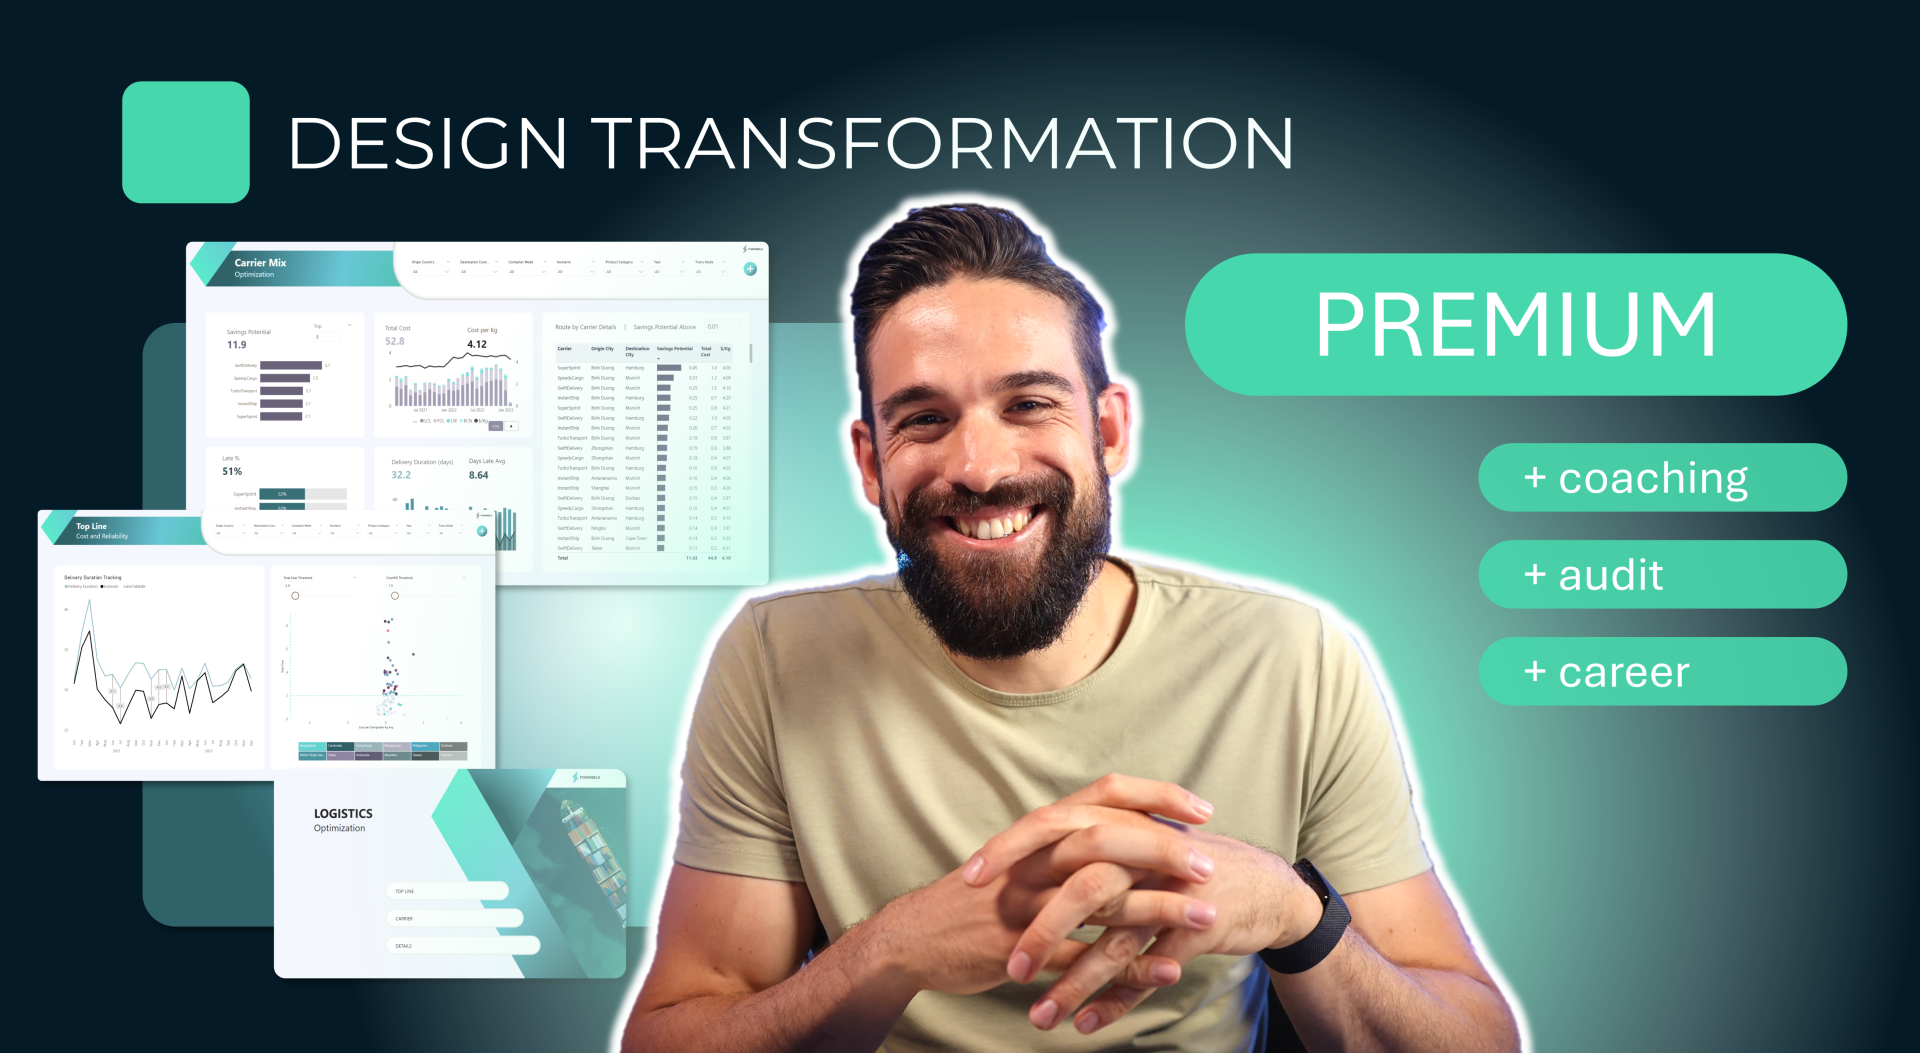
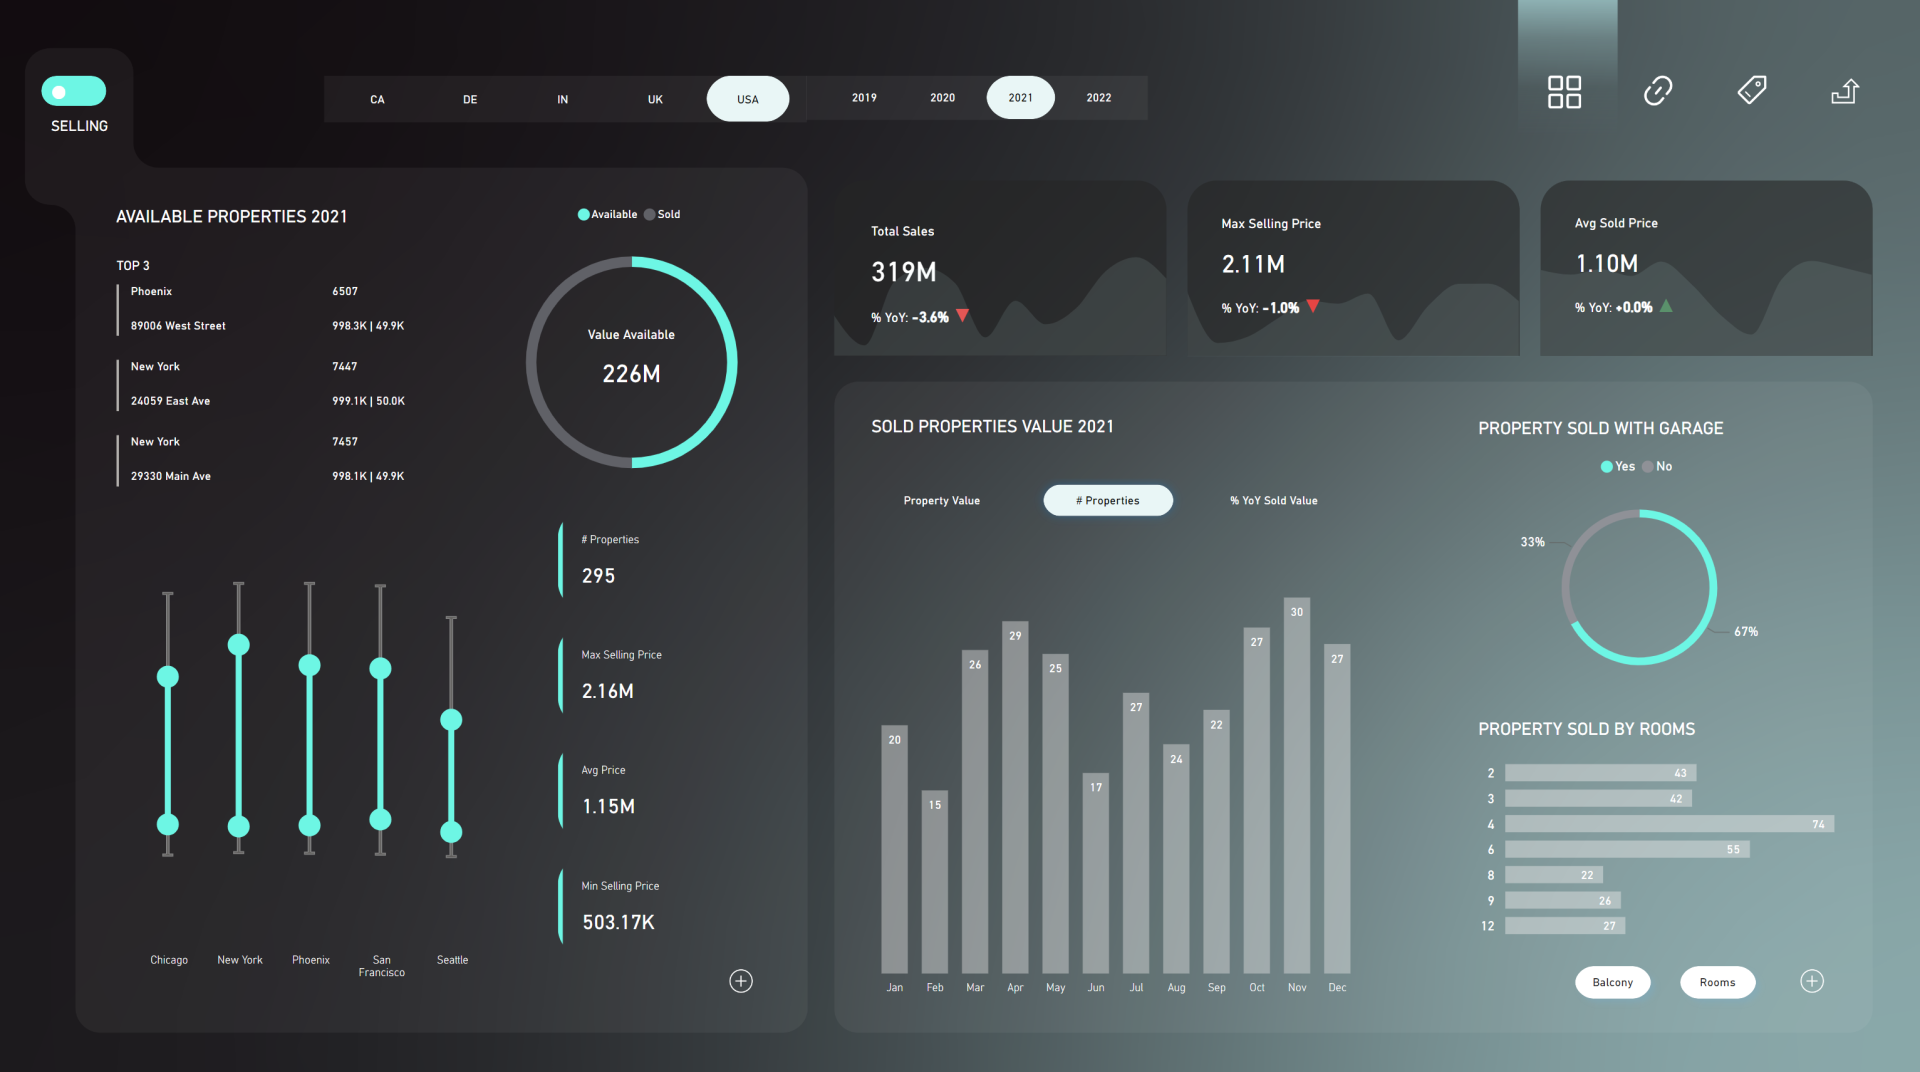
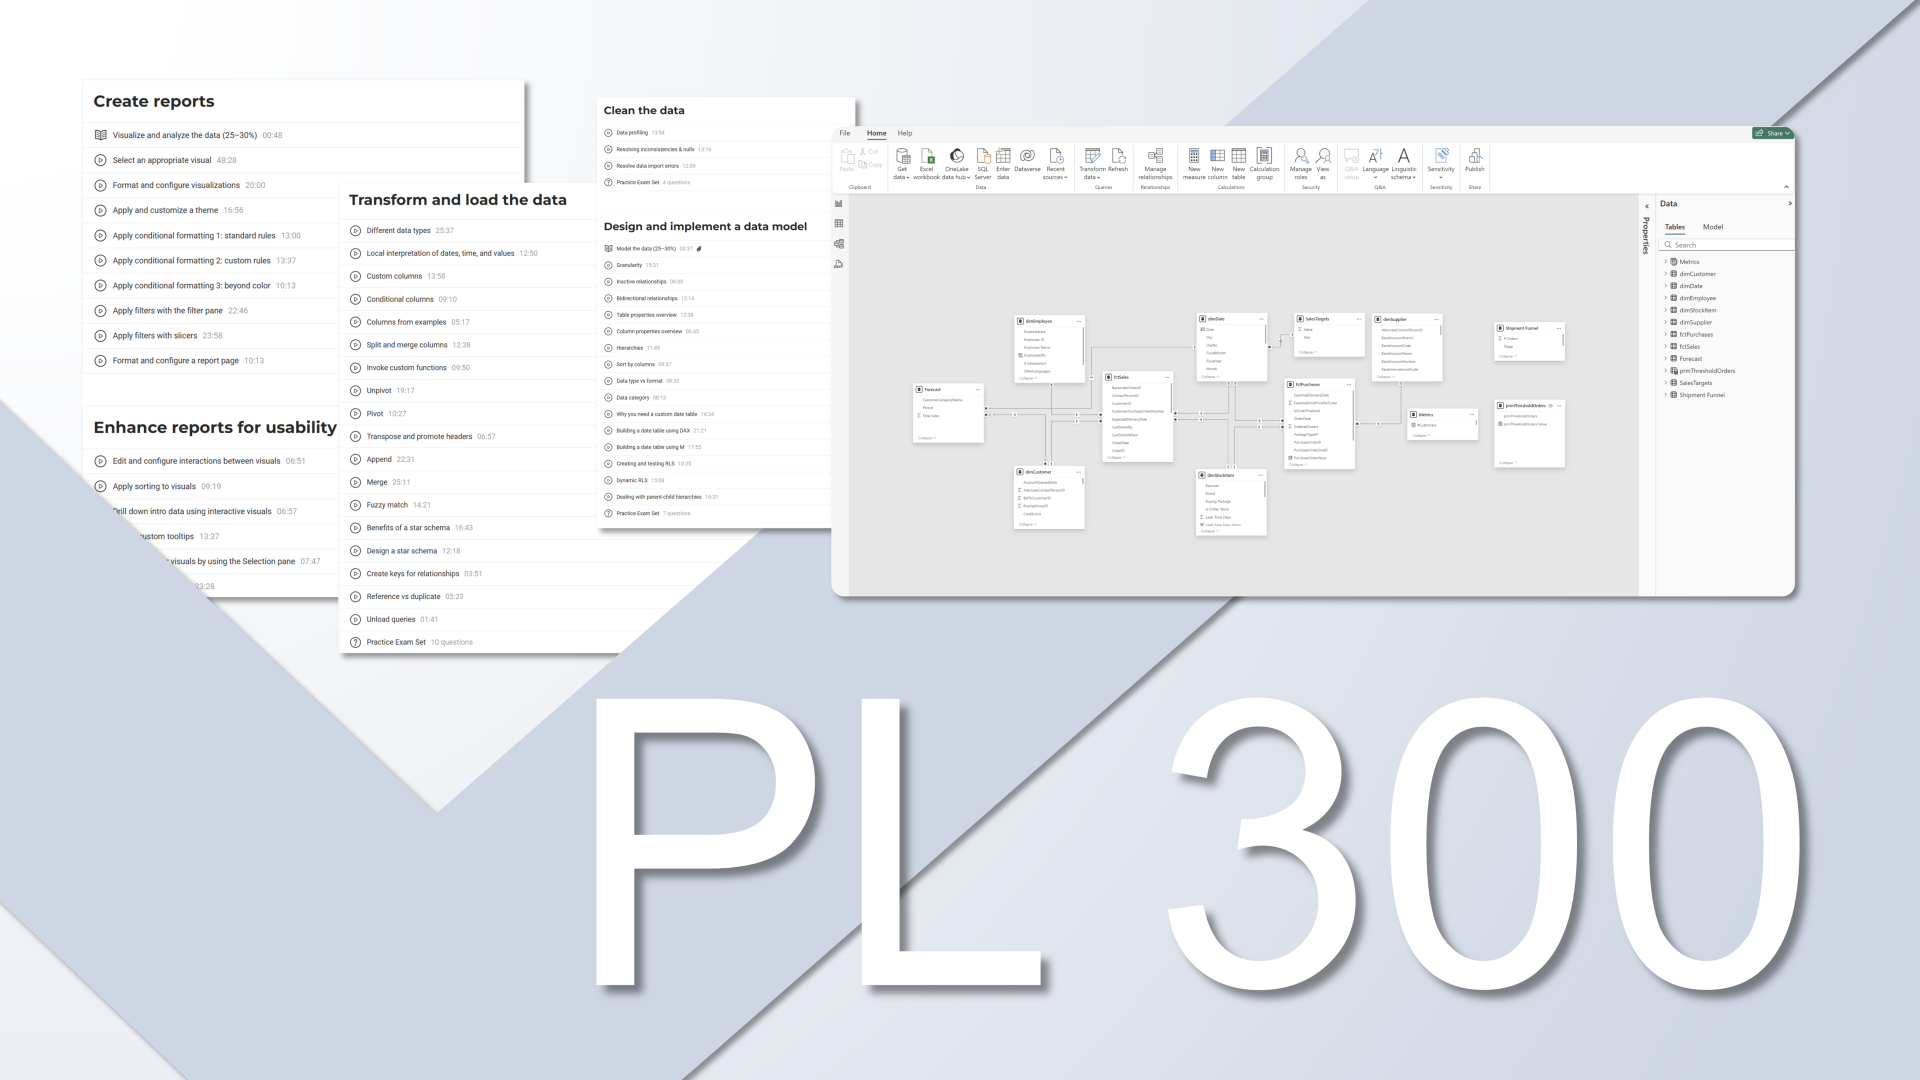
PL-300 Certification
READINESS CHECK

Answer the questions and get your score!     

If passing PL 300 is not your aim and you are looking for a different challenge,
you may want to explore a Power BI training that takes
even extremely
experienced developers to the new Power BI level. 

Write your awesome label here.

Why many experienced analysts struggle to pass?

Building reports ≠ Passing PL-300

The PL-300 exam can be a tough one for a lot of experienced analysts. Why?

It covers Power BI from end to end—everything from prepping and transforming data to building advanced visuals and optimizing reports. While most analysts get plenty of practice with things like data cleaning and building visuals, the exam dives into areas they might not touch every day, like security or managing workspaces. Basically, it expects a full-circle view of Power BI that goes beyond the basic understanding.

Then there’s the exam format itself, which doesn’t just test what you know but also how well you can apply it. Expect case studies and scenarios that make you connect the dots, so understanding the phrasing and framing of the questions is crucial. Practicing with exam-style questions and scenarios will make it much easier to understand what they’re looking for and help you feel confident on test day.
Write your awesome label here.


Welcome to the PL 300 Training 🚀


I’ll teach you everything about the ultimate Power BI Design Framework, the systems that I use daily to implement mind-blowing reports for my clients every single time.
 
By the end of this program, you can too.
 
We will build multiple Power BI reports together over 8 live sessions (28+ hours) in which you’ll learn all my tips & tricks. You will get access to 10+ hours of videos that dive deep into a wide range of topics, exercises, templates, frameworks and other design assets that will boost your Power BI report development.
 
You’ll become a pro Power BI developer who knows how to consistently deliver high value reports, which will position you for success.
 
You’ll be the one that:
      is asking the right analytical questions to improve report readability
      
    is confidently applying "smart" practices in data visualization
      
    knows how to work efficiently with available design and formatting options to quickly improve any report (design)
      
    knows how to approach report design process so that it is efficient and fruitful
      is a go-to person for Power BI Report Design at your organization
      is able to quickly identify and implement improvements needed for Power BI Report success 


What about Power Query, data modelling and DAX? 

These are all essential tools in the Power BI report design process. We will be developing a report from the very beginning to a production-ready state, and you’ll deepen your knowledge about every technical skill in a super practical setting. Even if you are a beginner, you’ll have access to resources that turn you into a pro in no time.

I’ve been teaching Power BI since it was released to 1000s of people in person and millions online, which enabled me to create the best resources together and to create a truly immersive experience that is not only fun, but actually has a big chance of advancing your career progression.

  15h+ videos

  Cheat Sheets

  Practical Examples

  Test Exams

    PL 300 Experience Stories

  Certificate of Completion

  Community

  Homework


Guaranteed Results!

4 weeks Power BI Design Transformation Program

 Practicing advanced design techniques such as using DAX to add dynamic report elements will widen your technical skills, which means it will be easier for you to quickly add unique design elements to the report.
 Ready-to-use and comprehensive checklists so that you focus on the right things at the right time, which means you can focus on the most value-adding parts and at the same time not miss any important details.
 Guidance on implementation so that you apply the concepts from the program, which means you will see immediate benefits for your own daily work.
 Experienced data coach so  you learn from someone who has taught thousands of people to become better at designing reports, which means you get the best learning experience.
 Bullet-proof training structure and materials so that it clicks, which means you will get definite results.
 Templates for the report designs so that you can quickly improve any report and save time on conceptualizing a completely new design.
 Hybrid learning model so that you have multiple ways to facilitate the learning and transformation process, which means you get a true mindset switch that will help you design Power BI reports.

Write your awesome label here.

Let's go!

Meet your Power BI Trainer


Hey, I’m Bas 👋! I’ve been in the data game since 2012, and over the years, I’ve seen how many people who work with data every day struggle to really master it. That’s why I started teaching people how Power BI can improve data analytics and use it as the driver of decision-making.

If you’re looking to level up your Power BI skills and crush the PL-300 exam, you're in the right place. Let's get started! 🚀
Write your awesome label here.


Okay, that's a lot of stuff. But do people actually think this program works?

Key to your success
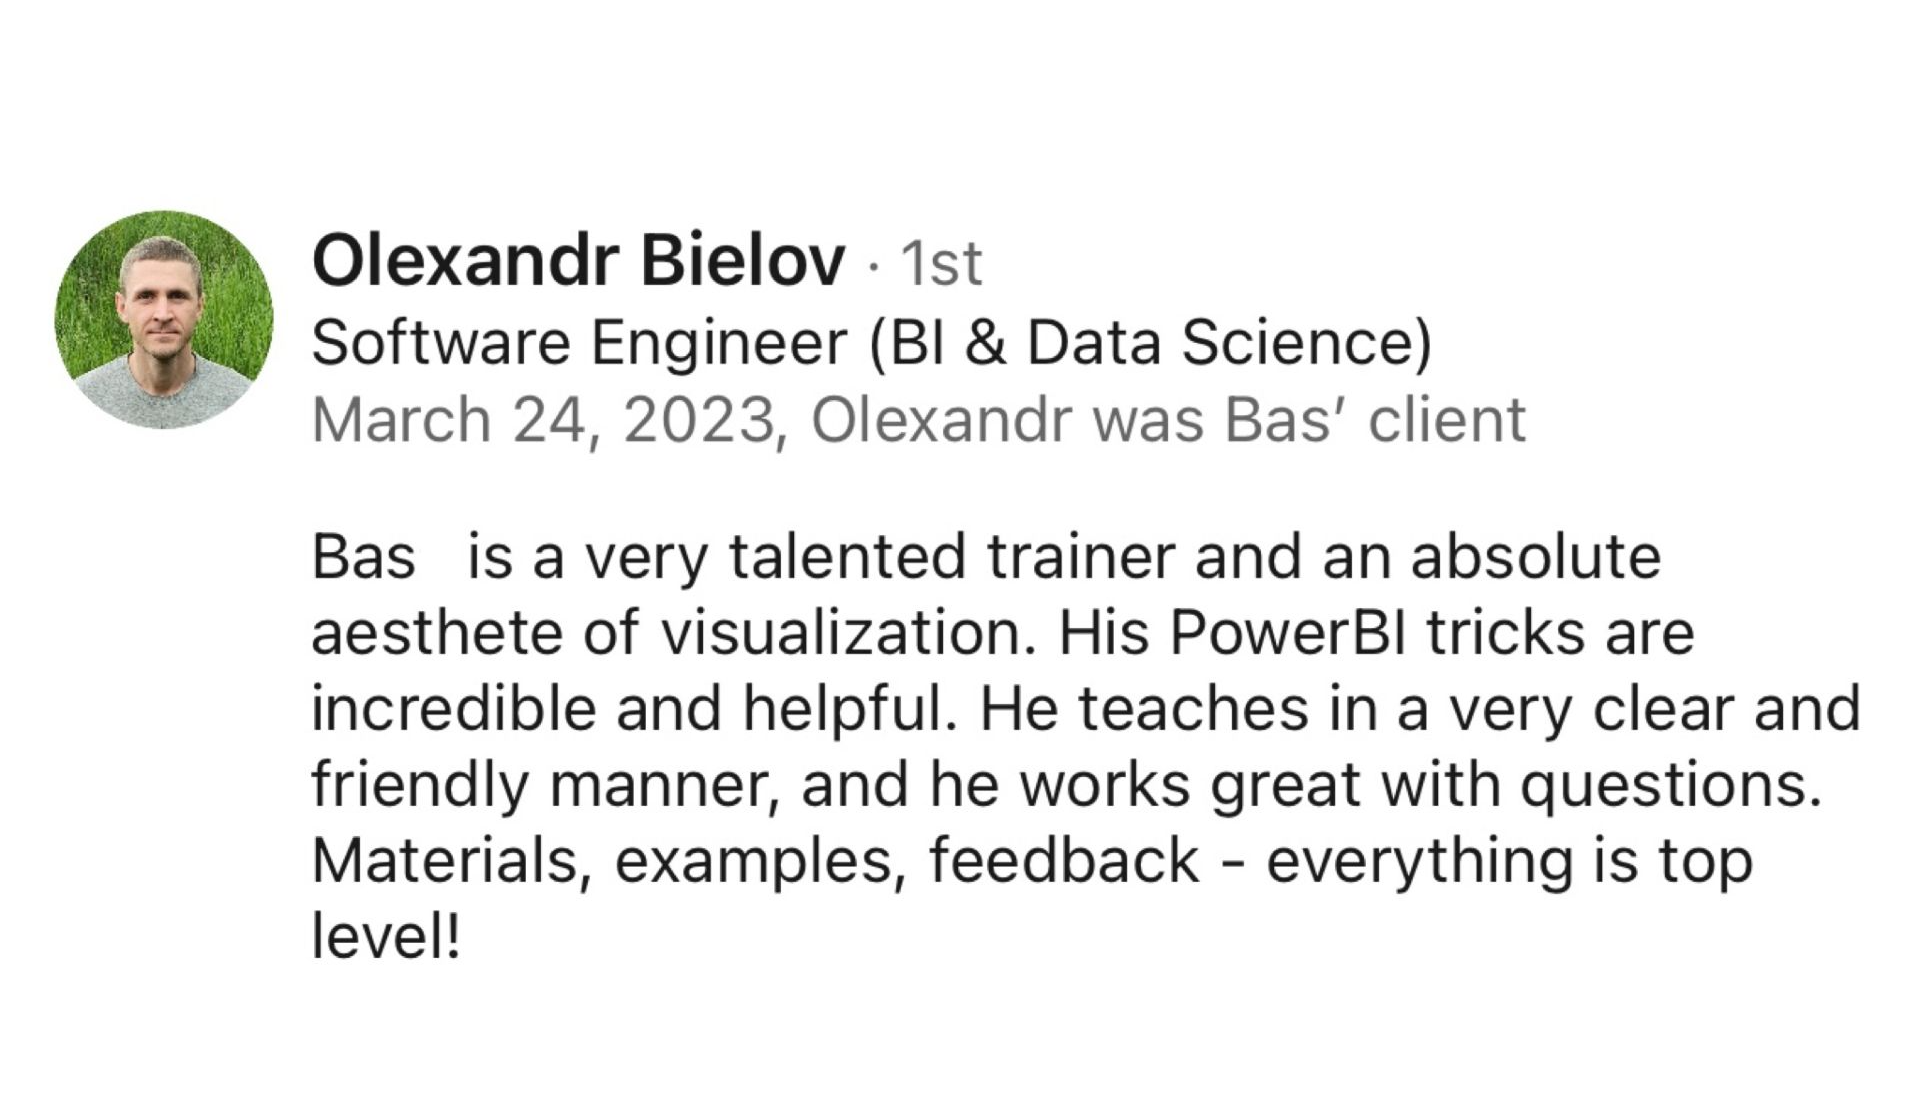
best

PBI course ever

top

level

 
highly
recommended

Okay, so the Power BI Design Transformation program has clearly worked for others. But will it work for me specifically?
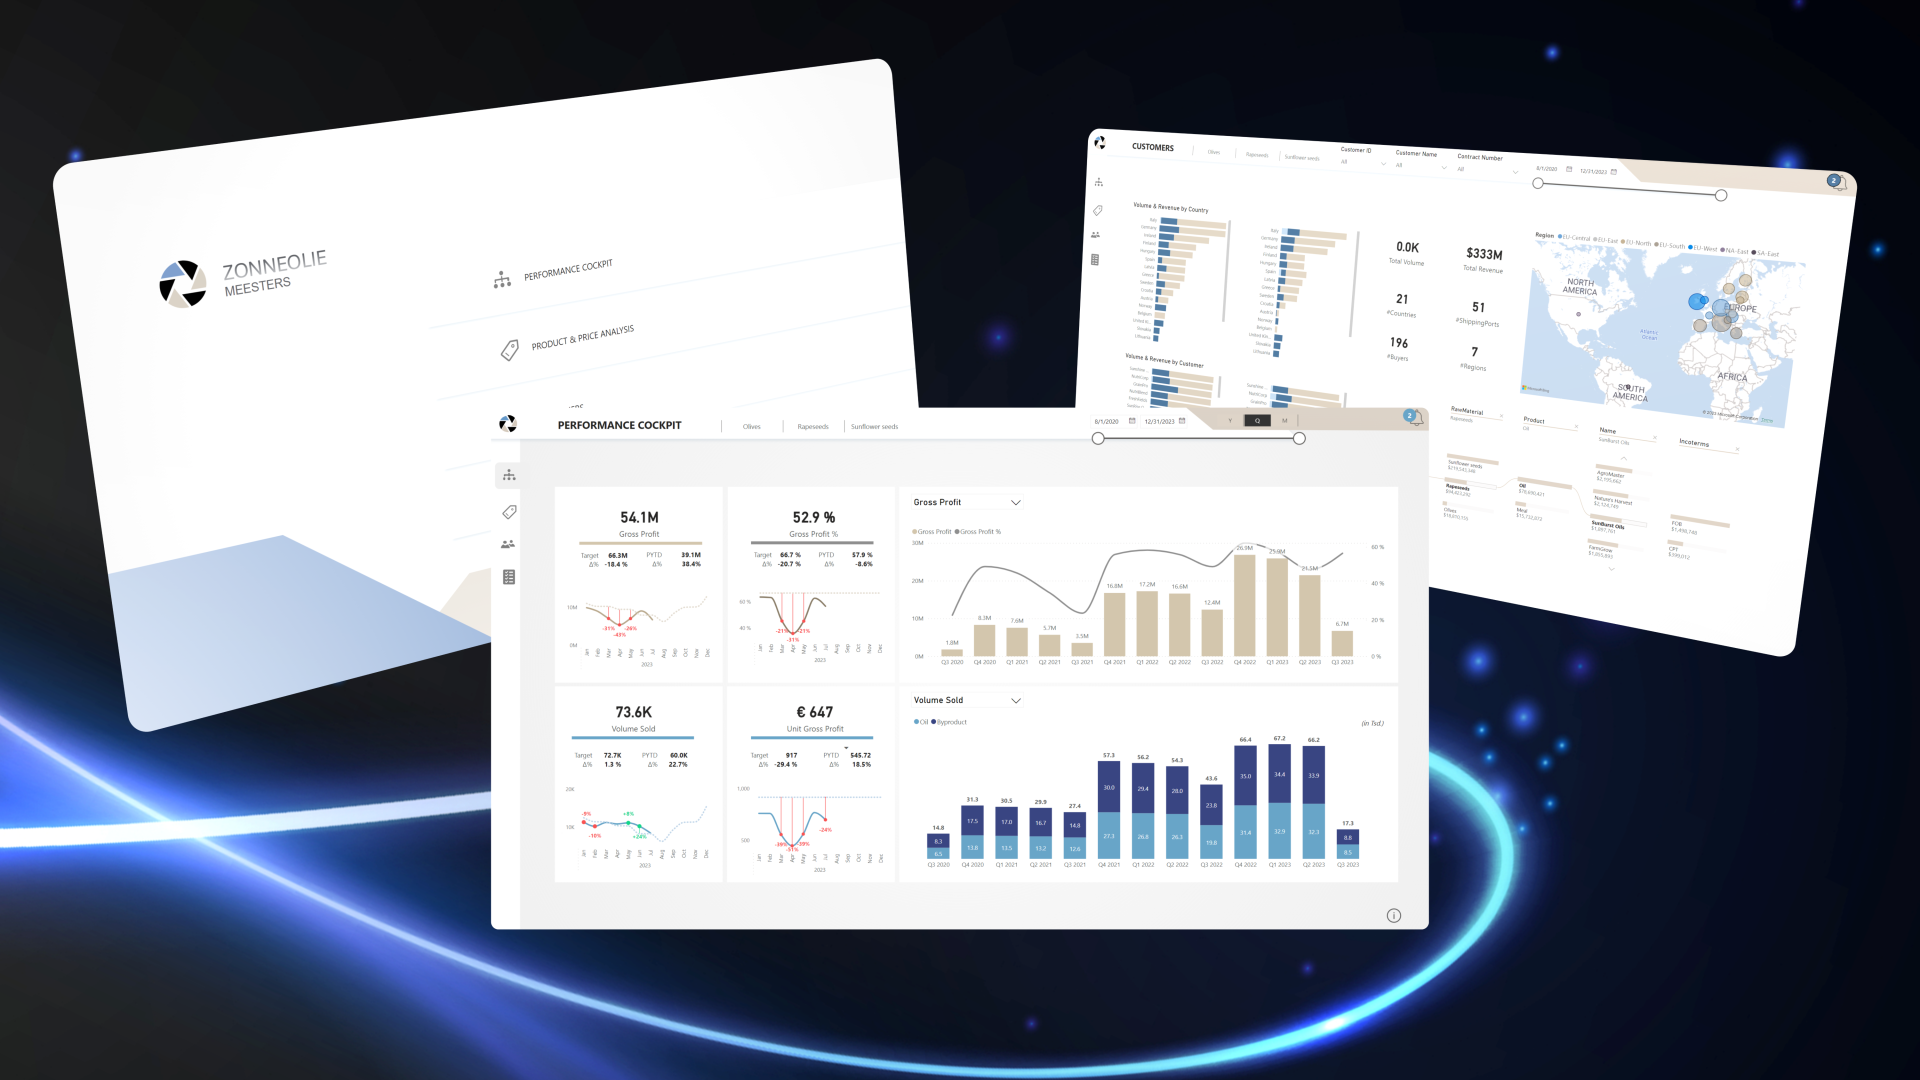

Well, that depends. This program is not like any other. To achieve a true transformation requires work – you need to be put in the reps. So that means: actively participate in live sessions, do the exercises, watch the extra materials, and start using the frameworks on your own projects.

The Power Design Transformation program is intense, and I can’t actually do the work for you. But - if you are committed to putting yourself in the best position to make yourself and your Power BI reports stand out, me and my team are here for you, and I promise you'll get large amounts of value from the course.
 
Who the course won’t work for – it is not for you if:
 
  1.  If you can’t or are not willing to put in the time and effort.
     
  2.  You are focused on learning everything about one specific technical skill. For example, this course doesn’t teach you DAX optimization, but you do learn about common DAX patterns and concepts that you need in your journey of making outstanding reports, which are widely applicable. This is also not the program for you if you want to go very deep on different data modelling techniques, this course instead focuses on essential aspects that are crucial to almost all reports.
     
  3.  You are just interested in making reports look pretty. This is not a “fluffy” training that just covers how to pick colors and create backgrounds in Figma. Yes, you will be able to make beautiful reports after this program. But besides visual design and UI/UX optimization, design in Power BI is much more. It requires you to have a solid understanding of how it interconnects with other aspects, like your data model, how measures are written, and how data transformations are applied in Power Query.
     
Again, the one thing I can guarantee is that you will never approach report development again in the same way and that you will acquire unique insider knowledge that will make you and your reports stand out.
 
 
This course assisted me with many complex issues that I couldn't or didn't know could be solved. During the course and after I managed to correct and create many reports that were requested but did not have the tools to implement.
Design is within the title but the background work that has to be done before you get to the design part was what I found most helpful. The small things made a huge difference and just understanding a few key components within Power BI made a massive difference.
This course has and will further assist me in my career and that is down to Bas and his team. Thank you. 
Leon Martin
- Feb 2023 Cohort-

Power BI PL 300

Roadmap

PART 1
PREPARE THE DATA (25–30%) 

 Get or connect to data
Identify and connect to data sources or a shared semantic model
Change data source settings, including credentials and privacy levels
Choose between Direct Query and Import
Create and modify parameters
Profile and clean the data
Evaluate data, including data statistics and column properties
Resolve inconsistencies, unexpected or null values, and data quality issues
Resolve data import errors
Transform and load the data
Select appropriate column data types
Create and transform columns
Group and aggregate rows
Pivot, unpivot, and transpose data
Convert semi-structured data to a table
Create fact tables and dimension tables
Identify when to use reference or duplicate queries and the resulting impact
Merge and append queries
Identify and create appropriate keys for relationships
Configure data loading for queries

MODULE 2
COLORS AND VISUAL EFFECTS

Get or connect to data
Identify and connect to data sources or a shared semantic model
Change data source settings, including credentials and privacy levels
Choose between Direct Query and Import
Create and modify parameters
Profile and clean the data
Evaluate data, including data statistics and column properties
Resolve inconsistencies, unexpected or null values, and data quality issues
Resolve data import errors
Transform and load the data
Select appropriate column data types
Create and transform columns
Group and aggregate rows
Pivot, unpivot, and transpose data
Convert semi-structured data to a table
Create fact tables and dimension tables
Identify when to use reference or duplicate queries and the resulting impact
Merge and append queries
Identify and create appropriate keys for relationships
Configure data loading for queries

MODULE 3
DYNAMIC ELEMENTS

Dynamic Report Elements Fundamentals I Video Learning
Designer Toolkit   I Video Learning
Turning Built-in Features Into Dynamic Elements I Live Session
Adding Custom Dynamic Elements with DAX I Live Session

MODULE 4
PUTTING IT ALL TOGETHER

Report Design Process I Video Learning
Improving Any Report in 10 Simple Steps I Video Learning
Designing a Report from A to Z: Part 1 I Live Session
Designing a Report from A to Z: Part 2 I Live Session

Our Design Program in your words


|#loved it |
#so much good content#changed my way of thinking | #extremely rich course! | #unique opportunity to see how Bas works

5/5
     

Liked the variety in case studies and loved the advanced features with SVGs. Was impressed by the richness and quality of additional materials that were provided along the course.
This complemented and provided the details that could not be covered during the training. Great way to provide the most value in the least amount of time. Lastly, I liked the pacing and timing of the training. It allowed time to practice and go deeper in certain topics. An extremely rich course! Strongly recommend it.

Robert
Feb 2024

5/5
     

Bas is very approachable and flexible in how he gives this training. There's always room for questions and side-steps based on student interests. He's very good at making this training interesting for people on all levels. 
There's just so much good content in the training that I'll nerd out about for months to come. The ability to access the sessions and materials afterwards is a big plus - I know I can come back to things in the future. 


Lynn
Feb 2024

5/5
     

Program provides insights on both technical and design skill which take my report to another level. Love this program!


Munin
Feb 2024

5/5
     

I liked that the course covered all stages of report preparation. It even included a larger list of topics and tricks than I had anticipated. It's very convenient that the portal has videos with all the explanations, and I'll be able to revisit any topic if necessary. I'm very glad I had the unique opportunity to see how Bas works, ask him questions. It's definitely a leap in professionalism, which is why I took the course.


Ruslan
Feb 2024
Achieve your goals

SIGN UP NOW

Early Bird Deal!

only until 30th November 2024

Waiting list

Dates: May/June
Time zone: EST/CET and AEST / PST
Format: Self paced and/or Live

Thank you!


Questions?

Let us know!