Answer the questions to help us finalize the theme
Why stakeholders' feedback matters most?
- Feb 2023 Cohort-
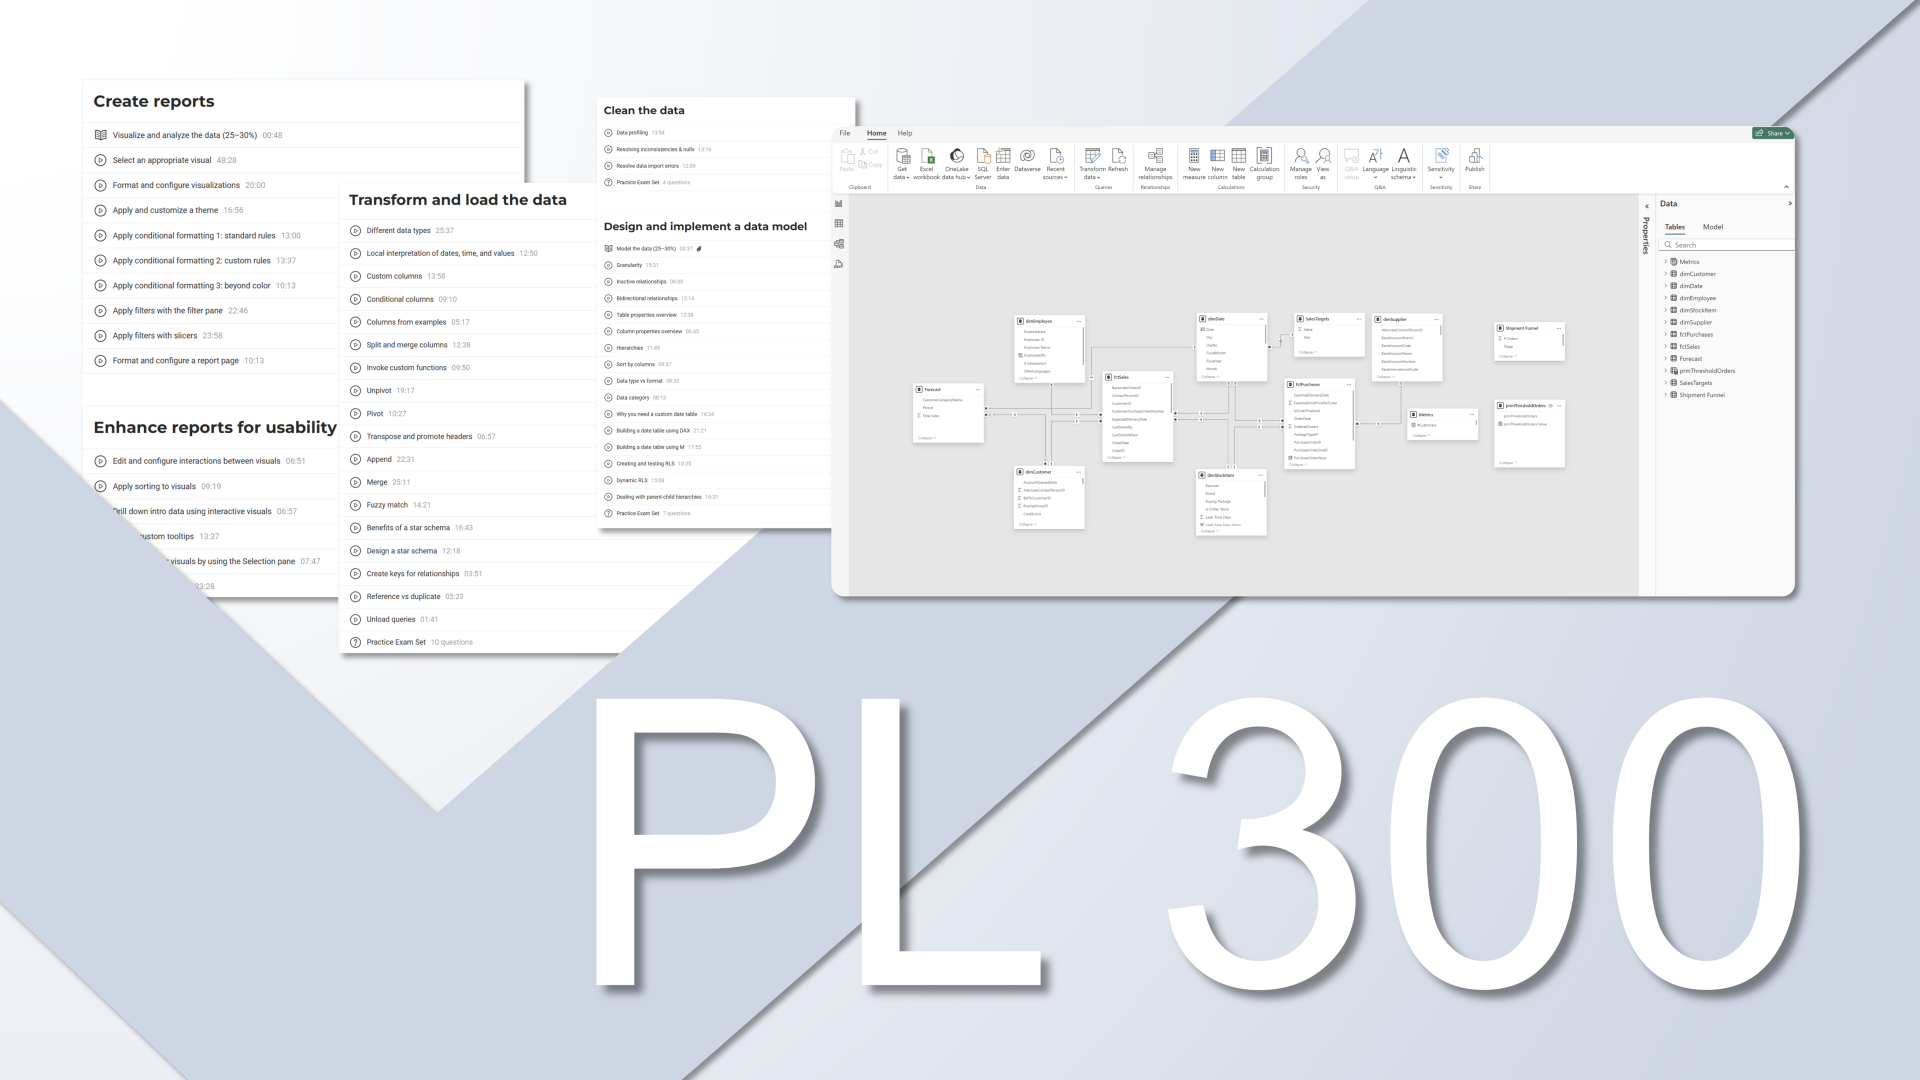
Power BI PL 300
PART 1
PREPARE THE DATA (25–30%)


MODULE 2
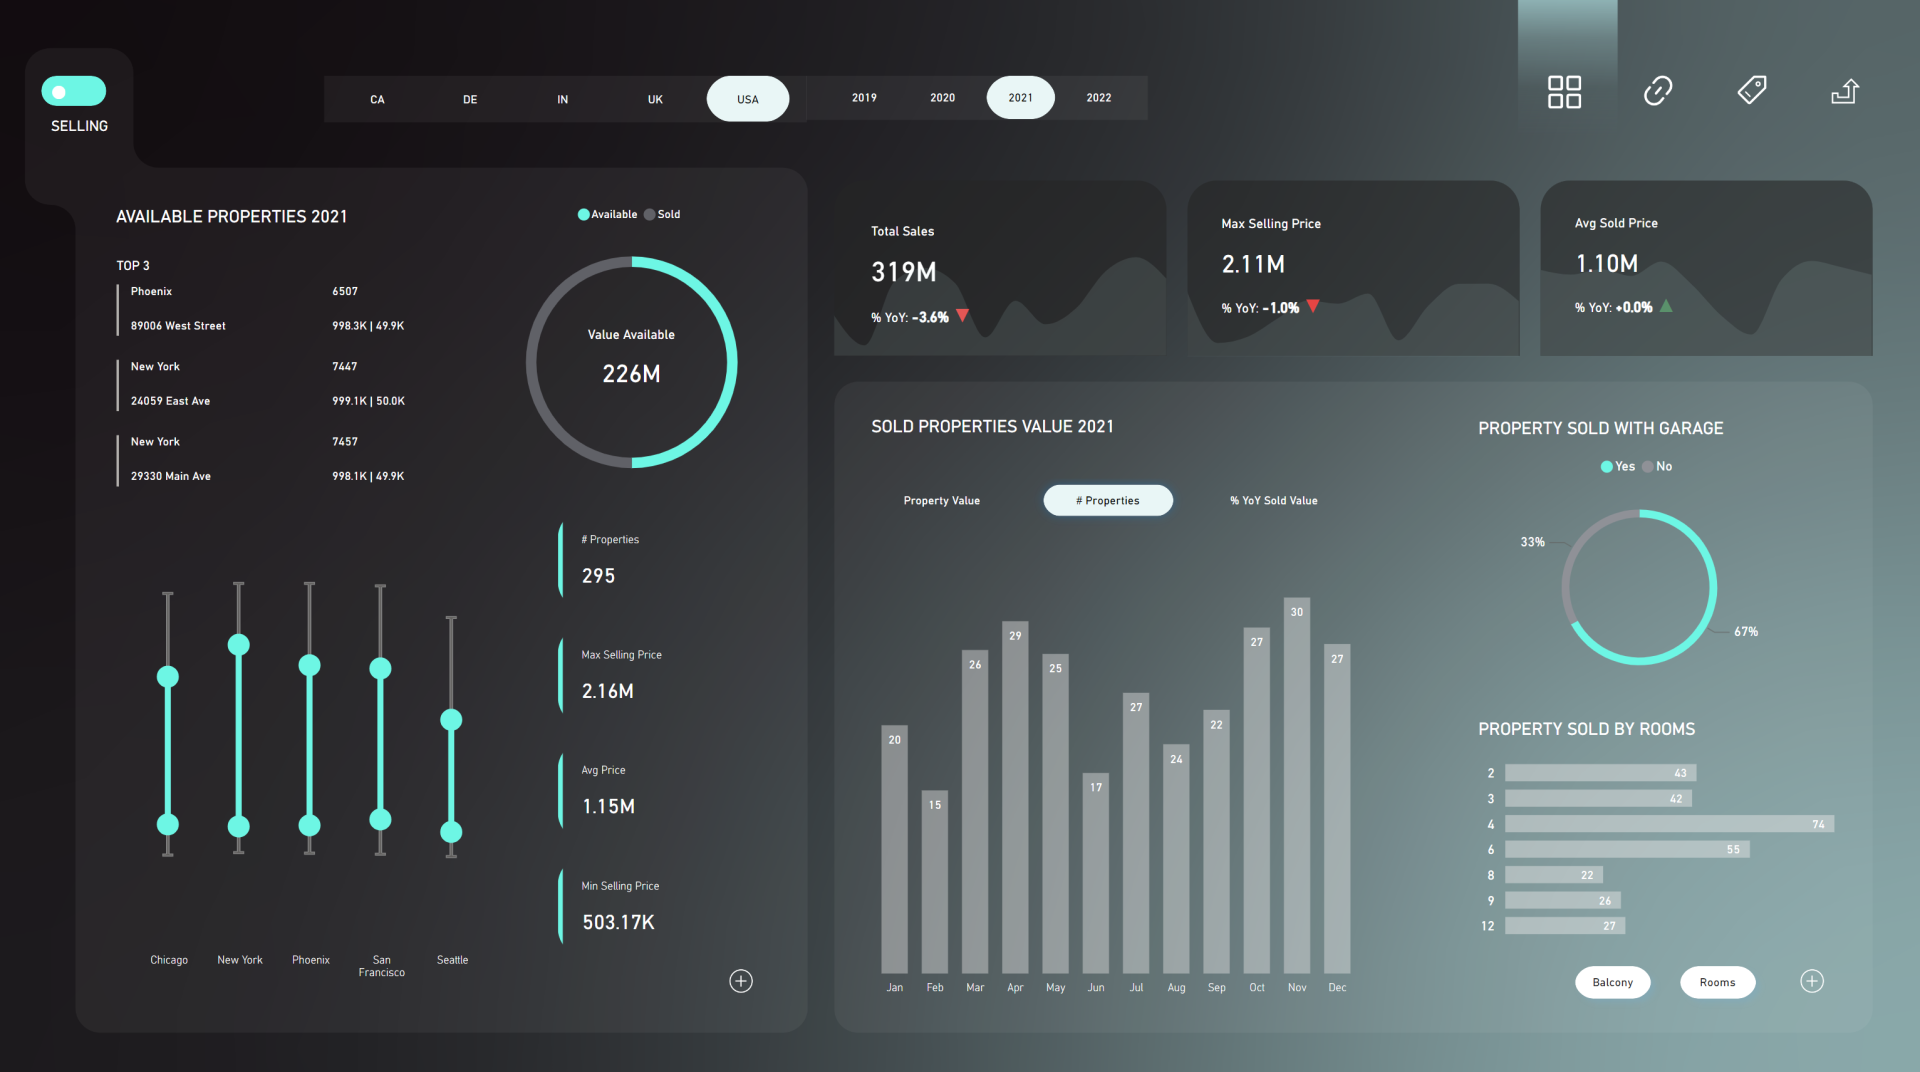
COLORS AND VISUAL EFFECTS
MODULE 3
DYNAMIC ELEMENTS


MODULE 4
PUTTING IT ALL TOGETHER
Our Design Program in your words
|#loved it | #so much good content | #changed my way of thinking | #extremely rich course! | #unique opportunity to see how Bas works
5/5
5/5
Bas is very approachable and flexible in how he gives this training. There's always room for questions and side-steps based on student interests. He's very good at making this training interesting for people on all levels.
There's just so much good content in the training that I'll nerd out about for months to come. The ability to access the sessions and materials afterwards is a big plus - I know I can come back to things in the future.
Lynn
5/5
Program provides insights on both technical and design skill which take my report to another level. Love this program!
Feb 2024
5/5
I liked that the course covered all stages of report preparation. It even included a larger list of topics and tricks than I had anticipated. It's very convenient that the portal has videos with all the explanations, and I'll be able to revisit any topic if necessary. I'm very glad I had the unique opportunity to see how Bas works, ask him questions. It's definitely a leap in professionalism, which is why I took the course.
Feb 2024