INTERMEDIATE
2 days
Business Analytics
I am able to execute advanced Excel Functionalities and analyze data efficiently.
For who?
This training is a must for everyone who works in Excel on daily basis. We show you tips and tricks that will speed up your work and improve your analysis as well as data presentation.
In this training you will further improve your Excel skills and take it to next level: advanced conditional formatting, IF and LOOKUP functions, Pivot Tables, best practices for visualizations and more.
Business Analytics Intermediate
Roadmap
OBJECTIVE:
Understand how to perform more complex analysis with Excel and how to use more advanced options to improve the analysis and presentation of the data.
DURATION:
14h split into 4 sessions (3.5h each)
FORMAT:
Real time Training Online. Access to online environment, call via Zoom, MS Teams or Webex.
Manipulating text and data cleaning
Data Types
Data Import and structuring
Concatenating data
Searching and extracting substrings
Text to columns
Filling and deleting gaps

Advanced Formatting
Conditional Formatting Options and Tricks
Creating own conditional formatting rules
Formulas and Functions
Review of formulas (arithmetic, comparison, text, reference)
Focus on IF commands and VLOOKUPs
Copying formulas
Named Ranges
Range names in formulas
Dealing with dates and times
Troubleshooting

Grouping, sorting and filtering
Grouping dates and times, values and text fields
Using filters for row and column fields
Filtering using the filter area, slicers and timelines
Creating Dropdowns


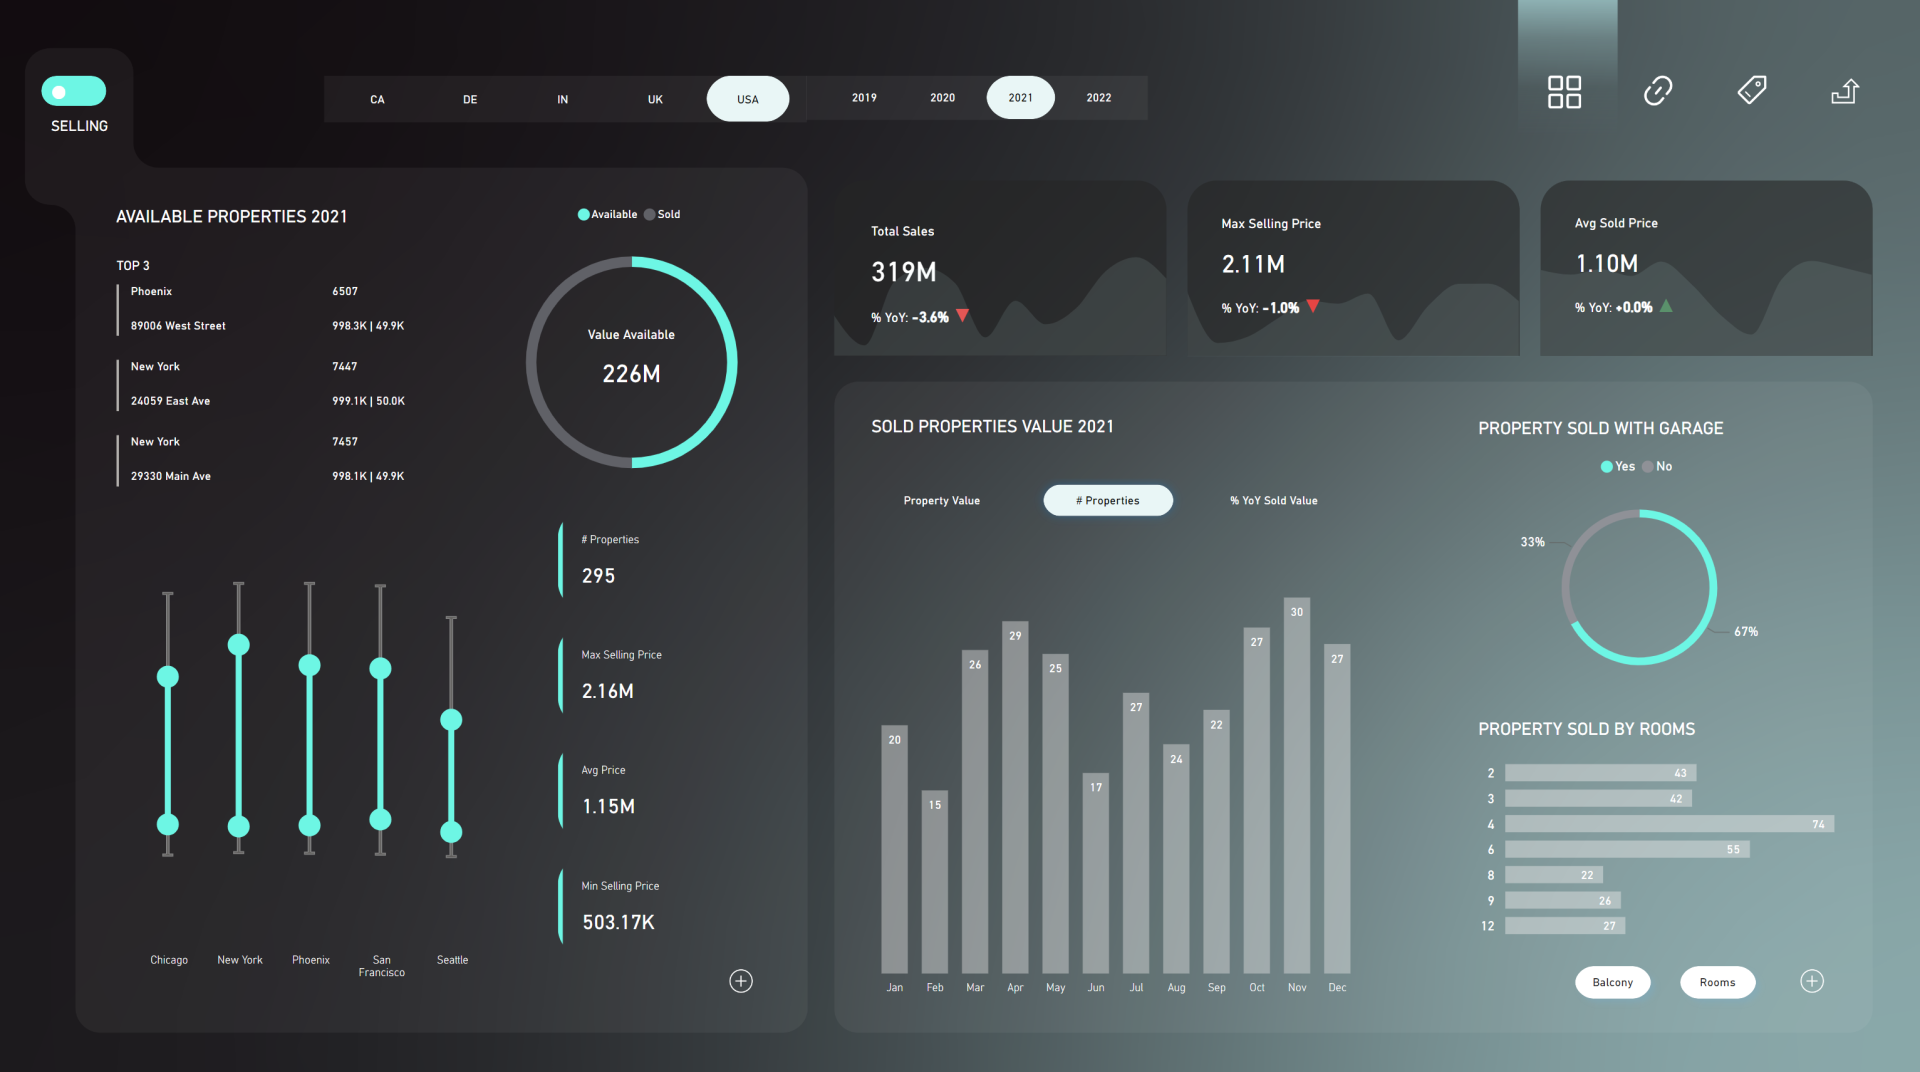
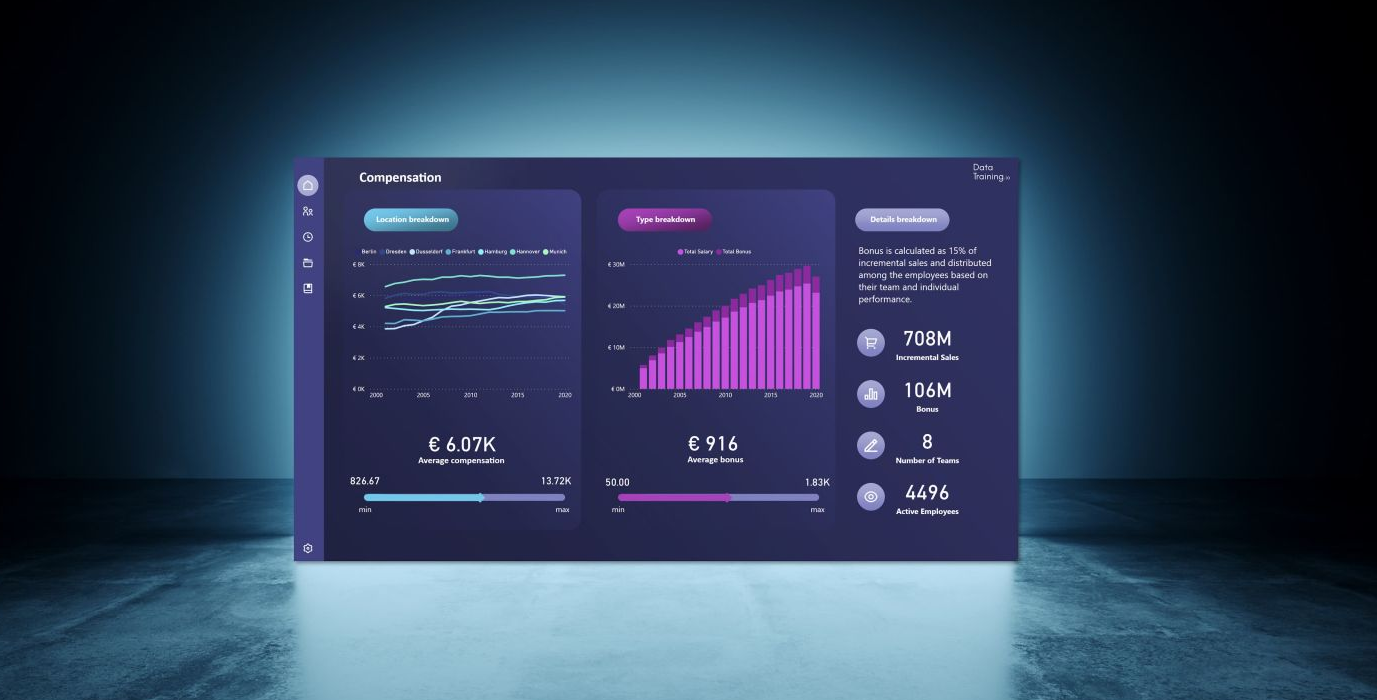
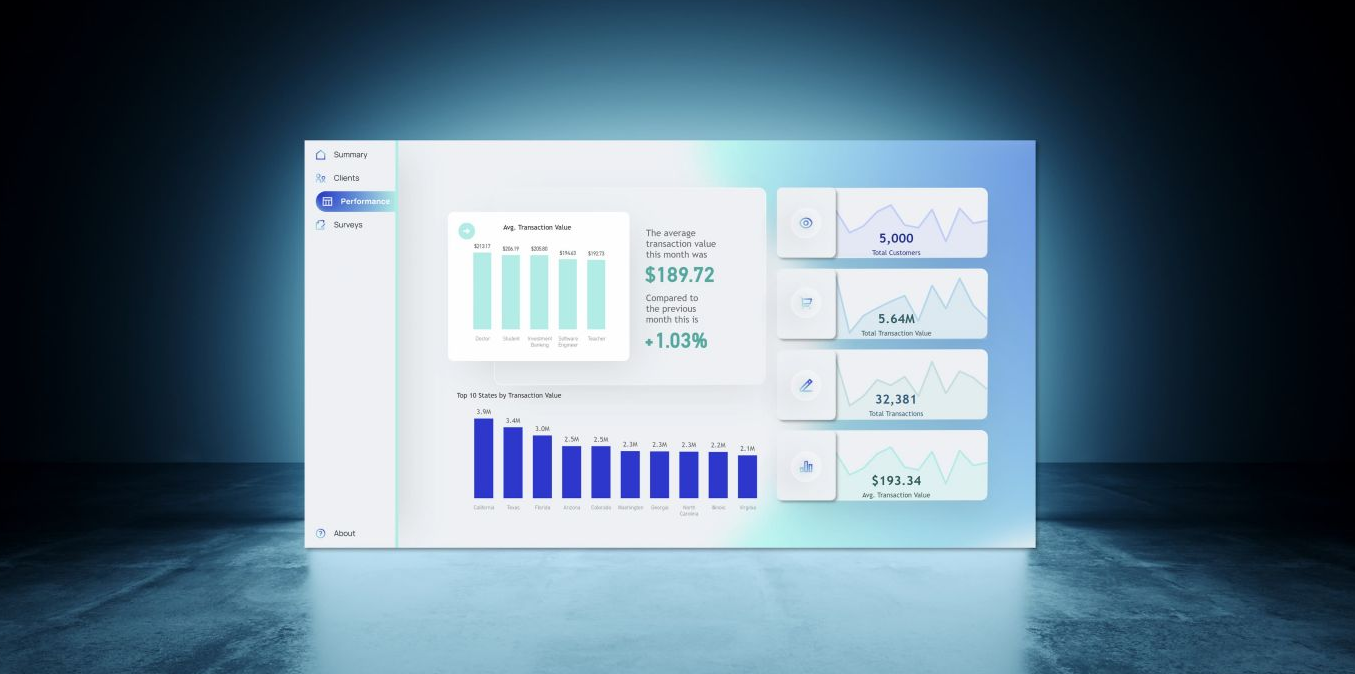
Visualizations
Choosing the right chart type
Creating chart templates
Applying best visualization practices
Integrations of dynamic elements into charts
Applying area highlights
Using conditional colors in charts
Basics of Excel Dashboard creation
Connection to Power Point

Meet your Trainer
Bas Dohmen
Write your awesome label here.
Questions?
Let us know!
We will be in touch shortly :)
Thank you!